SlideShare ist ein Scribd-Unternehmen logo
1 von 28
AT&C Losses
In absence of feeder metering in the past, substantial portion of T&D loss, including theft of electricity
wasattributedtoagricultural consumption.While, agricultural consumptionwasaround20-25%,utilities
were showing it as 35-40% and correspondingly T&D losses were shown as 20-25%. Also, T&D loss was
beingcomputedbyshowingelectricitybillsissuedtoconsumersasaccruedincome,and not onthe basis
of actual collection.Therefore,T&Dlossfiguresdidnotcapture the majorgapbetweenthebillingandthe
collection, over and above large scale of theft. To get over this problem, the concept of Aggregate
Technical & Commercial (ATC) loss was introduced.
AT&C Loss Calculation
It is the difference between energy input units into the system and the units for which the payment is
collected.
T&D Loss do not capture losses on account of non-realisation of payments.
ATC Loss is the actual measure of overall efficiency of the distribution business as it measures both
technical as well as commercial losses.
Energy Realised = Energy Billed X Collection Efficiency
ATC Loss (%) = (Energy Input – Energy Realised) X100
Energy Input
CollectionEfficiency(%) =AmountRealisedX100
Amount Billed
Main reasons for Technical Losses
 Overloading of existing lines and substation equipments
 Absence of up gradation of old lines and equipments
 Low HT: LT ratio
 Poor repair and maintenance of equipments
 Non-installation of capacitors for power factor correction
Main reasons for Commercial Losses
 Low metering/ billing/ collection efficiency
 Theft of electricity by illegal connection
 Tampering of metering system
 Low accountability of employees and corruption
 Absence of Energy Audit and Accounting
5.1 CAUSES OF AT&C LOSSES
5.1.1 INTRODUCTION:
Indian power sector currently going through reforms. But still it has problems with generation,
transmission & distribution. Indian distribution sector is suffering due to various factors but most
importantone isgreaterAT&C losses.AT&Clossesare nearabout33% in India,whichisof greatconcern
forwhole of the powersectorbecause itisdecreasingthe returnsandgeneratingdissatisfaction.Inorder
to reduce these lossesMOP is introducing various incentive schemes. They are also emphasizing on the
restructuring&privatizationof distributionof power.Whenwe talkaboutdistributionthe firstthingthat
comes into our mind is AT&C losses. So when we go through the structure of distribution, that is from
transmission –distributioninterface tometeringatconsumerend,we are able tofindoutlossesatvarious
places.
AT&C losses mainly comprises of two kinds of losses:
1) Technical losses.
2) Commercial losses.
These can further be divided into sub parts. Distributionhas different stages and at each stage it has
different kind of losses. Different stages in the sense that it has losses in distribution lines and
transformers at different levels.
Basically to calculate AT&C losses, we need to calculate
AT&C Losses = Technical + Commercial losses.
Now to calculate Technical losses we require considering various factors that are as follows:
Technical losses = Line losses in 33/11kv lines + Lines losses in LT lines + Losses in the transformers.
5.1.2 TECHNICAL LOSSES:
5.1.2.1 Line losses in 33,11kv and LT lines (X):
It is a loss which incurs in the cables. These losses are there in HT as well as in LT lines and
are called as the copper losses. It can be calculated by simple formula, that is X = I2
R
There are various factors which come under it:
5.1.2.1.1 Lengthy Distribution lines:
In practice, 11 KV and 415 volts lines, in rural areas are hurriedly extended
over long distances to feed loads scattered over large areas. Thus the
primary and secondary distribution lines in rural areas; by and large
radially laid, usually extend over long distances. This results in high line
resistance and therefore high 2R losses in the line.
5.1.2.1.2 Inadequate Size of Conductors:
As stated above, rural loads are usually scattered and generally fed by
radial feeders. The conductor size of these feeders should be adequate.
The size of the conductors should be selected on the basis of KVA X KM
capacity of standard conductor for a required voltage regulation. Table a
& b give the length of lines for 11 KV and 415 volts corresponding to
different loads for the voltage regulation prescribed by IE rules; for
different sizes of conductors respectively.
Table-a:
 Length of 11 KV line corresponding to different loads
 Size of conductor (with code No.)
 KVA-KM for 8% volt drop at 0.8 PF
 Maximum of length of (KM)
 Load that can be connected (KW)
 50 MM2 ACSR Rabb10, 640 30 355
 30 MM ACSR Wease7,200 20 360
 20 MM2 ACSR Squir5,120 15 341
The figures are for a conductor temperature of 600C. For a conductor
temperature of 500C, the above figures shall be about 3% higher and for a
temperature of 700C about 3% lower.
Table-b:
 Length of 415 volts line corresponding to different loads
 Size of conductor (with code No.)
 KVA-KM for 8% volt drop at 0.8 PF
 Maximum of length of (KM)
 Load that can be connected (KW)
 30 MM2 ACSR Rabb11.76 1.6 7.35
 20 MM ACSR Wease4.86 1.0 4.86
 13 MM2 ACSR Squir5.58 1.0 5.58
 30 MM2 AAC ANT 12.06 1.6 7.54
 16 MM2 Gnat 6.96 1.0 6.96
The figures are for a conductor temperature of 60 C. For a conductor
temperature of 50o C, the above figures shall be about 3% higher and for
a temperature of 70o C about 3% lower.
5.1.2.1.3. DistributionTransformersnot locatedat LoadcenterontheSecondary
Distribution System:
Often DTs are not located centrally with respect to consumers.
Consequently, the farthest consumers obtain an extremity low voltage
even though a reasonably good voltage levels maintained at the
transformers secondaries. This again leads to higher line losses. Therefore
in order to reduce the voltage drop in the line to the farthest consumers,
the distribution transformer should be located at the load center to keep
voltage drop within permissible limits.
But there is a possibility that the load center may have more than one
supplier and the area is so congested that it is difficult to put transformers
in that areaor there canbe the Government restrictions alsolikeaccording
to electricity act 2003 supplier is not allow to use areas, which are under
army control and the premises of Government buildings.
5.1.2.1.4. Lower Power Factor:
In most LT distribution circuits, it is found that the PF ranges from 0.65 to
0.75. A low PF contributes towards high distribution losses. For a given
load, if the PF is low, the current drawn in high. Consequently, the losses
proportional to square of the current will be more. Thus, line losses owing
to the poor PF can be reduced by improving the PF.
5.1.2.1.5. Bad Workmanship Resulting in Poor Contacts at Joints and
Connections:
Bad Workmanship contributes significantlytowards increasing distribution
losses. Efforts should, therefore, be made to have the best possible
workmanship.
Various factors of bad workmanship are:
i) Large no. of Joints on the line results in larger losses.
ii) Lose connections to the transformer bushing-stem, drop out fuse,
isolator, and LT switch etc. results in fringing loss.
iii). Deteriorated wires and services also causes leaking and loss of power.
5.1.2.1.6. High LT/HT lines:
High LT/HT ratio also leads to high losses because an LT line incurs more
losses than the HT lines. This happens because HT lines runs at higher
voltage with low current which reduces copper losses in HT lines but in LT
lines voltage is lower than that of HT lines it means that it has higher
current level than the HT lines and in turn higher copper losses.
5.1.2.1.7. Losses in meter coils:
Electromechanical meter has two coils, potential coils & current coil.
Potential coil losses are constant i.e. does not vary with load. But current
coil losses vary with load. These losses are basically I2R losses.
Electromechanical meters have more losses because of presence of coil.
Due to electronic components in the static meters, the losses are less.
That’s why now a day government is implementing electronic meters at
every level.
5.1.2.1.8. Street light network:
The losses in street lights network are due to ballast Al wires and street
light cable network. 11 hours working is assumed for calculations. The
ballast losses are taken standard as per the size of the lamp. The loading is
considered as per the general practice of connecting streetlights.Using the
current carrying capacities of the street light cables and by applying the
percentage loadings losses are calculated.
5.1.2.2 Losses in the transformers:
These kinds of losses are incurred in the core of the transformer and that is why it
is called as core losses. Different levels of distribution system needed transformer
of different rating and therefore have different core losses. Manufacturers also
use to define these core losses for transformer of different ratings but condition
become worse when power factor starts falling.
Some of the factors which comes under it is as follows
5.1.2.2.1. Over-rated Distribution Transformers and hence their Under-
Utilization:
Studies on 11 KV feeders have revealed that often the rating of DTs is much
higher than the maximum KVA demand on the feeder. Over rated
transformers draw unnecessary high iron losses. In addition to this, iron
losses in over rated transformers the capital costs locked up is high. From
the above it is clear that the rating of DT should be judiciously selected to
keep the losses with the permissible limits. For
an existing distribution system the appropriate capacity of distribution
transformer may be taken as very nearly equal to the maximum KVA
demand at good PF (say 0.85). Such an exercise has been carried out for a
number of distribution systems and transformers with capacity of 25, 63,
100, 160, 315 KVA and standardized for different with power factors and
diversity factors.
But practically seeing it is not likely to have transformer of same rating as
required because one need to see the future demand level. Like if we put
transformer of equal rating as require than inthat case,in future it become
difficult to add new consumers or if we going to add consumer on such
kind of transformer than in that case transformer will going to be
overloaded and this can leads to low voltage problem or transformer
burning.
So before installing the transformer we are required to do cost-benefit
analysis for each level in order to find out that it is economical to install
transformer of higher rating now or later.
5.1.2.2.2. Low Voltage (less than declared voltage) Appearing at Transformers
and Consumers Terminals:
Whenever the voltage applied to induction motor varied from rated
voltage, its performance is affected. Within permissible voltage of + 6% of
the affect practice, the supply voltage varies by more than 10% in many
distribution systems. A reduced voltage in case of induction motor results
in higher currents drawn for the same output. For a voltage drop of 10%,
the full load current drawn by the induction motors increase by about 10%
to 15% the starting torque decreases by nearly 19% and the line losses in
the distributor increases by about 20%. As the bulk load of rural areas and
small scale industrial areas consists of induction motors, the line losses in
the concerned distribution systems may even touch 20%.
5.1.2.2.3. Losses in Transformers:
Transformer generally faces two kinds of losses, i.e.
a) No load losses:
Such kinds of losses use to remain fixed. These losses remain irrespective
of load, basically these are the losses in core of transformer. Only variation
in frequency & voltage affects these losses.
b) Load losses:
These losses vary as the load varies. These losses are directly proportional
to the square of current. As load increases in the system voltage starts
dropping due to which current start rising due to which losses also starts
rising. That’s why overloading always helps in increase in losses.
5.1.2.2.4. Harmonics
In non-linear loads, the current is of complex waveform due to dynamic
characteristics of the load. The component of the complex waveform can
be described as superposition of waveforms, called Harmonics, having
frequencies from 0 to infinity. For distribution systems which must handle
a large percentage of non-linear loads, the percentage of harmonic
currents can be very high. Switch-mode power supplies, PWM converters,
voltage source converters, fluorescent lighting with electronic ballasting,
computers are the major sources of harmonics current. About 58% of all
power used can have harmonic currents overloading transformers,
capacitors and other components on the distribution system. The
additional current will increase losses in wire, bus bars, transformers and
power factor correction capacitors used in the distribution system. The
additional heating is caused by each of the harmonic currents of high
frequencies. Harmonic current willcause voltage distortion and low power
factor. Due to harmonic current the use of line filters before a drive will
add more losses to the electrical System and could create line ringing and
large voltage transients.
5.1.3 COMMERCIAL LOSSES:
Commercial losses are also called as the non technical losses. These losses are difficult
to detect. Generally these losses are higher than the technical losses. There is no set
formula to detect these losses. India is greatly affected by this loss that is why
Governments are emphasizing more on privatization of electricity distribution.
These losses mainly incurred on HT as well as LT lines. On HT lines mainly industrial
consumers are connected. They use to steal electricity in lakhs and the great example
of that is Delhi itself. At LT lines general households and small industries remain
connected. They alsouse to stealpower but at lower extent. The biggestplayers in theft
are HT line consumers.
There are many factors which contribute into it:
Commercial losses = Theft (Direct connection + Meter by pass) + Defective meter
+Meter Stopped + Meter burnt + Wrong reading + reduce
collection efficiency + Meter tempering.
Or
Commercial losses can also be calculated by
Commercial losses = AT&C looses – Technical losses.
Commerciallosses = (Energyinput intodistribution system(MUs)-- Sales at consumer
end (MUs)) – Technical losses.
Now day’s technical losses can also be calculated through various Softwares like SMEC
India ltd. using software WI – POWER to calculate technical losses. Initially people were
use to calculate technical losses by considering each and every segment of HT and LT
lines and transformers.
5.1.3.1 THEFT:
In addition to the factors discussed above, causing an increase in line losses there
is, unfortunately, a certain amount of theft of electrical energy. Since it is often
not possible to find out culprit, the stolen energy cannot be measured and,
therefore can not be charged to any one.
Stolen energy is, therefore, considered as a part of line losses. Unscrupulous
consumers extract energy illegally by-passing the energy meter or by connecting
leads directly to the distribution lines. Theft can be of two types:
 Direct theft
 Indirect theft
5.1.3.1.1 DIRECT THEFT
a) Direct connection:
Direct connection comes under theft. In it people who do not have
connection in there premises they use to connect themselves directly to
lines. Such kind of stealing is occurred more on LT lines.
b) Meter by passing:
In meter by passing, people who already have connection connect
themselves to the lines directly. They connect phase of input to output of
meter or connect neutral of output to input of meter due to which leakage
current flows through neutral unaccounted in meter. Such kind of leakage
current are chargeable by utility and its adds up in the unit consumed.
5.1.3.1.2 INDIRECT THEFT:
a) Tampering with a meter:
Magnetic tampers
Mechanical meters can be tampered very easily even without disturbing
the wiring by using an external magnet to slow down the rotating disc.
Electronic meters too are susceptible to magnetic tampers, but modern
designs havehigh magnetic tamper immunity. Moreover electronic meters
can now be designed to “run fast” whenever tampered magnetically as a
measure of deterrence.
Use of suitable arrangements like meter boxes create a shield or increase
the air gap (or increase reluctance of flux path) to prevent magnet based
tampering.
Chemical tampers
This kind of tamper involves altering the meter performance by using
chemicals. Chemicals are often injected inside the meter to hinder its
performance. A neat installation will generally discourage this type of
tamper.
Direct tampers
In case of a single phase meter, a number of ways are being adopted by
unscrupulous consumers, by manipulation of external wires to make the
meter record less energy.
In case of a 3 phase meter, external wiring can also be manipulated to
make the meter slow, and wrong phase association will render the energy
readings meaningless.
Methods of tampering are evolving methods, and with each method to
arrest tampering, ingenious methods to tamper once again are constantly
being developed by crafty minds. The theft of electricity is a challenge that
needs to be eradicated if the electricity distribution industry is to remain
sustainable and viable.
Other methods of tampering:
 Adding more resistance to input and output circuit of electronic
meter and reduce current flow in meter.
 Adding a wire parallel to I.C. in electronic meters.
 Using remote control to on and off the supply in the meter.
5.1.3.2. Un-metered power supply
Unmetered supply to agricultural pumps and single point connections to small
domestic consumers of weaker sections of the society is one of the major reasons
for commercial losses. In most states, the agricultural tariff is based on the unit
horsepower (H.P.) of the motors. Such power loads get sanctioned at the low load
declarations. Once the connections are released, the consumers get into the habit
of increasing their connected loads, without obtaining necessary sanction, for
increased loading, from the utility. Further estimation of the energy consumed in
unmetered supply has a great bearing on the estimation of T&D losses on account
of inherent errors in estimation. Most of the utilities deliberately overestimate the
unmetered agricultural consumption to get higher subsidy from the State Govt.
and also project reduction in losses. In other words higher the estimates of the
unmetered consumption, lesser the T&D loss figure and vice versa. Moreover the
correct estimation of unmetered consumption by the agricultural sector greatly
depends upon the cropping pattern, ground water level, seasonal variation, hours
of operation etc. To increase the food output, almost all the State Governments
show benevolence to farmers and arrange supply of electric power for irrigation
to the farmers at a nominal rate, and in some States, without charges at all. In
view of this, most Electricity Boards supply power to agriculture sector and claim
subsidy from the State Govt. based on energy consumption. Since the energy
supplied to the agriculture sector is a generous gesture by the State Govt., all the
electricity boards have eliminated energy meters for agriculture sector services.
The absence of energy meters provides ample opportunities to SEBs to estimate
average consumption in agriculture sector at a much higher value than the actual.
In the absence of energy meters, most of the SEBs resort to fudging consumption
figures to include not only the under estimated T&D Losses but also energy theft
from their system. The extent of fudging is more in the States where agricultural
activity is high. The benefit derived by these boards is not only the extent of
subsidy from the respective States but also self praise, by showing much less T&D
losses. Further the boards are ignoring the inefficiency in operating the
distribution system by blaming the agricultural supply for all ills and raising the
tariff of other consumers. Most of the methods being employed by SEBs for
estimating the Unmetered energy consumption are as follows: -
 Load factor based estimation.
 Estimation based on feeder wise theoretical calculation of losses.
 Estimation based on readings of meters installed at all the Distribution
Transformers located on a feeder. However, none of these methods
provide correct estimation of unmetered consumption.
5.1.3.3 Defective Meter:
Slow meter:
Such kind of losses generally occurred after 11/0.4kv feeder in the meter. In this,
meter runs slower than the prescribed speed. Such kind of meter produces losses
to utility because it shows wrong reading. And ultimately these wrong reading
effects the returns of the utility from the consumer.
5.1.3.4 Meter Stopped:
Stopped meter doesn’t read any unit of electricity due to which it becomes
difficult to charge exact figure from the consumer. But utilities are require to
charge the consumed power from the consumer, for that they use to find out the
averagebill of that particular consumer and chargea particular amount from them
in order to reduce their losses to some extent.
5.1.3.5 Meter Burnt:
Meter can be burnt
a) Unintentionally:
In this meter gets burnt due to some technical factors or meter is of old age.
b) Intentionally:
In it meters are burnt by user themselves. They burnt meter in order to have
average bill to save money. This is an ill legal activity. In both the cases consumer
receives average bill but utility suffer from losses. But in second case, if caught
consumer either has to face penalty or legal proceedings.
5.1.3.6 Wrong Reading:
Wrong readings can be taken by reading reader due to
a) Error in display:
Some times meter watch glass gets blurred or sometimes numbers gets erased
from the reading panel due to which it become difficult for the reading reader to
note readings correctly. So such kind of errors create problem for the utility
because due to this error they use to loose great amount. Each unit of electricity
lost due to this error adds to revenue lost.
b) Intentionally:
Reading reader sometime gets involved in the illegal activities and for the small
amount of bribe they record wrong reading. And this activity causes less profit to
the power utilities. So in this case utilities require taking some effective measure
in terms of technology (like spot billing, GIS system) or supervision.
5.1.3.7 Reduced collection efficiency:
Such kind of losses is incurred at the consumer end. In it utility or distribution
company charge an amount according to the reading in the meter at consumer
premises. But in this case consumer is not willing to pay the bill. Due to which
these distribution companies falls into losses. Thesecompanies become unable to
pay to the generating companies and other debtors. And due to this reduced
collection efficiency their bad debts starts increasing the great example of this is
Orrisaand Delhi.In Orrisabad debts had become huge in 1997 due to which Orrisa
had reached to the World Bank and World Bank had suggested them to privatize
their distribution sector in order to bring reforms and to reduce bad debts. In Delhi
also reforms is brought in the forms of corporatization in order to reduce bad
debts in the balance sheet. Collection efficiency of any distribution company
shows its effectiveness in the sector.
5.1.3.8 Unbilled meters:
Some time due to disputes between utility and consumer bill is not issue to the
consumer. Due to which utility cant able to recover from those consumers. Those
meters remain un-billed.
5.1.3.9 Misuse of tariff:
Tariff can be misuse when some body from commercial side commences business
without informing to authority. They start doing any profitable task at commercial
rate. Then it termed as misuse of tariff. Like suppose a doctor starts his clinic at
his residence than in that case he is doing a profitable work at his home at
commercial rates without informing to the authorities. Such kind of activity is
considered as illegal activity. For every category i.e. commercial, agriculture and
industrial the tariff structure is different and every consumer need to pay in their
category.
5.1.3.10 Unauthorized extension of load:
Some time consumers use electricity more than the allowed capacity. Initially
consumers apply for particular capacity but after some time they use to increase
their capacity without information to the authorities. Without seeking permission
to any authority they increase their load and start using electricity in unauthorised
manner. In unauthorized use of electricity households and companies use to
consume electricity more than that of allowed capacity. For example suppose a
company is using 75 KVA of power but the allowed capacity for it is 50 MVA then
the remaining 25 KVA comes under unauthorized. Consumers generally tab the
over head lines, meter cabin, street light loop-in box, pillars and secondary of
transformer.
5.1.3.11 Defaulter/Delayed payments:
Defaulter comes under those consumers who pay their bills lately. Defaulters
some times increase the collection efficiency and some time they decrease the
efficiency. Increase in efficiency happens due to the payment of defaulters in
some other period.
5.1.3.12 Unaccounted meter:
Meter which has been installed but utility doesn’t have any account of that meter
means they doesn’t have meter key number. In this case meter remains
unaccounted and leads to revenue loss.
5.1.3.13 CT ratio errors:
CT ratio errors consumer of higher load require bigger capacity meters like
suppose that there is a consumer whose load is very high that consumer need
current of 1000A. But meter for 1000A current is not possible soin that caseutility
install meter of appropriate capacity and use to record reading of that meter. For
bill generation a multiply factor is multiply with the reading of meter to find out
actual consumption of the consumer. In case of wrong factor the whole bill of the
consumer will going to change and will impact on revenue realization for utility.
5.1.3.14 Meter no. mismatch:
Meter no. mismatch can be possible when a discom replaces meter of a consumer
and doesn’t take it into account. Then in that case discom will going to have old
meter reading for the consumer and when a meter reader will going to record the
new reading from new meter it will going to result into mismatch in the reading it
would be considered as faulty reading.
5.1.3.15. Provisional billing:
Some times due to some reasons it become difficult for the discom to have exact
reading of the consumer than in that case discom generates average bill to the
consumer on the basis of few previous months. The reason for it can be meter
burnt, meter steel etc.
5.1.3.16 Bills pending for assessment:
This generallyhappens in caseofthe temporary connection. The bills oftemporary
consumer have to be kept for assessment.
5.1.3.17 Bill not delivered:
Some times utility not able to deliver bill to consumer due to consumer absence
from his premises, or some times bill gets misplace by the delivery man or by the
post man. These all factors add up non delivery of bill and creates problem in the
revenue realization.
5.1.3.18 Disconnected with dues:
Some of the temporary disconnected consumer doesn’t pay their dues to the
utility due to which they comes into the category of permanent disconnected
consumer and the dues of those consumer become a loss for the utility which are
called as arrear.
5.1.3.19 Meter (address) not traceable:
New meter has been installed but address of that meter is not traceable. In that
case bill of that meter is not delivered.
5.3 SUGGESTED SOLUTIONS
We have seen various factors of AT&C losses in previous sections. For these factors we can apply
some alternate solutions. They are as follows:
5.3.1 SOLUTIONS FOR TECHNICAL LOSSES:
5.3.1.1 Line losses in 33/11kv and LT lines (X):
Such kind of losses occurs in conductors which carries power from one substation
to other and to consumers. The factors of line losses are already explained in
previous chapters. Various states in India are implementing some common and
some different kind of measures for various problems, which are as follows:
5.3.1.1.1 Lengthy Distribution lines, inadequate size of conductor, Distribution
Transformers not located at Load center on the Secondary Distribution System:
Above are some of the losses whichincurred due to some technical factors
like resistance, current etc. Change in the length and size of the conductor
also changes resistance of the conductor. So the increase in the length and
decrease in the sizeof the conductor increases resistanceof the conductor
which in turn increases losses. The possible solution for such kind of
problem is to
a) Reduce conductor length up to suitable length.
b) Increase conductor size.
c) Install new transformers at the load center if the distance is too large
from substation to load center. West Bengal, Punjab, Haryana and many
more are installing new transformers in various circle to reduce losses due
to dislocation of transformer.
d) Bifurcate or Trifurcate feeders in order to reduce the length of the
conductor. The single conductor for several region results in increase of
length and losses so the division of conductor help in reduction of losses.
The good example of this is Haryana which is separating the distribution
lines for each region.
e) Energy audit: Energy audit can be conducted in order to find out losses
due to increased length of conductor and transformer dislocation at
various areas.
5.3.1.1.2. Lower power factor:
The lower power factor can be improved by application of shunt
capacitors. The lower power factor arises due to imbalance between
capacitance and inductance. Shunt capacitors can be connected in the
following ways:
i) Shunt capacitors are connected on the secondary side (11KV side)
of the 33/11 KV power transformers.
ii) Line losses in LT distribution lines may also be considerably
reduced by installing shunt capacitors of optimum rating at
vantage points.
The optimum rating of capacitor banks for a distribution systemis 2/3rd of
the average KVAR requirement of that distribution system. The vantage
point is at 2/3rd the length of the main distributor from the transformer.
A study made in an urban distribution system fed from a 200 KVA. 11
KV/415 volts transformer with 300 HP CL of more than 200 consumers
having small loom loads showed the range of PF of the distribution system
varied from 0.65 to 0.70. The reactive power requirement was 135 KVR.
The inductive loads occurred on the distribution systembetween 7 AM and
8 PM; on all the working days with almost constant load-cycle. The
capacitor bank rating 42.5 KVAR were installed at 2/3rd the distance from
the transformer on the main distributor and were switched on and off
manually at 7 AM and 8 PM respectively on all working days. The loss
reduction was thus fund to be 6-7%. The releasedcapacity in this particular
study was 42 HP, which could be supplied to the additional consumers.
iii) A more appropriate manner of improving this PF of the distribution
system and thereby reduce the line losses is to connect capacitors
across the terminals of the consumers having inductive loads. The
extent of reduction of line losses in this manner depends mainly on
the extent to which the PF of consumers is improved. In this case,
the capacitor is connected in parallel to the terminals, the
capacitors being switched on and off together with the equipment
itself.
Many electricity supply authorities are modifying their tariff conditions to
make it compulsory for the consumers to provide capacitors for all types
of installations with connected loads of 5 HP and above. By connecting the
capacitors across individual loads, the line loss is reduced from 4-9%
depending upon the extent of PF improvement.
Many states are installing new capacitors at 11kv feeder and 0.415kv
feeder. The best example of this is WestBengalwho has installed199 lakhs
of 28.5 MVAR capacitor at 11kv feeder and Maharashtra who have started
low tension load management system (LTLMS) under which Maharashtra
is planning to install 27KVAR and 36KVAR in 20 districts, not even this
Punjab, Haryana, Andhra Pradesh, all are in a process of implementing
capacitor at various levels and more over promoting scheme for
installation of capacitor on agriculture pumps.
5.3.1.1.3. Bad Workmanship Resulting in Poor Contacts at Joints and
Connections:
i) Joints are a source of power loss. Therefore the number of joints should
be kept to a minimum. Proper jointing techniques should be used to
ensure firm connections.
ii) Connections to the transformer bushing-stem, drop out fuse, isolator,
and LT switch etc. should be periodically inspected and proper pressure
maintained to avoid sparking and heating of contacts.
iii). Replacement of deteriorated wires and services should also be made
timely to avoid any cause of leaking and loss of power.
5.3.1.1.4. High LT/HT lines:
High LT/HT line means the higher losses because LT lines carries large
current than the HT lines so due to this I2R losses arehigher in LTlines than
HT lines.Andhra Pradesh is planning to reduce their LT/HTratio up to 1.4:1
in 2007 like wise Haryana is trying to reduce ratio from 1.82:1 to 1.80:1 in
2007. West Bengal has 0.98:1 and Kerala has 6.14:1 (excluding EHT) LT/HT
ratio. The best possible solution for this is to implement HVDS.
HVDS (High voltage distribution system):
On LT lines technical losses are higher, but it can be reduce by
implementing HT lines up to the consumer end. Madhya Pradesh had
launched it in Bhopal, and Assamis also implemented it at pilot basis. Not
even this Maharashtra is planning to launch HVDS in its 9 major cities and
many states and utilities are in a line to implement it.
In HVDS a transformer is installed on the pole with distribution box below
it and from this distribution box consumers get supply. 12 consumers can
be connected to one distribution box. Up to transformer 11kv line is
connected and from distribution box to consumer premises 440/230V line
is connected. So as transformer are installednear to consumer itdecreases
LT lines and increases HT lines.
Increasein no.of substationsneartoloadcenterandconstructionofnew
HT lines:
Each year every utility and SEB set a target to increase their no. of
substation and no. of HT lines in order to reduce their losses and to
improve their efficiency. By building substation near to load center
because it helps in reduction in I2R losses and more over I2R losses are use
to remain low in 132 KV , 33 KV ,11 KV bus bars.
5.3.1.1.5. Losses in meter coils:
Electromechanical meter has two coils in it one is potential coil and the other is
current coil. Potential coil incur no load loss where as the current coil incur I2R
losses. So in order to reduce these losses electronic meters are the best solution.
These kinds of losses are negligible as compare to other factors in AT&C losses.
5.3.1.2. Losses in the transformers:
5.3.1.2.1. Over-rated Distribution Transformers and hence their Under-
Utilization:
For the reduction of loss due to over rated transformer one can
implement:
a) Load forecast:
In it one try to find out the future and present demand of the area in which
transformer is to be install. Load forecasting for future gives the idea, that
how much capacity of transformer is require in that particular area. Load
forecasting should be based on the demand of each category. One should
have the correct idea of current as well as future demand of domestic,
industrial, commercial, agriculture. And accordingly one should install
transformer of appropriate capacity for each area. But generally utilities
fail to do a correct load forecasting and due to which losses incurs.
b) Energy audit:
Energy audit helps to find out the various places where losses incur. With
the help of energy audit we can find out overrated transformer and
transformer of appropriate capacity required.
5.3.1.2.2. Low Voltage (less than declared voltage) Appearing at Transformers
and Consumers Terminals:
As voltage level decreases it results in the increase of losses. Reduction in
the voltagelevel is permitted up to +/- 6%. The above situation is corrected
by operating an “on-load-tap changing” in the power transformers
situated at high voltage sub-stations 66/11 KV sub-stations and providing
on the 11 KV feeders a combination of switched capacitors and automatic
voltage regulators. Further, the “off load tap changing” in distribution
transformers is adjusted prior to the commencement of agricultural load
season, which is readjusted before the one-set of monsoons when the
rural load is small the off-load tap changing gear is available.
5.3.1.2.3. Load Loss and no-load loss in Transformers:
This can be improved by making improvement in transformer design and
by installing amorphous core transformer of appropriate capacity.
5.3.1.2.4. Harmonics:
Harmonics generally effect power factor of the system, produce high
neutral current and distorts the desired wave form. For the reduction of
harmonics in the distribution system utilities either install
a) FILTERS:
Shunt Filters normally used for shifting natural/resonant frequency of
electrical system under harmonic influence and also helps to improve
power factor at fundamental frequency.
b) LOAD BALANCING:
In order to reduce harmonics in the system another solution is to balance
load between the different phases. Due to load balancing harmonics get
reduces.
5.3.2 SOLUTIONS FOR COMMERCIAL LOSSES:
5.3.2.1. THEFT:
In INDIA theft consumes most of the revenue of the SEBs and utilities.People have
different means to steel the power. And most of the states in India are suffering
from this problem. When we go in depth of this we find that the bigger offenders
are the industrial consumers because they are the bulk consumers on the HT side.
Whereas the consumer on the LT side also steel power but theft made by them
are comparatively very low than HT consumer, but have significant value. One can
follow two kind of approach:
1) Scientific approach
2) Management approach
SCIENTIFIC APPROACH:
a) 100% Metering:
In order to reduce losses due to theft one should need to confirm
accountability of the no. of unit consumed by the consumers as well as the
no. of units deliver to the feeder. For that purpose it is necessary to have
meter at each level of distribution network i.e. at transformers and
consumers, so that one can easily detect theft by comparing the figures.
Many of the states like Punjab, Haryana,
Maharashtra, Andhra Pradesh etc. are installing meters at each level of
distribution in order to not only have accountability of units which is to be
charged from the consumer as well as to count the amount of units which
comes under subsidy. Meter helps to find out the losses and in turn help
to detect theft.
b) FIXING OF RESPONSIBILITIES:
In order to ensure greater accountability, it is better to make a person in
charge of the respective feeder and made accountable for the preparation
of feeder-wise energy accounting / audit. And this will make the person
accountable to find out theft and the losses due to other reasons.
c) HVDS (High voltage distribution system):
Highvoltage distribution systemhelps to reduce theft becausein it HTlines
lay up to the consumer end poles. So this makes difficult for the people to
steel electricity due to high voltage in the cable.
Consumer equipment works at the lower voltage than the voltage in line,
so it is of no use to steel electricity on such high voltage. Steeling of
electricity from such system is harmful for the consumer equipment.
d) Low voltage distribution system (LT ABC)
In LT ABC is a aerialbunch cableis installedat up to poles at consumer end.
These cables carry voltage of 440V. This cable ends up in the distribution
box, from this distribution box 8 consumer can be connected. Thesecables
save any kind of direct connection by the people.
e) Under ground cables:
Under ground cables like XLPE cable can be used for theft reduction. Such
cables are drawn under ground to consumer end.
f) GIS System:
GIS system gives the status of the consumer that at which DT consumer is
connected and what kind of consumer he is whether he is industrial
consumer, agriculture consumer, commercial consumer or domestic
consumer. It also helps in doing energy accounting. This in turn helps to
calculate the losses due to theft, so with the assistance of this systemone
can easily detect the theft in particular area.
g) Franchise The Distribution:
Theft can also be reduced by outsourcing distribution of electricity.
Franchise can be allotted an area for electricity distribution. Maharashtra
had implemented distribution franchise in Bhiwandi in order to reduce
theft. Distribution franchise takes care of all the system and by reducing
losses it earns its share. Utility can implement franchise model at various
levels like for billing, metering, collection and for operation and
maintenance.
h. Automated meter reading (AMR):
Automated meter reading consists of meter with GSM/PSTN modem
which is than connected to data base by GSM/PSTN network respectively.
In such kind of system utilities can gather data and information of the
consumer without visiting the consumer premises. With the help of it one
can able to detect theft like meter tampering and meter by passing.
i. Pre-Paid meters:
In Pre-Paid meter consumer require to purchase a card from utility office.
This card has a number which is require to fill in the meter with the help of
key pad already there on the meter. It enables consumers to track and
monitor their consumption. And in turn helps to reduce theft.
MANAGEMENT APPROACH:
a) ENFORCEMENT DEPARTMENT:
Every utility have this department for theft reduction. This department use
to conduct field survey and try to catch up the consumers who make theft
by checking their premises. They issue notice to the offender and remove
meter from offender premises. This department use to categories the
offender above 10kw and below 10kw. And according to the sections in
electricity act 2003 they use to punish offenders.
b) OTHER INITIATIVES:
Different utilities implements different schemes in order to reduce losses
like voluntary disclosure scheme (VDS) and late payment surcharge
scheme (LPSE) implemented by BSES and JJ cluster scheme. In VDS
consumer need not to pay any penalty but required to pay new meter
deposit fee. In LPSE consumers need to pay surcharges. And in JJ cluster
scheme NDPL persuade consumer to have electricity from meter. If in a
region 90% of people doesn’t have meter in their premises than in that
case NDPL will not going to provide any service and facility to that region.
In this way NDPL concentrate on the particular cluster. Now day’s discoms
also give reward to those people who inform the discom about the theft.
5.3.2.2 UN-METERED POWER SUPPLY:
100% METERING OF CONSUMERS:
The only solution for un-metered power supply is 100% metering. Due to 100%
metering of consumer utility can have an account of subsidized units of electricity
in comparison to the actual consumption of subsidized consumer.
DT METERING:
With the help of DT metering one can able to find out transformer wise
consumption and due to it can able to measure unit consumed in subsidized area.
5.3.2.3 DEFECTIVE METER, METER STOPPED AND METER BURNT:
Solutions for such kind of factors are:
a) ENFORCEMENT DEPARTMENT:
Enforcement department use to detect such kind of factor by periodic
checking of consumer premises. And on the basis of this periodic checking
utilities try to find out the consumers who have such kind of meters.
Enforcement department people use to issue notice to such consumer.
Some time they put penalty on the consumer who do not places any
complaint. NDPL people follow same procedure and guidelines of
electricity act 2003. And it is mandatory for all utility to exercise the
proceeding against offender according to electricity act 2003.
b) REPAIR AND REPLACEMENT:
Other solution for this is either replaced stopped and burnt meter or repair
the defective and stopped meter. NDPL and BSES are use to exercise this
thing.
c) FRANCHISE:
Utility can franchise the metering, billing and collection so in that franchise
take care of the all the meter related activity.
d) AUTOMATED METER READING:
AMR can be implemented to detect the stopped, defective and burnt
meter. In it all the information of the consumer meter can be downloaded
in the data base. So with the help of it utility can have information of
stopped, defective and burnt meter.
e) RELIABLE METERS:
Now a day utility are installing electronic meters which are more reliable
than the previous meters. Electronic meters can store various information
about the meters and units consumed by the consumers. This information
helps to find out the meter status. This data can be analyses to find out the
reason for defective, stopped and burnt meter.
f) METER TESTING DEPARTMENT:
Utility generally has their testing department, which use to test the faulty
meters. Such department needs to be strengthening in order to reduce the
chance of defective, stopped and burnt meter by technical and non
technical fault.
5.3.2.4. WRONG READING, REDUCED COLLECTION EFFICIENCY AND UNBILLED
METERS:
These factors directly effects the revenue generation of the distribution company.
The possible solutions for such kind of problems are
a) ELECTRONIC METERS WITH DIGITAL DISPLAY:
When we talk about electromechanical meters thesemeter have arotating
disk and a mechanical reader. As these meters gets old their functioning
get poorer and poorer and also numbers on the display get blurred due to
which it become difficult to record correct reading. For this purpose
electronic meter can be installed. These electronic meters have digital
display which doesn’t have tendency to get blurred and therefore remove
chances of recording wrong reading.
b) SPOT BILLING:
Spot billing can be use to reduce the chances of wrong reading, improve
collection efficiency and reduce unbilled meters. In spot billing a person
use to keep a hand handling device and with the help of this device he
generates bill in the consumer premises. So with the help of spot billing
one can improve revenue collection.
c) PRE-PAID METERS:
Pre paid meters are those meters in which doesn’t require reading of
meters, it also helps in improving the collection efficiency because meter
works only when a consumer fill it with the recharge card and it eliminates
the chances of unbilled meter as consumer need to take care of recharging
of meter.
d) AMR:
With the help of AMR the chances of wrong reading will going to become
nil and more over every meter will going to have an account in the data
base of discom which will going to help discom for generation of bill.
e) SOFTWARE UPGRADATION:
Many states like Punjab, Haryana, West Bengal, Kerala and Maharashtra
are trying to upgrade their billing software in phases so that every meter
get the correct bill without any discrepancy.
f) ON-LINE BILL COLLECTION:
Many states and utilities are implementing on line collection of bills.In this
a customer can use internet to pay his bill.
5.3.2.5. MISUSE OF TARIFF AND UNAUTHORIZED EXTENSION OF LOAD:
a) ENFORCEMENT CELL:
Enforcement cell use to implement different method to detect and to reduce
these factors.
1) Reward System:
In reward system discom generally provide reward to those people who
use to provide information of misuse of tariff. Discoms also use to conduct
consumer awareness program to motivate the people to complaint against
the defaulter.
2) By Meter Reader Information:
Meter reader also use to inform the enforcement department and helps
out to find out the defaulters.
3) Periodic Checking:
Periodic checking of consumer premises helps in finding out the misuse of
tariff.
b) DATA ANALYSIS OF ELECTRONIC METER (MDI)
Electronic meters use to carry many information of consumer consumption out of
these information one can get the maximum demand information of the
consumer by the MDI value.
c) DATA ANALYSIS:
Data analysis helps to find out the consumption pattern of the consumer. So with
help of it one can easily find out the increase in load demand of the consumer.
5.3.2.6. DEFAULTER/ DELAYED PAYMENTS AND UNACCOUNTED PAYMENTS:
a) Spot billing can be used to generate bill at consumer premises and therefore
helps to reduce the delayed payment and defaulters.
b) Prepaid meter can also be implemented for the reduction of unaccounted
payments and delayed payments.
c) Up gradation of software is required to improve the performance of billing in
order to reduce unaccounted payments.
d) Online billing can also help to reduce the delay in payment by the consumers.
e) Stress assetmanagement is can be one of the solutions for accountability of the
defaulters.
f) Data analysis can be help to find out the defaulters and ultimately will help in
stress asset management.
5.3.2.7. BILLS NOT DELIVERED:
SPOT BILLING:
Spot billing helps in the reduction of misplace of the bill because in spot billing,
device use to generate bill in the consumer premises so it become difficult to
misplace.
OUTSOURCE BILL DISTRIBUTION AND COLLECTION:
Outsourcing of bill delivery is the better option because in the outsourcing all the
liability of bills is transferred on to the other person.
5.3.2.8. CT RATIO ERRORS:
CT ratio errors can be improved by having a CMRI of proper rating according to
the meter. CMRI is a hand handling device with a multiply factor for different
categories.

Weitere ähnliche Inhalte

Was ist angesagt?

Power grid operation in India
Power grid operation in IndiaPower grid operation in India
Power grid operation in IndiaMahim Srivastava
 
Relay coordination
Relay coordinationRelay coordination
Relay coordinationD Målîk
 
Substation protection devices
Substation protection devicesSubstation protection devices
Substation protection devicesRahul Aman
 
Transformers protection, an introduction
Transformers protection, an introductionTransformers protection, an introduction
Transformers protection, an introductionH. Kheir
 
Unit 03 Protective relays
Unit  03 Protective relaysUnit  03 Protective relays
Unit 03 Protective relaysPremanandDesai
 
Power Transformer Protection
Power Transformer ProtectionPower Transformer Protection
Power Transformer ProtectionAng Sovann
 
Transformer protection
Transformer protectionTransformer protection
Transformer protectionjawaharramaya
 
Transformer design and protection
Transformer design and protectionTransformer design and protection
Transformer design and protectionashwin fcc
 
Alternator protection
Alternator protectionAlternator protection
Alternator protectionjawaharramaya
 
Load Forecasting Techniques.pdf
Load Forecasting Techniques.pdfLoad Forecasting Techniques.pdf
Load Forecasting Techniques.pdfAjay Bhatnagar
 
Relay Setting Calculation For REF615/ REJ601
Relay Setting Calculation For REF615/ REJ601Relay Setting Calculation For REF615/ REJ601
Relay Setting Calculation For REF615/ REJ601SARAVANAN A
 
220 KV Substation Operation & Maintenance
220 KV Substation Operation & Maintenance220 KV Substation Operation & Maintenance
220 KV Substation Operation & MaintenanceHimansu Pradhan
 
Presentation on substations
Presentation on substationsPresentation on substations
Presentation on substationsvishalgohel12195
 
ABB - TRANSFORMERS-PROTECTION-COURSE (2001)
ABB - TRANSFORMERS-PROTECTION-COURSE (2001)ABB - TRANSFORMERS-PROTECTION-COURSE (2001)
ABB - TRANSFORMERS-PROTECTION-COURSE (2001)J. FR
 
Protection of transmission lines (distance)
Protection of transmission lines (distance)Protection of transmission lines (distance)
Protection of transmission lines (distance)Rohini Haridas
 
Substation Training presentation
Substation Training presentationSubstation Training presentation
Substation Training presentationKamal Mittal
 

Was ist angesagt? (20)

Power grid operation in India
Power grid operation in IndiaPower grid operation in India
Power grid operation in India
 
Relay coordination
Relay coordinationRelay coordination
Relay coordination
 
Substation protection devices
Substation protection devicesSubstation protection devices
Substation protection devices
 
Protection and Switchgear
Protection and SwitchgearProtection and Switchgear
Protection and Switchgear
 
Switchgear presentation
Switchgear presentationSwitchgear presentation
Switchgear presentation
 
Transformers protection, an introduction
Transformers protection, an introductionTransformers protection, an introduction
Transformers protection, an introduction
 
Unit 03 Protective relays
Unit  03 Protective relaysUnit  03 Protective relays
Unit 03 Protective relays
 
Islanding
IslandingIslanding
Islanding
 
Power Transformer Protection
Power Transformer ProtectionPower Transformer Protection
Power Transformer Protection
 
Transformer protection
Transformer protectionTransformer protection
Transformer protection
 
Transformer design and protection
Transformer design and protectionTransformer design and protection
Transformer design and protection
 
Alternator protection
Alternator protectionAlternator protection
Alternator protection
 
Load Forecasting Techniques.pdf
Load Forecasting Techniques.pdfLoad Forecasting Techniques.pdf
Load Forecasting Techniques.pdf
 
Relay Setting Calculation For REF615/ REJ601
Relay Setting Calculation For REF615/ REJ601Relay Setting Calculation For REF615/ REJ601
Relay Setting Calculation For REF615/ REJ601
 
220 KV Substation Operation & Maintenance
220 KV Substation Operation & Maintenance220 KV Substation Operation & Maintenance
220 KV Substation Operation & Maintenance
 
Presentation on substations
Presentation on substationsPresentation on substations
Presentation on substations
 
ABB - TRANSFORMERS-PROTECTION-COURSE (2001)
ABB - TRANSFORMERS-PROTECTION-COURSE (2001)ABB - TRANSFORMERS-PROTECTION-COURSE (2001)
ABB - TRANSFORMERS-PROTECTION-COURSE (2001)
 
Protection of transmission lines (distance)
Protection of transmission lines (distance)Protection of transmission lines (distance)
Protection of transmission lines (distance)
 
Basic protection and relaying
Basic protection and relayingBasic protection and relaying
Basic protection and relaying
 
Substation Training presentation
Substation Training presentationSubstation Training presentation
Substation Training presentation
 

Ähnlich wie At&c losses and remedies

IRJET- Loss Reduction in Agricultural Feeders through HVDS Concept
IRJET- Loss Reduction in Agricultural Feeders through HVDS ConceptIRJET- Loss Reduction in Agricultural Feeders through HVDS Concept
IRJET- Loss Reduction in Agricultural Feeders through HVDS ConceptIRJET Journal
 
International Journal of Engineering Research and Development (IJERD)
International Journal of Engineering Research and Development (IJERD)International Journal of Engineering Research and Development (IJERD)
International Journal of Engineering Research and Development (IJERD)IJERD Editor
 
IRJET- Automatic Load Sharing of Transformer
IRJET- Automatic Load Sharing of TransformerIRJET- Automatic Load Sharing of Transformer
IRJET- Automatic Load Sharing of TransformerIRJET Journal
 
Solid state transformer
Solid state transformerSolid state transformer
Solid state transformervivatechijri
 
Capacitive voltage transformer (1)
Capacitive voltage transformer (1)Capacitive voltage transformer (1)
Capacitive voltage transformer (1)kaushal boghani
 
Energy Efficiency in Electrical Systems.pptx
Energy  Efficiency in Electrical Systems.pptxEnergy  Efficiency in Electrical Systems.pptx
Energy Efficiency in Electrical Systems.pptxPoojaAnupGarg
 
Design consideration of an mmc hvdc system based on 4500 v:4000a emitter turn...
Design consideration of an mmc hvdc system based on 4500 v:4000a emitter turn...Design consideration of an mmc hvdc system based on 4500 v:4000a emitter turn...
Design consideration of an mmc hvdc system based on 4500 v:4000a emitter turn...Ghazal Falahi
 
Pocket book on energy efficiency in elec systems
Pocket book on energy efficiency in elec systemsPocket book on energy efficiency in elec systems
Pocket book on energy efficiency in elec systemsSuresh Kumar
 
Solid State Fault Current Limiter for Improvement of Smart Grid Performance
Solid State Fault Current Limiter for Improvement of Smart Grid PerformanceSolid State Fault Current Limiter for Improvement of Smart Grid Performance
Solid State Fault Current Limiter for Improvement of Smart Grid PerformanceIRJET Journal
 
IRJET- Comparison of H5 and HERIC Trasformerless Inverter Topology Conserning...
IRJET- Comparison of H5 and HERIC Trasformerless Inverter Topology Conserning...IRJET- Comparison of H5 and HERIC Trasformerless Inverter Topology Conserning...
IRJET- Comparison of H5 and HERIC Trasformerless Inverter Topology Conserning...IRJET Journal
 
Lab manual psd v sem experiment no 3
Lab manual psd v sem experiment no 3Lab manual psd v sem experiment no 3
Lab manual psd v sem experiment no 3Sachin Airan
 
A DAPTIVE S UPPLY V OLTAGE M ANAGEMENT F OR L OW P OWER L OGIC C IRCU...
A DAPTIVE  S UPPLY  V OLTAGE  M ANAGEMENT  F OR  L OW  P OWER  L OGIC  C IRCU...A DAPTIVE  S UPPLY  V OLTAGE  M ANAGEMENT  F OR  L OW  P OWER  L OGIC  C IRCU...
A DAPTIVE S UPPLY V OLTAGE M ANAGEMENT F OR L OW P OWER L OGIC C IRCU...VLSICS Design
 
IRJET- Optimization of Loss Reduction using FACTS Device (SVC & STATCOM) ...
IRJET-  	  Optimization of Loss Reduction using FACTS Device (SVC & STATCOM) ...IRJET-  	  Optimization of Loss Reduction using FACTS Device (SVC & STATCOM) ...
IRJET- Optimization of Loss Reduction using FACTS Device (SVC & STATCOM) ...IRJET Journal
 
IRJET- A Novel High Speed Power Efficient Double Tail Comparator in 180nm...
IRJET-  	  A Novel High Speed Power Efficient Double Tail Comparator in 180nm...IRJET-  	  A Novel High Speed Power Efficient Double Tail Comparator in 180nm...
IRJET- A Novel High Speed Power Efficient Double Tail Comparator in 180nm...IRJET Journal
 
CPRI-Power quality report
CPRI-Power quality reportCPRI-Power quality report
CPRI-Power quality reportNageswar Rao
 
Presentation on Industrial Training( DISTRIBUTION LOSSES )
Presentation on Industrial Training( DISTRIBUTION LOSSES )Presentation on Industrial Training( DISTRIBUTION LOSSES )
Presentation on Industrial Training( DISTRIBUTION LOSSES )Arpit Kurel
 
Thermal power plant working
Thermal power plant workingThermal power plant working
Thermal power plant workingSandeep Jamdar
 

Ähnlich wie At&c losses and remedies (20)

IRJET- Loss Reduction in Agricultural Feeders through HVDS Concept
IRJET- Loss Reduction in Agricultural Feeders through HVDS ConceptIRJET- Loss Reduction in Agricultural Feeders through HVDS Concept
IRJET- Loss Reduction in Agricultural Feeders through HVDS Concept
 
losses in transmission line.pdf
losses in transmission line.pdflosses in transmission line.pdf
losses in transmission line.pdf
 
International Journal of Engineering Research and Development (IJERD)
International Journal of Engineering Research and Development (IJERD)International Journal of Engineering Research and Development (IJERD)
International Journal of Engineering Research and Development (IJERD)
 
IRJET- Automatic Load Sharing of Transformer
IRJET- Automatic Load Sharing of TransformerIRJET- Automatic Load Sharing of Transformer
IRJET- Automatic Load Sharing of Transformer
 
Energy Audit..pptx
Energy Audit..pptxEnergy Audit..pptx
Energy Audit..pptx
 
Power
PowerPower
Power
 
Solid state transformer
Solid state transformerSolid state transformer
Solid state transformer
 
Capacitive voltage transformer (1)
Capacitive voltage transformer (1)Capacitive voltage transformer (1)
Capacitive voltage transformer (1)
 
Energy Efficiency in Electrical Systems.pptx
Energy  Efficiency in Electrical Systems.pptxEnergy  Efficiency in Electrical Systems.pptx
Energy Efficiency in Electrical Systems.pptx
 
Design consideration of an mmc hvdc system based on 4500 v:4000a emitter turn...
Design consideration of an mmc hvdc system based on 4500 v:4000a emitter turn...Design consideration of an mmc hvdc system based on 4500 v:4000a emitter turn...
Design consideration of an mmc hvdc system based on 4500 v:4000a emitter turn...
 
Pocket book on energy efficiency in elec systems
Pocket book on energy efficiency in elec systemsPocket book on energy efficiency in elec systems
Pocket book on energy efficiency in elec systems
 
Solid State Fault Current Limiter for Improvement of Smart Grid Performance
Solid State Fault Current Limiter for Improvement of Smart Grid PerformanceSolid State Fault Current Limiter for Improvement of Smart Grid Performance
Solid State Fault Current Limiter for Improvement of Smart Grid Performance
 
IRJET- Comparison of H5 and HERIC Trasformerless Inverter Topology Conserning...
IRJET- Comparison of H5 and HERIC Trasformerless Inverter Topology Conserning...IRJET- Comparison of H5 and HERIC Trasformerless Inverter Topology Conserning...
IRJET- Comparison of H5 and HERIC Trasformerless Inverter Topology Conserning...
 
Lab manual psd v sem experiment no 3
Lab manual psd v sem experiment no 3Lab manual psd v sem experiment no 3
Lab manual psd v sem experiment no 3
 
A DAPTIVE S UPPLY V OLTAGE M ANAGEMENT F OR L OW P OWER L OGIC C IRCU...
A DAPTIVE  S UPPLY  V OLTAGE  M ANAGEMENT  F OR  L OW  P OWER  L OGIC  C IRCU...A DAPTIVE  S UPPLY  V OLTAGE  M ANAGEMENT  F OR  L OW  P OWER  L OGIC  C IRCU...
A DAPTIVE S UPPLY V OLTAGE M ANAGEMENT F OR L OW P OWER L OGIC C IRCU...
 
IRJET- Optimization of Loss Reduction using FACTS Device (SVC & STATCOM) ...
IRJET-  	  Optimization of Loss Reduction using FACTS Device (SVC & STATCOM) ...IRJET-  	  Optimization of Loss Reduction using FACTS Device (SVC & STATCOM) ...
IRJET- Optimization of Loss Reduction using FACTS Device (SVC & STATCOM) ...
 
IRJET- A Novel High Speed Power Efficient Double Tail Comparator in 180nm...
IRJET-  	  A Novel High Speed Power Efficient Double Tail Comparator in 180nm...IRJET-  	  A Novel High Speed Power Efficient Double Tail Comparator in 180nm...
IRJET- A Novel High Speed Power Efficient Double Tail Comparator in 180nm...
 
CPRI-Power quality report
CPRI-Power quality reportCPRI-Power quality report
CPRI-Power quality report
 
Presentation on Industrial Training( DISTRIBUTION LOSSES )
Presentation on Industrial Training( DISTRIBUTION LOSSES )Presentation on Industrial Training( DISTRIBUTION LOSSES )
Presentation on Industrial Training( DISTRIBUTION LOSSES )
 
Thermal power plant working
Thermal power plant workingThermal power plant working
Thermal power plant working
 

Mehr von Sushant Kumar Sinha

Mehr von Sushant Kumar Sinha (15)

Tariff structure & Cerc tariff regulation
Tariff structure & Cerc tariff regulationTariff structure & Cerc tariff regulation
Tariff structure & Cerc tariff regulation
 
Ash handling and utilization
Ash handling and utilizationAsh handling and utilization
Ash handling and utilization
 
Models for energy efficiency project financing
Models for energy efficiency project financingModels for energy efficiency project financing
Models for energy efficiency project financing
 
Case tools
Case toolsCase tools
Case tools
 
Working capital & cost management
Working capital & cost managementWorking capital & cost management
Working capital & cost management
 
Changing the role of top management
Changing the role of top managementChanging the role of top management
Changing the role of top management
 
Clearance required for setting up thermal power plant
Clearance required for setting up thermal power plantClearance required for setting up thermal power plant
Clearance required for setting up thermal power plant
 
Strategy under uncertainty
Strategy under uncertaintyStrategy under uncertainty
Strategy under uncertainty
 
Managing production across supply chain
Managing production across supply chainManaging production across supply chain
Managing production across supply chain
 
Restructuring and Privatization
Restructuring and PrivatizationRestructuring and Privatization
Restructuring and Privatization
 
Power Market regulation
Power Market regulationPower Market regulation
Power Market regulation
 
SCADA
SCADASCADA
SCADA
 
Reliablity and Validity
Reliablity and ValidityReliablity and Validity
Reliablity and Validity
 
AMR & EMS- Automated Meter Reading and Energy Management System
AMR & EMS- Automated Meter Reading and Energy Management SystemAMR & EMS- Automated Meter Reading and Energy Management System
AMR & EMS- Automated Meter Reading and Energy Management System
 
Royal Enfield Marketing
Royal Enfield MarketingRoyal Enfield Marketing
Royal Enfield Marketing
 

Kürzlich hochgeladen

Web & Social Media Analytics Previous Year Question Paper.pdf
Web & Social Media Analytics Previous Year Question Paper.pdfWeb & Social Media Analytics Previous Year Question Paper.pdf
Web & Social Media Analytics Previous Year Question Paper.pdfJayanti Pande
 
PROCESS RECORDING FORMAT.docx
PROCESS      RECORDING        FORMAT.docxPROCESS      RECORDING        FORMAT.docx
PROCESS RECORDING FORMAT.docxPoojaSen20
 
ICT role in 21st century education and it's challenges.
ICT role in 21st century education and it's challenges.ICT role in 21st century education and it's challenges.
ICT role in 21st century education and it's challenges.MaryamAhmad92
 
Key note speaker Neum_Admir Softic_ENG.pdf
Key note speaker Neum_Admir Softic_ENG.pdfKey note speaker Neum_Admir Softic_ENG.pdf
Key note speaker Neum_Admir Softic_ENG.pdfAdmir Softic
 
The basics of sentences session 2pptx copy.pptx
The basics of sentences session 2pptx copy.pptxThe basics of sentences session 2pptx copy.pptx
The basics of sentences session 2pptx copy.pptxheathfieldcps1
 
Explore beautiful and ugly buildings. Mathematics helps us create beautiful d...
Explore beautiful and ugly buildings. Mathematics helps us create beautiful d...Explore beautiful and ugly buildings. Mathematics helps us create beautiful d...
Explore beautiful and ugly buildings. Mathematics helps us create beautiful d...christianmathematics
 
This PowerPoint helps students to consider the concept of infinity.
This PowerPoint helps students to consider the concept of infinity.This PowerPoint helps students to consider the concept of infinity.
This PowerPoint helps students to consider the concept of infinity.christianmathematics
 
Holdier Curriculum Vitae (April 2024).pdf
Holdier Curriculum Vitae (April 2024).pdfHoldier Curriculum Vitae (April 2024).pdf
Holdier Curriculum Vitae (April 2024).pdfagholdier
 
Ecological Succession. ( ECOSYSTEM, B. Pharmacy, 1st Year, Sem-II, Environmen...
Ecological Succession. ( ECOSYSTEM, B. Pharmacy, 1st Year, Sem-II, Environmen...Ecological Succession. ( ECOSYSTEM, B. Pharmacy, 1st Year, Sem-II, Environmen...
Ecological Succession. ( ECOSYSTEM, B. Pharmacy, 1st Year, Sem-II, Environmen...Shubhangi Sonawane
 
Nutritional Needs Presentation - HLTH 104
Nutritional Needs Presentation - HLTH 104Nutritional Needs Presentation - HLTH 104
Nutritional Needs Presentation - HLTH 104misteraugie
 
Russian Escort Service in Delhi 11k Hotel Foreigner Russian Call Girls in Delhi
Russian Escort Service in Delhi 11k Hotel Foreigner Russian Call Girls in DelhiRussian Escort Service in Delhi 11k Hotel Foreigner Russian Call Girls in Delhi
Russian Escort Service in Delhi 11k Hotel Foreigner Russian Call Girls in Delhikauryashika82
 
Seal of Good Local Governance (SGLG) 2024Final.pptx
Seal of Good Local Governance (SGLG) 2024Final.pptxSeal of Good Local Governance (SGLG) 2024Final.pptx
Seal of Good Local Governance (SGLG) 2024Final.pptxnegromaestrong
 
On National Teacher Day, meet the 2024-25 Kenan Fellows
On National Teacher Day, meet the 2024-25 Kenan FellowsOn National Teacher Day, meet the 2024-25 Kenan Fellows
On National Teacher Day, meet the 2024-25 Kenan FellowsMebane Rash
 
Food Chain and Food Web (Ecosystem) EVS, B. Pharmacy 1st Year, Sem-II
Food Chain and Food Web (Ecosystem) EVS, B. Pharmacy 1st Year, Sem-IIFood Chain and Food Web (Ecosystem) EVS, B. Pharmacy 1st Year, Sem-II
Food Chain and Food Web (Ecosystem) EVS, B. Pharmacy 1st Year, Sem-IIShubhangi Sonawane
 
Unit-V; Pricing (Pharma Marketing Management).pptx
Unit-V; Pricing (Pharma Marketing Management).pptxUnit-V; Pricing (Pharma Marketing Management).pptx
Unit-V; Pricing (Pharma Marketing Management).pptxVishalSingh1417
 
Activity 01 - Artificial Culture (1).pdf
Activity 01 - Artificial Culture (1).pdfActivity 01 - Artificial Culture (1).pdf
Activity 01 - Artificial Culture (1).pdfciinovamais
 
Unit-IV- Pharma. Marketing Channels.pptx
Unit-IV- Pharma. Marketing Channels.pptxUnit-IV- Pharma. Marketing Channels.pptx
Unit-IV- Pharma. Marketing Channels.pptxVishalSingh1417
 
TỔNG ÔN TẬP THI VÀO LỚP 10 MÔN TIẾNG ANH NĂM HỌC 2023 - 2024 CÓ ĐÁP ÁN (NGỮ Â...
TỔNG ÔN TẬP THI VÀO LỚP 10 MÔN TIẾNG ANH NĂM HỌC 2023 - 2024 CÓ ĐÁP ÁN (NGỮ Â...TỔNG ÔN TẬP THI VÀO LỚP 10 MÔN TIẾNG ANH NĂM HỌC 2023 - 2024 CÓ ĐÁP ÁN (NGỮ Â...
TỔNG ÔN TẬP THI VÀO LỚP 10 MÔN TIẾNG ANH NĂM HỌC 2023 - 2024 CÓ ĐÁP ÁN (NGỮ Â...Nguyen Thanh Tu Collection
 
Sociology 101 Demonstration of Learning Exhibit
Sociology 101 Demonstration of Learning ExhibitSociology 101 Demonstration of Learning Exhibit
Sociology 101 Demonstration of Learning Exhibitjbellavia9
 

Kürzlich hochgeladen (20)

Web & Social Media Analytics Previous Year Question Paper.pdf
Web & Social Media Analytics Previous Year Question Paper.pdfWeb & Social Media Analytics Previous Year Question Paper.pdf
Web & Social Media Analytics Previous Year Question Paper.pdf
 
PROCESS RECORDING FORMAT.docx
PROCESS      RECORDING        FORMAT.docxPROCESS      RECORDING        FORMAT.docx
PROCESS RECORDING FORMAT.docx
 
ICT role in 21st century education and it's challenges.
ICT role in 21st century education and it's challenges.ICT role in 21st century education and it's challenges.
ICT role in 21st century education and it's challenges.
 
Key note speaker Neum_Admir Softic_ENG.pdf
Key note speaker Neum_Admir Softic_ENG.pdfKey note speaker Neum_Admir Softic_ENG.pdf
Key note speaker Neum_Admir Softic_ENG.pdf
 
The basics of sentences session 2pptx copy.pptx
The basics of sentences session 2pptx copy.pptxThe basics of sentences session 2pptx copy.pptx
The basics of sentences session 2pptx copy.pptx
 
Mehran University Newsletter Vol-X, Issue-I, 2024
Mehran University Newsletter Vol-X, Issue-I, 2024Mehran University Newsletter Vol-X, Issue-I, 2024
Mehran University Newsletter Vol-X, Issue-I, 2024
 
Explore beautiful and ugly buildings. Mathematics helps us create beautiful d...
Explore beautiful and ugly buildings. Mathematics helps us create beautiful d...Explore beautiful and ugly buildings. Mathematics helps us create beautiful d...
Explore beautiful and ugly buildings. Mathematics helps us create beautiful d...
 
This PowerPoint helps students to consider the concept of infinity.
This PowerPoint helps students to consider the concept of infinity.This PowerPoint helps students to consider the concept of infinity.
This PowerPoint helps students to consider the concept of infinity.
 
Holdier Curriculum Vitae (April 2024).pdf
Holdier Curriculum Vitae (April 2024).pdfHoldier Curriculum Vitae (April 2024).pdf
Holdier Curriculum Vitae (April 2024).pdf
 
Ecological Succession. ( ECOSYSTEM, B. Pharmacy, 1st Year, Sem-II, Environmen...
Ecological Succession. ( ECOSYSTEM, B. Pharmacy, 1st Year, Sem-II, Environmen...Ecological Succession. ( ECOSYSTEM, B. Pharmacy, 1st Year, Sem-II, Environmen...
Ecological Succession. ( ECOSYSTEM, B. Pharmacy, 1st Year, Sem-II, Environmen...
 
Nutritional Needs Presentation - HLTH 104
Nutritional Needs Presentation - HLTH 104Nutritional Needs Presentation - HLTH 104
Nutritional Needs Presentation - HLTH 104
 
Russian Escort Service in Delhi 11k Hotel Foreigner Russian Call Girls in Delhi
Russian Escort Service in Delhi 11k Hotel Foreigner Russian Call Girls in DelhiRussian Escort Service in Delhi 11k Hotel Foreigner Russian Call Girls in Delhi
Russian Escort Service in Delhi 11k Hotel Foreigner Russian Call Girls in Delhi
 
Seal of Good Local Governance (SGLG) 2024Final.pptx
Seal of Good Local Governance (SGLG) 2024Final.pptxSeal of Good Local Governance (SGLG) 2024Final.pptx
Seal of Good Local Governance (SGLG) 2024Final.pptx
 
On National Teacher Day, meet the 2024-25 Kenan Fellows
On National Teacher Day, meet the 2024-25 Kenan FellowsOn National Teacher Day, meet the 2024-25 Kenan Fellows
On National Teacher Day, meet the 2024-25 Kenan Fellows
 
Food Chain and Food Web (Ecosystem) EVS, B. Pharmacy 1st Year, Sem-II
Food Chain and Food Web (Ecosystem) EVS, B. Pharmacy 1st Year, Sem-IIFood Chain and Food Web (Ecosystem) EVS, B. Pharmacy 1st Year, Sem-II
Food Chain and Food Web (Ecosystem) EVS, B. Pharmacy 1st Year, Sem-II
 
Unit-V; Pricing (Pharma Marketing Management).pptx
Unit-V; Pricing (Pharma Marketing Management).pptxUnit-V; Pricing (Pharma Marketing Management).pptx
Unit-V; Pricing (Pharma Marketing Management).pptx
 
Activity 01 - Artificial Culture (1).pdf
Activity 01 - Artificial Culture (1).pdfActivity 01 - Artificial Culture (1).pdf
Activity 01 - Artificial Culture (1).pdf
 
Unit-IV- Pharma. Marketing Channels.pptx
Unit-IV- Pharma. Marketing Channels.pptxUnit-IV- Pharma. Marketing Channels.pptx
Unit-IV- Pharma. Marketing Channels.pptx
 
TỔNG ÔN TẬP THI VÀO LỚP 10 MÔN TIẾNG ANH NĂM HỌC 2023 - 2024 CÓ ĐÁP ÁN (NGỮ Â...
TỔNG ÔN TẬP THI VÀO LỚP 10 MÔN TIẾNG ANH NĂM HỌC 2023 - 2024 CÓ ĐÁP ÁN (NGỮ Â...TỔNG ÔN TẬP THI VÀO LỚP 10 MÔN TIẾNG ANH NĂM HỌC 2023 - 2024 CÓ ĐÁP ÁN (NGỮ Â...
TỔNG ÔN TẬP THI VÀO LỚP 10 MÔN TIẾNG ANH NĂM HỌC 2023 - 2024 CÓ ĐÁP ÁN (NGỮ Â...
 
Sociology 101 Demonstration of Learning Exhibit
Sociology 101 Demonstration of Learning ExhibitSociology 101 Demonstration of Learning Exhibit
Sociology 101 Demonstration of Learning Exhibit
 

At&c losses and remedies

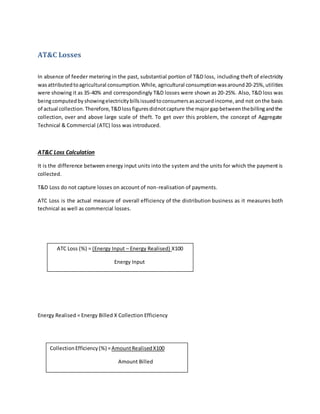
  • 1. AT&C Losses In absence of feeder metering in the past, substantial portion of T&D loss, including theft of electricity wasattributedtoagricultural consumption.While, agricultural consumptionwasaround20-25%,utilities were showing it as 35-40% and correspondingly T&D losses were shown as 20-25%. Also, T&D loss was beingcomputedbyshowingelectricitybillsissuedtoconsumersasaccruedincome,and not onthe basis of actual collection.Therefore,T&Dlossfiguresdidnotcapture the majorgapbetweenthebillingandthe collection, over and above large scale of theft. To get over this problem, the concept of Aggregate Technical & Commercial (ATC) loss was introduced. AT&C Loss Calculation It is the difference between energy input units into the system and the units for which the payment is collected. T&D Loss do not capture losses on account of non-realisation of payments. ATC Loss is the actual measure of overall efficiency of the distribution business as it measures both technical as well as commercial losses. Energy Realised = Energy Billed X Collection Efficiency ATC Loss (%) = (Energy Input – Energy Realised) X100 Energy Input CollectionEfficiency(%) =AmountRealisedX100 Amount Billed
  • 2. Main reasons for Technical Losses  Overloading of existing lines and substation equipments  Absence of up gradation of old lines and equipments  Low HT: LT ratio  Poor repair and maintenance of equipments  Non-installation of capacitors for power factor correction Main reasons for Commercial Losses  Low metering/ billing/ collection efficiency  Theft of electricity by illegal connection  Tampering of metering system  Low accountability of employees and corruption  Absence of Energy Audit and Accounting
  • 3. 5.1 CAUSES OF AT&C LOSSES 5.1.1 INTRODUCTION: Indian power sector currently going through reforms. But still it has problems with generation, transmission & distribution. Indian distribution sector is suffering due to various factors but most importantone isgreaterAT&C losses.AT&Clossesare nearabout33% in India,whichisof greatconcern forwhole of the powersectorbecause itisdecreasingthe returnsandgeneratingdissatisfaction.Inorder to reduce these lossesMOP is introducing various incentive schemes. They are also emphasizing on the restructuring&privatizationof distributionof power.Whenwe talkaboutdistributionthe firstthingthat comes into our mind is AT&C losses. So when we go through the structure of distribution, that is from transmission –distributioninterface tometeringatconsumerend,we are able tofindoutlossesatvarious places. AT&C losses mainly comprises of two kinds of losses: 1) Technical losses. 2) Commercial losses. These can further be divided into sub parts. Distributionhas different stages and at each stage it has different kind of losses. Different stages in the sense that it has losses in distribution lines and transformers at different levels. Basically to calculate AT&C losses, we need to calculate AT&C Losses = Technical + Commercial losses. Now to calculate Technical losses we require considering various factors that are as follows: Technical losses = Line losses in 33/11kv lines + Lines losses in LT lines + Losses in the transformers. 5.1.2 TECHNICAL LOSSES: 5.1.2.1 Line losses in 33,11kv and LT lines (X): It is a loss which incurs in the cables. These losses are there in HT as well as in LT lines and are called as the copper losses. It can be calculated by simple formula, that is X = I2 R There are various factors which come under it: 5.1.2.1.1 Lengthy Distribution lines: In practice, 11 KV and 415 volts lines, in rural areas are hurriedly extended over long distances to feed loads scattered over large areas. Thus the primary and secondary distribution lines in rural areas; by and large radially laid, usually extend over long distances. This results in high line resistance and therefore high 2R losses in the line.
  • 4. 5.1.2.1.2 Inadequate Size of Conductors: As stated above, rural loads are usually scattered and generally fed by radial feeders. The conductor size of these feeders should be adequate. The size of the conductors should be selected on the basis of KVA X KM capacity of standard conductor for a required voltage regulation. Table a & b give the length of lines for 11 KV and 415 volts corresponding to different loads for the voltage regulation prescribed by IE rules; for different sizes of conductors respectively. Table-a:  Length of 11 KV line corresponding to different loads  Size of conductor (with code No.)  KVA-KM for 8% volt drop at 0.8 PF  Maximum of length of (KM)  Load that can be connected (KW)  50 MM2 ACSR Rabb10, 640 30 355  30 MM ACSR Wease7,200 20 360  20 MM2 ACSR Squir5,120 15 341 The figures are for a conductor temperature of 600C. For a conductor temperature of 500C, the above figures shall be about 3% higher and for a temperature of 700C about 3% lower. Table-b:  Length of 415 volts line corresponding to different loads  Size of conductor (with code No.)  KVA-KM for 8% volt drop at 0.8 PF  Maximum of length of (KM)  Load that can be connected (KW)  30 MM2 ACSR Rabb11.76 1.6 7.35  20 MM ACSR Wease4.86 1.0 4.86  13 MM2 ACSR Squir5.58 1.0 5.58  30 MM2 AAC ANT 12.06 1.6 7.54  16 MM2 Gnat 6.96 1.0 6.96 The figures are for a conductor temperature of 60 C. For a conductor temperature of 50o C, the above figures shall be about 3% higher and for a temperature of 70o C about 3% lower.
  • 5. 5.1.2.1.3. DistributionTransformersnot locatedat LoadcenterontheSecondary Distribution System: Often DTs are not located centrally with respect to consumers. Consequently, the farthest consumers obtain an extremity low voltage even though a reasonably good voltage levels maintained at the transformers secondaries. This again leads to higher line losses. Therefore in order to reduce the voltage drop in the line to the farthest consumers, the distribution transformer should be located at the load center to keep voltage drop within permissible limits. But there is a possibility that the load center may have more than one supplier and the area is so congested that it is difficult to put transformers in that areaor there canbe the Government restrictions alsolikeaccording to electricity act 2003 supplier is not allow to use areas, which are under army control and the premises of Government buildings. 5.1.2.1.4. Lower Power Factor: In most LT distribution circuits, it is found that the PF ranges from 0.65 to 0.75. A low PF contributes towards high distribution losses. For a given load, if the PF is low, the current drawn in high. Consequently, the losses proportional to square of the current will be more. Thus, line losses owing to the poor PF can be reduced by improving the PF. 5.1.2.1.5. Bad Workmanship Resulting in Poor Contacts at Joints and Connections: Bad Workmanship contributes significantlytowards increasing distribution losses. Efforts should, therefore, be made to have the best possible workmanship. Various factors of bad workmanship are: i) Large no. of Joints on the line results in larger losses. ii) Lose connections to the transformer bushing-stem, drop out fuse, isolator, and LT switch etc. results in fringing loss. iii). Deteriorated wires and services also causes leaking and loss of power. 5.1.2.1.6. High LT/HT lines:
  • 6. High LT/HT ratio also leads to high losses because an LT line incurs more losses than the HT lines. This happens because HT lines runs at higher voltage with low current which reduces copper losses in HT lines but in LT lines voltage is lower than that of HT lines it means that it has higher current level than the HT lines and in turn higher copper losses. 5.1.2.1.7. Losses in meter coils: Electromechanical meter has two coils, potential coils & current coil. Potential coil losses are constant i.e. does not vary with load. But current coil losses vary with load. These losses are basically I2R losses. Electromechanical meters have more losses because of presence of coil. Due to electronic components in the static meters, the losses are less. That’s why now a day government is implementing electronic meters at every level. 5.1.2.1.8. Street light network: The losses in street lights network are due to ballast Al wires and street light cable network. 11 hours working is assumed for calculations. The ballast losses are taken standard as per the size of the lamp. The loading is considered as per the general practice of connecting streetlights.Using the current carrying capacities of the street light cables and by applying the percentage loadings losses are calculated. 5.1.2.2 Losses in the transformers: These kinds of losses are incurred in the core of the transformer and that is why it is called as core losses. Different levels of distribution system needed transformer of different rating and therefore have different core losses. Manufacturers also use to define these core losses for transformer of different ratings but condition become worse when power factor starts falling. Some of the factors which comes under it is as follows 5.1.2.2.1. Over-rated Distribution Transformers and hence their Under- Utilization: Studies on 11 KV feeders have revealed that often the rating of DTs is much higher than the maximum KVA demand on the feeder. Over rated
  • 7. transformers draw unnecessary high iron losses. In addition to this, iron losses in over rated transformers the capital costs locked up is high. From the above it is clear that the rating of DT should be judiciously selected to keep the losses with the permissible limits. For an existing distribution system the appropriate capacity of distribution transformer may be taken as very nearly equal to the maximum KVA demand at good PF (say 0.85). Such an exercise has been carried out for a number of distribution systems and transformers with capacity of 25, 63, 100, 160, 315 KVA and standardized for different with power factors and diversity factors. But practically seeing it is not likely to have transformer of same rating as required because one need to see the future demand level. Like if we put transformer of equal rating as require than inthat case,in future it become difficult to add new consumers or if we going to add consumer on such kind of transformer than in that case transformer will going to be overloaded and this can leads to low voltage problem or transformer burning. So before installing the transformer we are required to do cost-benefit analysis for each level in order to find out that it is economical to install transformer of higher rating now or later. 5.1.2.2.2. Low Voltage (less than declared voltage) Appearing at Transformers and Consumers Terminals: Whenever the voltage applied to induction motor varied from rated voltage, its performance is affected. Within permissible voltage of + 6% of the affect practice, the supply voltage varies by more than 10% in many distribution systems. A reduced voltage in case of induction motor results in higher currents drawn for the same output. For a voltage drop of 10%, the full load current drawn by the induction motors increase by about 10% to 15% the starting torque decreases by nearly 19% and the line losses in the distributor increases by about 20%. As the bulk load of rural areas and small scale industrial areas consists of induction motors, the line losses in the concerned distribution systems may even touch 20%. 5.1.2.2.3. Losses in Transformers: Transformer generally faces two kinds of losses, i.e. a) No load losses:
  • 8. Such kinds of losses use to remain fixed. These losses remain irrespective of load, basically these are the losses in core of transformer. Only variation in frequency & voltage affects these losses. b) Load losses: These losses vary as the load varies. These losses are directly proportional to the square of current. As load increases in the system voltage starts dropping due to which current start rising due to which losses also starts rising. That’s why overloading always helps in increase in losses. 5.1.2.2.4. Harmonics In non-linear loads, the current is of complex waveform due to dynamic characteristics of the load. The component of the complex waveform can be described as superposition of waveforms, called Harmonics, having frequencies from 0 to infinity. For distribution systems which must handle a large percentage of non-linear loads, the percentage of harmonic currents can be very high. Switch-mode power supplies, PWM converters, voltage source converters, fluorescent lighting with electronic ballasting, computers are the major sources of harmonics current. About 58% of all power used can have harmonic currents overloading transformers, capacitors and other components on the distribution system. The additional current will increase losses in wire, bus bars, transformers and power factor correction capacitors used in the distribution system. The additional heating is caused by each of the harmonic currents of high frequencies. Harmonic current willcause voltage distortion and low power factor. Due to harmonic current the use of line filters before a drive will add more losses to the electrical System and could create line ringing and large voltage transients.
  • 9. 5.1.3 COMMERCIAL LOSSES: Commercial losses are also called as the non technical losses. These losses are difficult to detect. Generally these losses are higher than the technical losses. There is no set formula to detect these losses. India is greatly affected by this loss that is why Governments are emphasizing more on privatization of electricity distribution. These losses mainly incurred on HT as well as LT lines. On HT lines mainly industrial consumers are connected. They use to steal electricity in lakhs and the great example of that is Delhi itself. At LT lines general households and small industries remain connected. They alsouse to stealpower but at lower extent. The biggestplayers in theft are HT line consumers. There are many factors which contribute into it: Commercial losses = Theft (Direct connection + Meter by pass) + Defective meter +Meter Stopped + Meter burnt + Wrong reading + reduce collection efficiency + Meter tempering. Or Commercial losses can also be calculated by Commercial losses = AT&C looses – Technical losses. Commerciallosses = (Energyinput intodistribution system(MUs)-- Sales at consumer end (MUs)) – Technical losses. Now day’s technical losses can also be calculated through various Softwares like SMEC India ltd. using software WI – POWER to calculate technical losses. Initially people were use to calculate technical losses by considering each and every segment of HT and LT lines and transformers. 5.1.3.1 THEFT: In addition to the factors discussed above, causing an increase in line losses there is, unfortunately, a certain amount of theft of electrical energy. Since it is often not possible to find out culprit, the stolen energy cannot be measured and, therefore can not be charged to any one. Stolen energy is, therefore, considered as a part of line losses. Unscrupulous consumers extract energy illegally by-passing the energy meter or by connecting leads directly to the distribution lines. Theft can be of two types:
  • 10.  Direct theft  Indirect theft 5.1.3.1.1 DIRECT THEFT a) Direct connection: Direct connection comes under theft. In it people who do not have connection in there premises they use to connect themselves directly to lines. Such kind of stealing is occurred more on LT lines. b) Meter by passing: In meter by passing, people who already have connection connect themselves to the lines directly. They connect phase of input to output of meter or connect neutral of output to input of meter due to which leakage current flows through neutral unaccounted in meter. Such kind of leakage current are chargeable by utility and its adds up in the unit consumed. 5.1.3.1.2 INDIRECT THEFT: a) Tampering with a meter: Magnetic tampers Mechanical meters can be tampered very easily even without disturbing the wiring by using an external magnet to slow down the rotating disc. Electronic meters too are susceptible to magnetic tampers, but modern designs havehigh magnetic tamper immunity. Moreover electronic meters can now be designed to “run fast” whenever tampered magnetically as a measure of deterrence. Use of suitable arrangements like meter boxes create a shield or increase the air gap (or increase reluctance of flux path) to prevent magnet based tampering. Chemical tampers This kind of tamper involves altering the meter performance by using chemicals. Chemicals are often injected inside the meter to hinder its performance. A neat installation will generally discourage this type of tamper.
  • 11. Direct tampers In case of a single phase meter, a number of ways are being adopted by unscrupulous consumers, by manipulation of external wires to make the meter record less energy. In case of a 3 phase meter, external wiring can also be manipulated to make the meter slow, and wrong phase association will render the energy readings meaningless. Methods of tampering are evolving methods, and with each method to arrest tampering, ingenious methods to tamper once again are constantly being developed by crafty minds. The theft of electricity is a challenge that needs to be eradicated if the electricity distribution industry is to remain sustainable and viable. Other methods of tampering:  Adding more resistance to input and output circuit of electronic meter and reduce current flow in meter.  Adding a wire parallel to I.C. in electronic meters.  Using remote control to on and off the supply in the meter. 5.1.3.2. Un-metered power supply Unmetered supply to agricultural pumps and single point connections to small domestic consumers of weaker sections of the society is one of the major reasons for commercial losses. In most states, the agricultural tariff is based on the unit horsepower (H.P.) of the motors. Such power loads get sanctioned at the low load declarations. Once the connections are released, the consumers get into the habit of increasing their connected loads, without obtaining necessary sanction, for increased loading, from the utility. Further estimation of the energy consumed in unmetered supply has a great bearing on the estimation of T&D losses on account of inherent errors in estimation. Most of the utilities deliberately overestimate the unmetered agricultural consumption to get higher subsidy from the State Govt. and also project reduction in losses. In other words higher the estimates of the unmetered consumption, lesser the T&D loss figure and vice versa. Moreover the correct estimation of unmetered consumption by the agricultural sector greatly depends upon the cropping pattern, ground water level, seasonal variation, hours of operation etc. To increase the food output, almost all the State Governments show benevolence to farmers and arrange supply of electric power for irrigation to the farmers at a nominal rate, and in some States, without charges at all. In view of this, most Electricity Boards supply power to agriculture sector and claim
  • 12. subsidy from the State Govt. based on energy consumption. Since the energy supplied to the agriculture sector is a generous gesture by the State Govt., all the electricity boards have eliminated energy meters for agriculture sector services. The absence of energy meters provides ample opportunities to SEBs to estimate average consumption in agriculture sector at a much higher value than the actual. In the absence of energy meters, most of the SEBs resort to fudging consumption figures to include not only the under estimated T&D Losses but also energy theft from their system. The extent of fudging is more in the States where agricultural activity is high. The benefit derived by these boards is not only the extent of subsidy from the respective States but also self praise, by showing much less T&D losses. Further the boards are ignoring the inefficiency in operating the distribution system by blaming the agricultural supply for all ills and raising the tariff of other consumers. Most of the methods being employed by SEBs for estimating the Unmetered energy consumption are as follows: -  Load factor based estimation.  Estimation based on feeder wise theoretical calculation of losses.  Estimation based on readings of meters installed at all the Distribution Transformers located on a feeder. However, none of these methods provide correct estimation of unmetered consumption. 5.1.3.3 Defective Meter: Slow meter: Such kind of losses generally occurred after 11/0.4kv feeder in the meter. In this, meter runs slower than the prescribed speed. Such kind of meter produces losses to utility because it shows wrong reading. And ultimately these wrong reading effects the returns of the utility from the consumer. 5.1.3.4 Meter Stopped: Stopped meter doesn’t read any unit of electricity due to which it becomes difficult to charge exact figure from the consumer. But utilities are require to charge the consumed power from the consumer, for that they use to find out the averagebill of that particular consumer and chargea particular amount from them in order to reduce their losses to some extent. 5.1.3.5 Meter Burnt: Meter can be burnt a) Unintentionally: In this meter gets burnt due to some technical factors or meter is of old age.
  • 13. b) Intentionally: In it meters are burnt by user themselves. They burnt meter in order to have average bill to save money. This is an ill legal activity. In both the cases consumer receives average bill but utility suffer from losses. But in second case, if caught consumer either has to face penalty or legal proceedings. 5.1.3.6 Wrong Reading: Wrong readings can be taken by reading reader due to a) Error in display: Some times meter watch glass gets blurred or sometimes numbers gets erased from the reading panel due to which it become difficult for the reading reader to note readings correctly. So such kind of errors create problem for the utility because due to this error they use to loose great amount. Each unit of electricity lost due to this error adds to revenue lost. b) Intentionally: Reading reader sometime gets involved in the illegal activities and for the small amount of bribe they record wrong reading. And this activity causes less profit to the power utilities. So in this case utilities require taking some effective measure in terms of technology (like spot billing, GIS system) or supervision. 5.1.3.7 Reduced collection efficiency: Such kind of losses is incurred at the consumer end. In it utility or distribution company charge an amount according to the reading in the meter at consumer premises. But in this case consumer is not willing to pay the bill. Due to which these distribution companies falls into losses. Thesecompanies become unable to pay to the generating companies and other debtors. And due to this reduced collection efficiency their bad debts starts increasing the great example of this is Orrisaand Delhi.In Orrisabad debts had become huge in 1997 due to which Orrisa had reached to the World Bank and World Bank had suggested them to privatize their distribution sector in order to bring reforms and to reduce bad debts. In Delhi also reforms is brought in the forms of corporatization in order to reduce bad debts in the balance sheet. Collection efficiency of any distribution company shows its effectiveness in the sector. 5.1.3.8 Unbilled meters:
  • 14. Some time due to disputes between utility and consumer bill is not issue to the consumer. Due to which utility cant able to recover from those consumers. Those meters remain un-billed. 5.1.3.9 Misuse of tariff: Tariff can be misuse when some body from commercial side commences business without informing to authority. They start doing any profitable task at commercial rate. Then it termed as misuse of tariff. Like suppose a doctor starts his clinic at his residence than in that case he is doing a profitable work at his home at commercial rates without informing to the authorities. Such kind of activity is considered as illegal activity. For every category i.e. commercial, agriculture and industrial the tariff structure is different and every consumer need to pay in their category. 5.1.3.10 Unauthorized extension of load: Some time consumers use electricity more than the allowed capacity. Initially consumers apply for particular capacity but after some time they use to increase their capacity without information to the authorities. Without seeking permission to any authority they increase their load and start using electricity in unauthorised manner. In unauthorized use of electricity households and companies use to consume electricity more than that of allowed capacity. For example suppose a company is using 75 KVA of power but the allowed capacity for it is 50 MVA then the remaining 25 KVA comes under unauthorized. Consumers generally tab the over head lines, meter cabin, street light loop-in box, pillars and secondary of transformer. 5.1.3.11 Defaulter/Delayed payments: Defaulter comes under those consumers who pay their bills lately. Defaulters some times increase the collection efficiency and some time they decrease the efficiency. Increase in efficiency happens due to the payment of defaulters in some other period. 5.1.3.12 Unaccounted meter: Meter which has been installed but utility doesn’t have any account of that meter means they doesn’t have meter key number. In this case meter remains unaccounted and leads to revenue loss.
  • 15. 5.1.3.13 CT ratio errors: CT ratio errors consumer of higher load require bigger capacity meters like suppose that there is a consumer whose load is very high that consumer need current of 1000A. But meter for 1000A current is not possible soin that caseutility install meter of appropriate capacity and use to record reading of that meter. For bill generation a multiply factor is multiply with the reading of meter to find out actual consumption of the consumer. In case of wrong factor the whole bill of the consumer will going to change and will impact on revenue realization for utility. 5.1.3.14 Meter no. mismatch: Meter no. mismatch can be possible when a discom replaces meter of a consumer and doesn’t take it into account. Then in that case discom will going to have old meter reading for the consumer and when a meter reader will going to record the new reading from new meter it will going to result into mismatch in the reading it would be considered as faulty reading. 5.1.3.15. Provisional billing: Some times due to some reasons it become difficult for the discom to have exact reading of the consumer than in that case discom generates average bill to the consumer on the basis of few previous months. The reason for it can be meter burnt, meter steel etc. 5.1.3.16 Bills pending for assessment: This generallyhappens in caseofthe temporary connection. The bills oftemporary consumer have to be kept for assessment. 5.1.3.17 Bill not delivered: Some times utility not able to deliver bill to consumer due to consumer absence from his premises, or some times bill gets misplace by the delivery man or by the post man. These all factors add up non delivery of bill and creates problem in the revenue realization.
  • 16. 5.1.3.18 Disconnected with dues: Some of the temporary disconnected consumer doesn’t pay their dues to the utility due to which they comes into the category of permanent disconnected consumer and the dues of those consumer become a loss for the utility which are called as arrear. 5.1.3.19 Meter (address) not traceable: New meter has been installed but address of that meter is not traceable. In that case bill of that meter is not delivered. 5.3 SUGGESTED SOLUTIONS We have seen various factors of AT&C losses in previous sections. For these factors we can apply some alternate solutions. They are as follows: 5.3.1 SOLUTIONS FOR TECHNICAL LOSSES: 5.3.1.1 Line losses in 33/11kv and LT lines (X): Such kind of losses occurs in conductors which carries power from one substation to other and to consumers. The factors of line losses are already explained in previous chapters. Various states in India are implementing some common and some different kind of measures for various problems, which are as follows: 5.3.1.1.1 Lengthy Distribution lines, inadequate size of conductor, Distribution Transformers not located at Load center on the Secondary Distribution System: Above are some of the losses whichincurred due to some technical factors like resistance, current etc. Change in the length and size of the conductor also changes resistance of the conductor. So the increase in the length and decrease in the sizeof the conductor increases resistanceof the conductor which in turn increases losses. The possible solution for such kind of problem is to a) Reduce conductor length up to suitable length. b) Increase conductor size. c) Install new transformers at the load center if the distance is too large from substation to load center. West Bengal, Punjab, Haryana and many more are installing new transformers in various circle to reduce losses due to dislocation of transformer.
  • 17. d) Bifurcate or Trifurcate feeders in order to reduce the length of the conductor. The single conductor for several region results in increase of length and losses so the division of conductor help in reduction of losses. The good example of this is Haryana which is separating the distribution lines for each region. e) Energy audit: Energy audit can be conducted in order to find out losses due to increased length of conductor and transformer dislocation at various areas. 5.3.1.1.2. Lower power factor: The lower power factor can be improved by application of shunt capacitors. The lower power factor arises due to imbalance between capacitance and inductance. Shunt capacitors can be connected in the following ways: i) Shunt capacitors are connected on the secondary side (11KV side) of the 33/11 KV power transformers. ii) Line losses in LT distribution lines may also be considerably reduced by installing shunt capacitors of optimum rating at vantage points. The optimum rating of capacitor banks for a distribution systemis 2/3rd of the average KVAR requirement of that distribution system. The vantage point is at 2/3rd the length of the main distributor from the transformer. A study made in an urban distribution system fed from a 200 KVA. 11 KV/415 volts transformer with 300 HP CL of more than 200 consumers having small loom loads showed the range of PF of the distribution system varied from 0.65 to 0.70. The reactive power requirement was 135 KVR. The inductive loads occurred on the distribution systembetween 7 AM and 8 PM; on all the working days with almost constant load-cycle. The capacitor bank rating 42.5 KVAR were installed at 2/3rd the distance from the transformer on the main distributor and were switched on and off manually at 7 AM and 8 PM respectively on all working days. The loss reduction was thus fund to be 6-7%. The releasedcapacity in this particular study was 42 HP, which could be supplied to the additional consumers. iii) A more appropriate manner of improving this PF of the distribution system and thereby reduce the line losses is to connect capacitors across the terminals of the consumers having inductive loads. The extent of reduction of line losses in this manner depends mainly on the extent to which the PF of consumers is improved. In this case, the capacitor is connected in parallel to the terminals, the
  • 18. capacitors being switched on and off together with the equipment itself. Many electricity supply authorities are modifying their tariff conditions to make it compulsory for the consumers to provide capacitors for all types of installations with connected loads of 5 HP and above. By connecting the capacitors across individual loads, the line loss is reduced from 4-9% depending upon the extent of PF improvement. Many states are installing new capacitors at 11kv feeder and 0.415kv feeder. The best example of this is WestBengalwho has installed199 lakhs of 28.5 MVAR capacitor at 11kv feeder and Maharashtra who have started low tension load management system (LTLMS) under which Maharashtra is planning to install 27KVAR and 36KVAR in 20 districts, not even this Punjab, Haryana, Andhra Pradesh, all are in a process of implementing capacitor at various levels and more over promoting scheme for installation of capacitor on agriculture pumps. 5.3.1.1.3. Bad Workmanship Resulting in Poor Contacts at Joints and Connections: i) Joints are a source of power loss. Therefore the number of joints should be kept to a minimum. Proper jointing techniques should be used to ensure firm connections. ii) Connections to the transformer bushing-stem, drop out fuse, isolator, and LT switch etc. should be periodically inspected and proper pressure maintained to avoid sparking and heating of contacts. iii). Replacement of deteriorated wires and services should also be made timely to avoid any cause of leaking and loss of power. 5.3.1.1.4. High LT/HT lines: High LT/HT line means the higher losses because LT lines carries large current than the HT lines so due to this I2R losses arehigher in LTlines than HT lines.Andhra Pradesh is planning to reduce their LT/HTratio up to 1.4:1 in 2007 like wise Haryana is trying to reduce ratio from 1.82:1 to 1.80:1 in 2007. West Bengal has 0.98:1 and Kerala has 6.14:1 (excluding EHT) LT/HT ratio. The best possible solution for this is to implement HVDS. HVDS (High voltage distribution system):
  • 19. On LT lines technical losses are higher, but it can be reduce by implementing HT lines up to the consumer end. Madhya Pradesh had launched it in Bhopal, and Assamis also implemented it at pilot basis. Not even this Maharashtra is planning to launch HVDS in its 9 major cities and many states and utilities are in a line to implement it. In HVDS a transformer is installed on the pole with distribution box below it and from this distribution box consumers get supply. 12 consumers can be connected to one distribution box. Up to transformer 11kv line is connected and from distribution box to consumer premises 440/230V line is connected. So as transformer are installednear to consumer itdecreases LT lines and increases HT lines. Increasein no.of substationsneartoloadcenterandconstructionofnew HT lines: Each year every utility and SEB set a target to increase their no. of substation and no. of HT lines in order to reduce their losses and to improve their efficiency. By building substation near to load center because it helps in reduction in I2R losses and more over I2R losses are use to remain low in 132 KV , 33 KV ,11 KV bus bars. 5.3.1.1.5. Losses in meter coils: Electromechanical meter has two coils in it one is potential coil and the other is current coil. Potential coil incur no load loss where as the current coil incur I2R losses. So in order to reduce these losses electronic meters are the best solution. These kinds of losses are negligible as compare to other factors in AT&C losses. 5.3.1.2. Losses in the transformers: 5.3.1.2.1. Over-rated Distribution Transformers and hence their Under- Utilization: For the reduction of loss due to over rated transformer one can implement: a) Load forecast:
  • 20. In it one try to find out the future and present demand of the area in which transformer is to be install. Load forecasting for future gives the idea, that how much capacity of transformer is require in that particular area. Load forecasting should be based on the demand of each category. One should have the correct idea of current as well as future demand of domestic, industrial, commercial, agriculture. And accordingly one should install transformer of appropriate capacity for each area. But generally utilities fail to do a correct load forecasting and due to which losses incurs. b) Energy audit: Energy audit helps to find out the various places where losses incur. With the help of energy audit we can find out overrated transformer and transformer of appropriate capacity required. 5.3.1.2.2. Low Voltage (less than declared voltage) Appearing at Transformers and Consumers Terminals: As voltage level decreases it results in the increase of losses. Reduction in the voltagelevel is permitted up to +/- 6%. The above situation is corrected by operating an “on-load-tap changing” in the power transformers situated at high voltage sub-stations 66/11 KV sub-stations and providing on the 11 KV feeders a combination of switched capacitors and automatic voltage regulators. Further, the “off load tap changing” in distribution transformers is adjusted prior to the commencement of agricultural load season, which is readjusted before the one-set of monsoons when the rural load is small the off-load tap changing gear is available. 5.3.1.2.3. Load Loss and no-load loss in Transformers: This can be improved by making improvement in transformer design and by installing amorphous core transformer of appropriate capacity. 5.3.1.2.4. Harmonics: Harmonics generally effect power factor of the system, produce high neutral current and distorts the desired wave form. For the reduction of harmonics in the distribution system utilities either install
  • 21. a) FILTERS: Shunt Filters normally used for shifting natural/resonant frequency of electrical system under harmonic influence and also helps to improve power factor at fundamental frequency. b) LOAD BALANCING: In order to reduce harmonics in the system another solution is to balance load between the different phases. Due to load balancing harmonics get reduces.
  • 22. 5.3.2 SOLUTIONS FOR COMMERCIAL LOSSES: 5.3.2.1. THEFT: In INDIA theft consumes most of the revenue of the SEBs and utilities.People have different means to steel the power. And most of the states in India are suffering from this problem. When we go in depth of this we find that the bigger offenders are the industrial consumers because they are the bulk consumers on the HT side. Whereas the consumer on the LT side also steel power but theft made by them are comparatively very low than HT consumer, but have significant value. One can follow two kind of approach: 1) Scientific approach 2) Management approach SCIENTIFIC APPROACH: a) 100% Metering: In order to reduce losses due to theft one should need to confirm accountability of the no. of unit consumed by the consumers as well as the no. of units deliver to the feeder. For that purpose it is necessary to have meter at each level of distribution network i.e. at transformers and consumers, so that one can easily detect theft by comparing the figures. Many of the states like Punjab, Haryana, Maharashtra, Andhra Pradesh etc. are installing meters at each level of distribution in order to not only have accountability of units which is to be charged from the consumer as well as to count the amount of units which comes under subsidy. Meter helps to find out the losses and in turn help to detect theft. b) FIXING OF RESPONSIBILITIES: In order to ensure greater accountability, it is better to make a person in charge of the respective feeder and made accountable for the preparation of feeder-wise energy accounting / audit. And this will make the person accountable to find out theft and the losses due to other reasons. c) HVDS (High voltage distribution system): Highvoltage distribution systemhelps to reduce theft becausein it HTlines lay up to the consumer end poles. So this makes difficult for the people to steel electricity due to high voltage in the cable.
  • 23. Consumer equipment works at the lower voltage than the voltage in line, so it is of no use to steel electricity on such high voltage. Steeling of electricity from such system is harmful for the consumer equipment. d) Low voltage distribution system (LT ABC) In LT ABC is a aerialbunch cableis installedat up to poles at consumer end. These cables carry voltage of 440V. This cable ends up in the distribution box, from this distribution box 8 consumer can be connected. Thesecables save any kind of direct connection by the people. e) Under ground cables: Under ground cables like XLPE cable can be used for theft reduction. Such cables are drawn under ground to consumer end. f) GIS System: GIS system gives the status of the consumer that at which DT consumer is connected and what kind of consumer he is whether he is industrial consumer, agriculture consumer, commercial consumer or domestic consumer. It also helps in doing energy accounting. This in turn helps to calculate the losses due to theft, so with the assistance of this systemone can easily detect the theft in particular area. g) Franchise The Distribution: Theft can also be reduced by outsourcing distribution of electricity. Franchise can be allotted an area for electricity distribution. Maharashtra had implemented distribution franchise in Bhiwandi in order to reduce theft. Distribution franchise takes care of all the system and by reducing losses it earns its share. Utility can implement franchise model at various levels like for billing, metering, collection and for operation and maintenance. h. Automated meter reading (AMR): Automated meter reading consists of meter with GSM/PSTN modem which is than connected to data base by GSM/PSTN network respectively. In such kind of system utilities can gather data and information of the consumer without visiting the consumer premises. With the help of it one can able to detect theft like meter tampering and meter by passing. i. Pre-Paid meters: In Pre-Paid meter consumer require to purchase a card from utility office. This card has a number which is require to fill in the meter with the help of
  • 24. key pad already there on the meter. It enables consumers to track and monitor their consumption. And in turn helps to reduce theft. MANAGEMENT APPROACH: a) ENFORCEMENT DEPARTMENT: Every utility have this department for theft reduction. This department use to conduct field survey and try to catch up the consumers who make theft by checking their premises. They issue notice to the offender and remove meter from offender premises. This department use to categories the offender above 10kw and below 10kw. And according to the sections in electricity act 2003 they use to punish offenders. b) OTHER INITIATIVES: Different utilities implements different schemes in order to reduce losses like voluntary disclosure scheme (VDS) and late payment surcharge scheme (LPSE) implemented by BSES and JJ cluster scheme. In VDS consumer need not to pay any penalty but required to pay new meter deposit fee. In LPSE consumers need to pay surcharges. And in JJ cluster scheme NDPL persuade consumer to have electricity from meter. If in a region 90% of people doesn’t have meter in their premises than in that case NDPL will not going to provide any service and facility to that region. In this way NDPL concentrate on the particular cluster. Now day’s discoms also give reward to those people who inform the discom about the theft. 5.3.2.2 UN-METERED POWER SUPPLY: 100% METERING OF CONSUMERS: The only solution for un-metered power supply is 100% metering. Due to 100% metering of consumer utility can have an account of subsidized units of electricity in comparison to the actual consumption of subsidized consumer. DT METERING:
  • 25. With the help of DT metering one can able to find out transformer wise consumption and due to it can able to measure unit consumed in subsidized area. 5.3.2.3 DEFECTIVE METER, METER STOPPED AND METER BURNT: Solutions for such kind of factors are: a) ENFORCEMENT DEPARTMENT: Enforcement department use to detect such kind of factor by periodic checking of consumer premises. And on the basis of this periodic checking utilities try to find out the consumers who have such kind of meters. Enforcement department people use to issue notice to such consumer. Some time they put penalty on the consumer who do not places any complaint. NDPL people follow same procedure and guidelines of electricity act 2003. And it is mandatory for all utility to exercise the proceeding against offender according to electricity act 2003. b) REPAIR AND REPLACEMENT: Other solution for this is either replaced stopped and burnt meter or repair the defective and stopped meter. NDPL and BSES are use to exercise this thing. c) FRANCHISE: Utility can franchise the metering, billing and collection so in that franchise take care of the all the meter related activity. d) AUTOMATED METER READING: AMR can be implemented to detect the stopped, defective and burnt meter. In it all the information of the consumer meter can be downloaded in the data base. So with the help of it utility can have information of stopped, defective and burnt meter. e) RELIABLE METERS: Now a day utility are installing electronic meters which are more reliable than the previous meters. Electronic meters can store various information about the meters and units consumed by the consumers. This information helps to find out the meter status. This data can be analyses to find out the reason for defective, stopped and burnt meter. f) METER TESTING DEPARTMENT:
  • 26. Utility generally has their testing department, which use to test the faulty meters. Such department needs to be strengthening in order to reduce the chance of defective, stopped and burnt meter by technical and non technical fault. 5.3.2.4. WRONG READING, REDUCED COLLECTION EFFICIENCY AND UNBILLED METERS: These factors directly effects the revenue generation of the distribution company. The possible solutions for such kind of problems are a) ELECTRONIC METERS WITH DIGITAL DISPLAY: When we talk about electromechanical meters thesemeter have arotating disk and a mechanical reader. As these meters gets old their functioning get poorer and poorer and also numbers on the display get blurred due to which it become difficult to record correct reading. For this purpose electronic meter can be installed. These electronic meters have digital display which doesn’t have tendency to get blurred and therefore remove chances of recording wrong reading. b) SPOT BILLING: Spot billing can be use to reduce the chances of wrong reading, improve collection efficiency and reduce unbilled meters. In spot billing a person use to keep a hand handling device and with the help of this device he generates bill in the consumer premises. So with the help of spot billing one can improve revenue collection. c) PRE-PAID METERS: Pre paid meters are those meters in which doesn’t require reading of meters, it also helps in improving the collection efficiency because meter works only when a consumer fill it with the recharge card and it eliminates the chances of unbilled meter as consumer need to take care of recharging of meter. d) AMR: With the help of AMR the chances of wrong reading will going to become nil and more over every meter will going to have an account in the data base of discom which will going to help discom for generation of bill. e) SOFTWARE UPGRADATION: Many states like Punjab, Haryana, West Bengal, Kerala and Maharashtra are trying to upgrade their billing software in phases so that every meter get the correct bill without any discrepancy.
  • 27. f) ON-LINE BILL COLLECTION: Many states and utilities are implementing on line collection of bills.In this a customer can use internet to pay his bill. 5.3.2.5. MISUSE OF TARIFF AND UNAUTHORIZED EXTENSION OF LOAD: a) ENFORCEMENT CELL: Enforcement cell use to implement different method to detect and to reduce these factors. 1) Reward System: In reward system discom generally provide reward to those people who use to provide information of misuse of tariff. Discoms also use to conduct consumer awareness program to motivate the people to complaint against the defaulter. 2) By Meter Reader Information: Meter reader also use to inform the enforcement department and helps out to find out the defaulters. 3) Periodic Checking: Periodic checking of consumer premises helps in finding out the misuse of tariff. b) DATA ANALYSIS OF ELECTRONIC METER (MDI) Electronic meters use to carry many information of consumer consumption out of these information one can get the maximum demand information of the consumer by the MDI value. c) DATA ANALYSIS: Data analysis helps to find out the consumption pattern of the consumer. So with help of it one can easily find out the increase in load demand of the consumer. 5.3.2.6. DEFAULTER/ DELAYED PAYMENTS AND UNACCOUNTED PAYMENTS: a) Spot billing can be used to generate bill at consumer premises and therefore helps to reduce the delayed payment and defaulters. b) Prepaid meter can also be implemented for the reduction of unaccounted payments and delayed payments.
  • 28. c) Up gradation of software is required to improve the performance of billing in order to reduce unaccounted payments. d) Online billing can also help to reduce the delay in payment by the consumers. e) Stress assetmanagement is can be one of the solutions for accountability of the defaulters. f) Data analysis can be help to find out the defaulters and ultimately will help in stress asset management. 5.3.2.7. BILLS NOT DELIVERED: SPOT BILLING: Spot billing helps in the reduction of misplace of the bill because in spot billing, device use to generate bill in the consumer premises so it become difficult to misplace. OUTSOURCE BILL DISTRIBUTION AND COLLECTION: Outsourcing of bill delivery is the better option because in the outsourcing all the liability of bills is transferred on to the other person. 5.3.2.8. CT RATIO ERRORS: CT ratio errors can be improved by having a CMRI of proper rating according to the meter. CMRI is a hand handling device with a multiply factor for different categories.