Tcm step 2 market needs analysis
•Als PPTX, PDF herunterladen•
2 gefällt mir•4,152 views

Market Needs Analysis Workshop for Technology Commercialisation

Empfohlen
Weitere ähnliche Inhalte
Was ist angesagt?
Was ist angesagt? (20)
Andere mochten auch
Andere mochten auch (20)
Ähnlich wie Tcm step 2 market needs analysis
Ähnlich wie Tcm step 2 market needs analysis (20)
Mehr von Stephen Ong
Mehr von Stephen Ong (20)
Kürzlich hochgeladen
Kürzlich hochgeladen (20)
Tcm step 2 market needs analysis
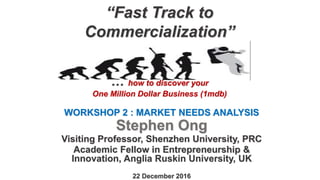
- 1. “Fast Track to Commercialization” … how to discover your One Million Dollar Business (1mdb) WORKSHOP 2 : MARKET NEEDS ANALYSIS Stephen Ong Visiting Professor, Shenzhen University, PRC Academic Fellow in Entrepreneurship & Innovation, Anglia Ruskin University, UK 22 December 2016
- 2. “Does your product meet a clear market demand or solve a problem?” Innovation SPACE™ Technology Commercialization Model Phase 1 : CONCEPT Stage 1 : DISCOVERY Step 2 : MARKET NEEDS ANALYSIS
- 3. 3 Today’s Agenda • 9:00 Introduction • 10:00 Identifying the Customer Segment • 11:00 Perceptual Mappping • 12:00 Marketing Mix • 13:00 Have an AMAZON Lunch • 14:00 Competitor Analysis • 15:00 Market Trend Analysis : PESTEL & Force Field Analysis • 17:00 Conclusion
- 4. The Technology Commercialisation Model SCIENCE & TECHNOLOGY MARKET ENTERPRISE / BUSINESS CONCEPT PHASE STAGE 1 : DISCOVERY Step 1 Technology Analysis Step 2 Market Needs Analysis Step 3 Venture Assessment CREATION PHASE STAGE 2 : DO-ABILITY Step 4 Technical Feasibility Step 5 Market Study Step 6 Economic Feasibility STAGE 3 : DESIGN Step 7 Engineering Prototype / Pilot Plant Step 8 Strategic Marketing Plan Step 9 Strategic Business Plan STAGE 4 : DEPLOYMENT Step 10 Pre-production Prototype Step 11 Market Validation Step 12 Business Start-Up COMMERCIAL PHASE STAGE 5 : DELIVERY Step 13 Production Step 14 Sales & Distribution Step 15 Business Growth STAGE 6 : DOMINATION Step 16 Production Support Step 17 Market Diversification Step 18 Business Maturity
- 5. Step 2: Market Needs Analysis Does this product meet a clear market demand or solve a problem? • Assuming all things are still positive, the next step is to investigate a marketing concept for the product. This step is called the Market Needs Analysis. The questions are straightforward and simple: who will buy the product, how many will they buy, and how much will they pay? Discovering this information is not as simple as asking the questions. At this level of analysis, the information comes primarily from secondary sources such as trade journals, periodicals, existing market studies and electronic data. The permissible margin for error at this level is large. This activity is designed more to qualify the market opportunity than quantify it at this point in the process. The purpose here is to develop a level of confidence about the marketability of the product. • Definition: The process of determining whether the concept demonstrates superior ability over current solutions to meet a market need. • Objective: The objective of a market needs assessment is to identify a potential market for the concept, estimate the market size and determine a preliminary value of the product. • Product: The product of this step is a short summary of information from trade journals, data bases, and interviews which follows the marketing section of a standard business plan format. • Marketing Activities: The marketing activities common to this step are those necessary to demonstrate that the product is unique and sustainable in a competitive marketplace. • During the conceptual phase the following activities must be completed: • • Identify three unique features or benefits of the product; • Identify the competition; • Establish customer requirements for the product; • Identify potential market barriers; • Identify market distribution channels; • Identify product pricing criteria • Milestones: Background research materials • Funding Sources: Personal finances, Family and friends • Marketing Information: Completion of the conceptual marketing step will usually result in a rationale of why the product will receive a positive market response, gross estimates of the market and its segmentation, a simple explanation of how the product will be marketed, and an estimated price for the product. • Key Questions : • Have you assessed the needs of the market? Do you know the product uniqueness? Do you know the product competition? Do you know the customer requirements? Have you identified the barriers to market entry? Have you identified distribution channels? Do you know the pricing criteria?
- 6. KEY QUESTIONS 1. Have you assessed the needs of the market? 2. Do you know the product uniqueness? 3. Do you know the product competition? 4. Do you know the customer requirements? 5. Have you identified distribution channels? 6. Do you know the pricing criteria? 7. Have you identified the barriers to market entry?
- 7. WHAT IS A MARKET SEGMENT? WHO IS THE CUSTOMER? Demographic Grouping and Buying Behaviour
- 8. MARKET SEGMENT : GENERATIONAL • GEN ALPHA (2011 - ) • GEN Z (iGen)(1995 – 2010) • MILLENNIALS (GEN whY?) (1979-1994) • GEN X (1964-1978) • BABY BOOMERS (1946- 1964) • SILENT GENERATION / TRADITIONALISTS (1925- 1945)
- 9. Average Ages & Generations
- 12. MARKET SEGMENT : LIFESTYLE 1. DINGO : Double Income Not Going Out (Saver) 2. DINKY : Double Income No Kids Yet 3. DITCHED : Dual Income, Two or more CHildren, Expanding Debts 4. MUPPIE : Middle-aged Urban Professional 5. OINKY : One Income No Kids Yet 6. ORCHID : One Recent Child Heavily In Debt 7. GLAM : Greying Leisurely Affluent Married 8. GOFER : Genial Old Fellow/Female Enjoying Retirement 9. HENRY : High Earner Not Rich Yet 10. KIPPERS : Kid in Parents Pockets Eroding Retirement Savings 11. LOHAS : Lifestyle of Health And Sustainability 12. SINBAD : Single Income No Boyfriend And Desperate 13. SITCOM : Single Income Two Children Oppressive Mortgage 14. YUPPIE : Young, Upwardly mobile Professional
- 13. Case : Car Ownership Perceptual Mapping
- 14. My Reasons to Own a Car Choices •Past Experience •Present Relationship (Emotional Attachment) •Future Dream (Expectations) Determinants (Rank importance 1=Least to 5=Most) •Affordability •Pleasure •Practical •Status Symbol •Latest Technology
- 15. 5 3 4 2 1 4 3 5 2 1 1 4 2 5 3 AFFORDABILITY PLEASURE PRACTICAL STATUS SYMBOL LATEST TECHNOLOGY 0% 10% 20% 30% 40% 50% 60% 70% 80% 90% 100% DETERMINANTS ON CAR CHOICES PAST EXPERIENCE PRESENT RELATIONSHIP FUTURE DREAM
- 16. PRODUCT PROMISES : Car Ownership 1. Building Cars People First 2. It’s in the Drive! 3. The Power of Dreams 4. All about the drive. 5. Innovation that excites 6. Passion for life 7. Driving matters 8. Go further. 9. Drive@earth 10.The best or nothing. 11.The Ultimate Driving Machine 12.New thinking New Possibilities 13.The power to surprise
- 17. CLASSIC-INNOVATION DEPENDABLE - PASSIONATE CAR OWNERSHIP : MALAYSIA PASSION INNOVATIVE CONVENTIONAL DEPENDABLE PERCEPTUAL MAP : INNOVATIVE VS PASSION
- 18. [CELLRANGE] [CELLRANGE] [CELLRANGE] [CELLRANGE] [CELLRANGE] [CELLRANGE] [CELLRANGE] [CELLRANGE] [CELLRANGE] [CELLRANGE] [CELLRANGE][CELLRANGE] CLASSIC-INNOVATION DEPENDABLE - PASSIONATE CAR OWNERSHIP : MALAYSIA 2015 (591,298 new cars) PASSION INNOVATIVE CONVENTIONAL DEPENDABLE PERCEPTUAL MAP : INNOVATIVE VS PASSION
- 19. PRODUCT PROMISES : Car Ownership BRANDS 1. Perodua 2. Proton 3. Honda 4. Toyota 5. Nissan / Renault 6. Mazda 7. Isuzu / Ford 8. Mitsubishi 9. Mercedes 10. BMW 11. Hyundai 12. Kia PROMISES 1. Building Cars People First 2. It’s in the Drive! 3. The Power of Dreams 4. All about the drive. 5. Innovation that excites / Passion for life 6. Driving matters 7. Go further. 8. Drive@earth 9. The best or nothing. 10. The Ultimate Driving Machine 11. New thinking New Possibilities 12. The power to surprise
- 21. Exercise : SmartPhone Ownership Perceptual Mapping & Market Segmentation
- 22. My Reasons to Own a SmartPhone Choices •Past Experience •Present Relationship (Emotional Attachment) •Future Dream (Expectations) Determinants (Rank importance 1=Least to 5=Most) •Affordability •Pleasure •Practical •Status Symbol •Latest Technology
- 23. 5 3 4 1 2 5 2 3 1 4 1 5 2 4 3 AFFORDABILITY PLEASURE PRACTICAL STATUS SYMBOL LATEST TECHNOLOGY 0% 10% 20% 30% 40% 50% 60% 70% 80% 90% 100% DETERMINANTS ON SMARTPHONE CHOICES PAST EXPERIENCE PRESENT RELATIONSHIP FUTURE DREAM
- 24. PRODUCT PROMISES : SmartPhone Ownership 1. Designed for Humans 2. This changes everything. Again. 3. Your Unfair Advantage 4. Less is more 5. Let your finger talk 6. Better than Bigger 7. Imitation is the best form of flattery 8. Simple is the new Smart 9. Everything your phone isn’t 10. For those who do 11. See what others can’t see 12. Never Settle 13. Small is the new Big
- 25. DURABILITY-FEATURES STYLE - PERFORMANCE SMARTPHONE OWNERSHIP : MALAYSIA STYLE FEATURES DURABILITY PERFORMANCE PERCEPTUAL MAP : DESIGN VS FUNCTION
- 26. PRODUCT PROMISES : SmartPhone Ownership BRANDS 1. Samsung 2. Apple 3. Huawei 4. Xiaomi 5. Oppo 6. Sony 7. Nokia 8. LG 9. HTC 10. Lenovo/Motorola 11. Asus 12. Oneplus 13. Coolpad PROMISES 1. Designed for Humans 2. This changes everything. 3. Your Unfair Advantage 4. Less is more 5. Let your finger talk 6. Better than Bigger 7. Imitation is the best form of flattery 8. Simple is the new Smart 9. Everything your phone isn’t 10. For those who do 11. See what others can’t see 12. Never Settle 13. Small is the new Big
- 28. Smartphone Market Share (20114 – 2016)
- 29. SmartPhone Perceptual Map & Customer Segmentation
- 30. [CELLRANGE] [CELLRANGE] [CELLRANGE] [CELLRANGE] [CELLRANGE] [CELLRANGE] [CELLRANGE] [CELLRANGE] [CELLRANGE] [CELLRANGE] [CELLRANGE][CELLRANGE] [CELLRANGE] DURABILITY-FEATURES STYLE - PERFORMANCE SMARTPHONE OWNERSHIP : GLOBAL 2016 (1,397.1 m) STYLE FEATURES DURABILITY PERFORMANCE PERCEPTUAL MAP : DESIGN VS FUNCTION
- 31. WHAT ARE THE NEEDS OF YOUR CUSTOMER? Hierarchy of Needs of Individuals and Organisations
- 32. Maslow Hierarchy of Needs 1.Self-actualization 2.Esteem 3.Love/Belonging 4.Safety 5.Physiological
- 33. PROMISES, PROMISES CONSUMER 1. “Think different” 2. “Do the Right Thing” 3. “Taste the Feeling” 4. “Be What’s Next” 5. “Let’s Go Places” 6. “Imagine the Possibilities” 7. “i’m lovin’ it” 8. “and you’re done.” B2B 1. “Do the Right Thing” 2. “Be What’s Next” 3. “Think.” 4. “Let’s Go Places” 5. “Imagine the Possibilities” 6. “Imagination at work”
- 34. GLOBAL BRANDS
- 35. Organisation Hierarchy of Needs 1. Brand. The brand describes a promise to stakeholders. The brand is more than the collection of products or services offered by the company. The brand encompasses an emotional value, an aspiration, and the public face of a business strategy. The brand can be viewed as a person, product, organization, and symbol for the company. 2. Strategic Corporate Stakeholder Relations. Organizations seek strategic relationships to achieve a desired reputation, create a defensible competitive advantage, and influence preferential behaviors in the value chain. Tools include positioning strategy, design thinking, CSR and innovation programs. 3. Operational Efficiency Operational efficiency priorities focus on reducing costs, improving existing performance, and optimizing existing landscapes. Operational efficiency is also know as bottom line priorities. 4. Regulatory Compliance. Regulatory compliance is a base need. Organizations must comply with legal requirements. In addition, organizations may want to avoid legal suits, causing injury, or failing to meet a commitment. 5. Revenue and Cashflow Growth. Revenue growth reflects the initiatives used to drive new customers, revenues, and market share and increased cashflow generation to ensure the survival of the organization. Revenue growth is also known as top line priorities. Brand Strategic Corporate Stakeholder Relations Operational Efficiency Regulatory Compliance Revenue and Cashflow Growth
- 36. MARKET SEGMENTATION : B2B • DEMOGRAPHIC • Industries range • Company size • Geographic Locations • OPERATING VARIABLES • Customer Technologies • User or non-user status / Level of usage • Customer capabilities / Level of service support needed • SITUATIONAL FACTORS • Urgency • Specific or all applications • Size of order • PURCHASING APPROACHES • Centralized or decentralized purchasing function in organization • Power structure of decision-makers (engineering/finance) • Nature of existing relationships • General purchasing policies (leasing/service contract/system purchases/tenders) • Purchasing criteria (quality/ service/ price) • PERSONAL CHARACTERISTICS • Buyer-seller similarity (People/values) • Attitude towards risk • Loyalty level to suppliers
- 37. THE MARKETING MIX Understanding interactions with the customer
- 38. The 5 Ps of the Marketing Mix Marketing Mix Product Price Promotion Place (or distribution) People
- 39. Learning from your Supermarket PRODUCT COMPETITORS COMPLEMENTORS SUBSTITUTES
- 40. Have an Amazon lunch …
- 41. Marketing Mix Analysis of fast food brands Exercise : Fast Food Wars
- 42. BRANDS SELECTED BRAND COMPETITOR 1 COMPETITOR 2 (SUBSTITUTE) COMPETITOR 3 (COMPLEMENTOR) MARKETING MIX (1=Disadvantage, 2=No difference, 3=Superior Advantage to competitors) 1. PRODUCT : promise, packaging, ingredients 2. PRICE : Value for money, discounts, bundling offers 3. PROMOTION : On pack offers, in-store advertising, newspaper ad, social media, website 4. PLACE : Availability, convenience of outlets, online store 5. PEOPLE : Store customer service, Helpline, Email support TOTAL SCORE (x/15)
- 43. COMPETITOR ANALYSIS Brand Positioning and Marketing Mix
- 44. COMPETITIVEADVANTAGES MARKET SHARE CONSUMER BRANDS@SUPERMAKET MARKET LEADERS CHALLENGERS COMPLEMENTORS LAGGARDS COMPETITOR ANALYSIS : SUPERMARKET WARS
- 46. Macro Market Trend Analysis Using PESTEL and Force Field Analysis
- 47. Market Trends
- 48. Market Impact
- 49. Exercise : PESTEL using Force Field Analysis Understanding the Macro Market environment
- 50. PESTEL Analysis of MACRO FORCES
- 51. FORCE FIELD ANALYSIS (Rate 1 to 5) Example : Pharmacy Outlet
- 52. Consumption at 10x speed …
- 53. EXERCISE : TARGET MARKET SCORECARD CUSTOMER SEGMENT ATTRACTIVENESS VS MARKET GROWTH
- 54. Target Market Scorecard HIGH ATTRACTIVENESS LOW GROWTH HIGH ATTRACTIVENESS MEDIUM GROWTH HIGH ATTRACTIVENESS HIGH GROWTH MEDIUM ATTRACTIVENESS LOW GROWTH MEDIUM ATTRACTIVENESS MEDIUM GROWTH MEDIUM ATTRACTIVENESS HIGH GROWTH LOW ATTRACTIVENESS LOW GROWTH LOW ATTRACTIVENESS MEDIUM GROWTH LOW ATTRACTIVENESS HIGH GROWTH
- 55. There is always an alternative …
- 56. Case : Marketing Plan – Apollo Tyres http://www.slideshare.net/jainprakhar1/apollo-v2
Hinweis der Redaktion
- 1