This document summarizes a study that used a portable wind tunnel to measure aeolian erosion in different surface types in an arid region of Israel. Three surface types were tested - sparse vegetation, rock fragments, and mechanical crust. Experiments were conducted under natural and disturbed soil conditions at wind speeds of 6 and 11 m/s. The rock fragment plot had the highest total sediment flux under natural conditions at 6 m/s, while the mechanical crust plot lost the most PM10 and sand. Disturbing the soil surfaces and increasing wind speed to 11 m/s significantly increased flux rates across all plots. The mechanical crust plot was generally found to be the most erodible surface type. The study provides insight into how different surface
5 - Dynamic Analysis of an Offshore Wind Turbine: Wind-Waves Nonlinear Intera...
poster egu 5
1. Aeolian Simulation Laboratory
Spatial differences in aeolian erosion of arid silty- sand soils due to surface featuresSpatial differences in aeolian erosion of arid silty- sand soils due to surface features
Edri, A1
., Katra, I1
., Avraham, D2
.
1
Department of Geography and Environmental Development, Ben-Gurion University of the Negev
2
Environmental Research Unit, Negev Nuclear Research Center
Belnap.J, Gillette. D.A. (1998). "Vulnerability of desert biological soil crusts to wind erosion: the influences of crust development, soil
texture, and disturbance". Journal of Arid Environments, 39, 133–142.
Leenders. J.K. (2006). "Wind erosion control with scattered vegetation in the Sahelian Zone of Burkina Faso". (Doctoral dissertation),
Wageningen University and Research Centre, Wageningen, Nederland.
Poesen. J, Lavee. H. (1994). "Rock fragments in top soils: significance and processes". Catena, 23, 1-28.
Shao, Y. (2000). Physics and Modelling of Wind Erosion. Kluwer Academic Publishers, Dordrecht.
Webb, N.P., Strong, C.L. (2011). Soil erodibility dynamics and its representation for wind erosion and dust emission models. Aeolian
Research, doi:10.1016/j.aeolia.2011.03.002
Contact information
Edri, A1
.: Edriav@post.bgu.ac.il, Katra, I1
.: Katara@bgu.ac.il, Avraham,
D2
.: Dodik@post.bgu.ac.il
1
Department of Geography and Environmental Development, Ben-Gurion
University of the Negev
2
Environmental Research Unit, Negev Nuclear Research Center
Introduction
Aeolian soil erosion is common in arid and semi-arid areas. This process impacts the environment including soil degradation and air pollution. Basic surface covers such as soil crusts, rock fragments and spare
vegetation influence the aeolian erosion in arid areas (Belnap & Gillette, 1998; Leenders, 2006; Poesen & Lavee, 1994). Integration of topsoil analyses with aeolian field experiments is needed to develop more
accurate models of soil erosion from a variety of surfaces (Shao, 2008; Webb and Strong, 2011). The aim of this study is to quantify aeolian erosion in silty-sand soil in an arid region in various surfaces, in two
states- native and disturbed soils, using a portable wind tunnel for filed experiments and analysis of topsoil samples in the laboratory.
Study Area
The experiment is conducted in the Yemin Plain, located in the Northeast of the northern Negev. The
area was composed of three main plots: sparse vegetation (SV), rock fragments (RF) and mechanical
crust (MC) (Fig.1). The research area is mainly flat and about 400 m above sea level. The average
summer temperature is 26°C compared with an average winter temperature of 13°C. Annual average
rainfall is 80 mm/year, with large seasonal variations.
MCSV RF
Fig. 1. Selected representative surfaces in the study area: sparse vegetation (SV), rock fragments (RF), and mechanical crust (MC)
Aeolian Simulations
Experiments to determine dust emission potential were conducted
using a portable wind tunnel which was designed and built at Ben-
Gurion University of the Negev (Fig. 2). The development of the
tunnel placed an emphasis on the aerodynamic structure to create a
natural airflow profile. The experiments were conducted in the
tunnel at air velocity of 6 and 11 m/sec. Suspended particles were
measured using a particulate matter (PM) sensor (EPAM) and sand
transport was recorded by the Sensit. Dust samples were collected
during the experiment for laboratory analyses. Two experiments
were conducted under native soil conditions and following
intentional destruction of the surface structure/aggregation. In
parallel to the aeolian measurements, the plots were characterized
by analyzing topsoil samples in the field and in the laboratory.
Results
Analysis of the top soil particle size shows tri- model distribution for
all research plots (Fig.3), significant differences (p≤0.05) were found
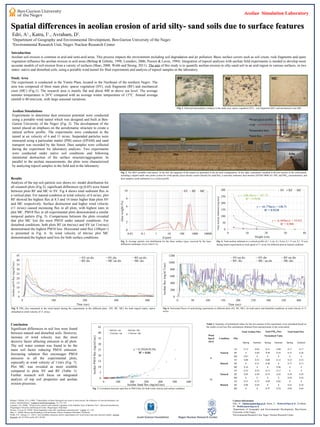
between plots RF and MC to SV. Fig 4 shows total sediment flux in
a vertical plan. For natural condition at wind velocity of 6 m/sec, plot
RF showed the highest flux at 8.5 and 14 times higher than plots SV
and MC respectively. Surface destruction and higher wind velocity
(11 m/sec) caused increasing flux in all plots, with highest rates in
plot MC. PM10 flux in all experimental plots demonstrated a similar
temporal pattern (Fig. 5). Comparisons between the plots revealed
that plot MC lost the most PM10 under natural conditions. For
disturbed conditions, both plots RF (at 6m/sec) and SV (at 11m/sec)
demonstrated the highest PM10 loss .Horizontal sand flux (100µm<)
is presented in Fig. 6. At wind velocity of 6m/sec plot MC
demonstrated the highest sand loss for both surface conditions.
Fig. 2. The BGU portable wind tunnel. In the left, the segments of the tunnel are presented in the air-suck configuration. In the right, instruments installed in the test section of the wind tunnel,
including a digital small-vane probe system for wind speeds, piezo-electric sensor (Sensit) for sand flux, a real-time isokinetic dust monitor (EPAM 5000) for TSP, and PM10 concentrations, and
dust samplers (total sediments) in a vertical profile.
Fig. 5. PM10 flux measured in the wind tunnel during the experiments in the different plots (SV, RF, MC) for both topsoil states, native
disturbed at wind velocity of 11 m/sec.
Fig. 6. Horizontal fluxes of sand during experiments in different plots (SV, RF, MC), for both native and disturbed conditions at wind velocity of 11
m/sec.
Fig. 4. Total aeolian sediment in a vertical profile (Z1= 3 cm, Z2= 8 cm, Z3= 15 cm, Z4= 35 cm)
during tunnel experiments at wind speed of 11 m/sec for different plots at natural condition.
Fig. 3. Average particle size distribution for the three surface types, received by the laser
diffraction technique (ANALYSSETE 22).
Wind
Speed
(m/s)
Condition Plot
Total Aeolian Flux Total PM10 Flux Total Sand Flux
Normalized Value
Spring Summer Spring Summer Spring Summer
6
Natural
SV 0.12 0.89 0.31 0.08 0.17 0.17
RF 1 0.99 0.99 0.59 0.51 0.28
MC 0.07 1 1 1 1 1
Disturb
SV 0.08 0.53 0.08 0.12 0.32 0.14
RF 1 0.31 0.48 1 0.71 0.17
MC 0.16 1 1 0.96 1 1
11
Natural
SV 0.35 0.52 0.15 0.17 1 1
RF 0.05 0.49 0.19 0.42 0.38 0.29
MC 1 1 1 1 0.83 0.36
Disturb
SV 0.51 0.75 0.09 0.02 1 1
RF 0.06 0.44 1 1 0.41 0.24
MC 1 1 0.97 0.54 0.84 0.64
Conclusion
Significant differences in soil loss were found
between natural and disturbed soils. However,
increase of wind velocity was the most
decisive factor affecting emission in all plots.
The soil water content was found to be the
main soil factor reducing PM10 emission.
Increasing saltation flux encourages PM10
emission in all the experimental plots,
especially at wind velocity of 11m/s (Fig. 7).
Plot MC was revealed as more erodible
compared to plots SV and RF (Table 1).
Further research will focus on integrated
analysis of top soil properties and aeolian
erosion processes.
Table 1. Summary of normalized values for the two seasons of the experiment, were calculated based on
the results of soil loss flux calculations obtained from measurements in the wind tunnel.
Fig. 7. Correlation between sand flux to PM10 flux for both wind velocity and surface condition.
10m
•Wind speed profile
•TSP
•Suspended dust
•Sand flux
0.5m
0.5m
Negev Nuclear Research CenterIsrael Science Foundation