
Empfohlen
Empfohlen
Weitere ähnliche Inhalte
Was ist angesagt?
Was ist angesagt? (19)
Ähnlich wie Leading with-intent-pv
Ähnlich wie Leading with-intent-pv (20)
Leading with-intent-pv
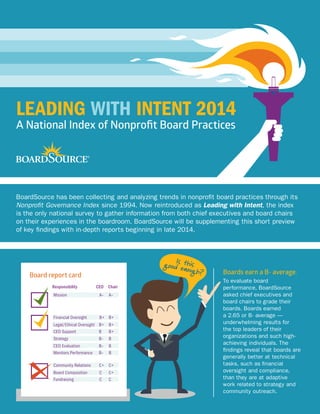
- 1. LEADING WITH INTENT 2014 A National Index of Nonprofit Board Practices BoardSource has been collecting and analyzing trends in nonprofit board practices through its Nonprofit Governance Index since 1994. Now reintroduced as Leading with Intent, the index is the only national survey to gather information from both chief executives and board chairs on their experiences in the boardroom. BoardSource will be supplementing this short preview of key findings with in-depth reports beginning in late 2014. Boards earn a B- average. To evaluate board performance, BoardSource asked chief executives and board chairs to grade their boards. Boards earned a 2.65 or B- average — underwhelming results for the top leaders of their organizations and such high- achieving individuals. The findings reveal that boards are generally better at technical tasks, such as financial oversight and compliance, than they are at adaptive work related to strategy and community outreach. Board report card Responsibility CEO Chair Mission A– A– Financial Oversight B+ B+ Legal/Ethical Oversight B+ B+ CEO Support B B+ Strategy B– B CEO Evaluation B– B Monitors Performance B– B Community Relations C+ C+ Board Composition C C+ Fundraising C C Is thisgood enough?
- 2. Finding financial stability amidst constant change requires strategic leadership. Board diversity is not a numbers game. It’s the people who count. Board composition Diversity satisfaction & importance Board members need to step up and speak out more. Still in the wake of the economic downturn, nonprofits continue to find their funding declining and the demand for their services rising. While most organizations are doing better financially than they were a year ago, some — especially smaller organizations — remain pinched. The political, economic, regulatory, and demographic forces shaping our society are constantly changing, and so must our organizations if we wish to remain vital and vibrant. Board composition — size and diversity — is changing, slowly. BoardSource research shows that average board size has declined from 19 members in 1994 to 15 members in 2014. As boards shrink, it’s even more important to carefully compose the board. Yet, only 73% of chief executives agreed that they have the right board members to effectively oversee and govern their organization. The nonprofit sector has seen modest progress on increasing racial/ethnic, gender, and age diversity among chief executives and board members. But, distinct diversity gaps persist. Digging deeper into the numbers, more than 50% of organizations demonstrate functional inclusion (formal policies, practices, and processes), but fewer than 50% report a great degree of social inclusion (interpersonal dynamics and group culture). Board members are essential to successful community outreach, advocacy, and fundraising, and they have more work to do. 87% of participating organizations engage in fundraising, and it remains a perennial challenge for nonprofit boards. 60% of chief executives identified fundraising as the area most in need of board improvement, followed by ambassadorship at 41%. Board members need to raise their collective voices as committed and informed champions for their missions. Roughly 50% of survey respondents • created new staff positions • launched major initiative or expansion (e.g., program, building) • expanded operations or added services • increased contributed revenue On boards, people of color have increased from 16% in 2010 to 20% in 2014. But 25% of boards remain all White. More than 65% of small and 75% of medium organizations have female CEOs, but only 37% of large organizations have female CEOs. Board members under 40 years of age have increased from 14% in 2010 to 17% in 2014. First Steps for Engaging the Board in Advocacy In response to shifts in government funding and public policy, savvy nonprofits are broadening the definition of outreach and making advocacy an explicit priority. • Have a conversation with the board about key public policies that impact the organization’s work. • Incorporate the board’s role in advocacy into board job description and expectations. • Tap board members to help open doors and make the case to decision-makers. Roughly 20% dipped into reserves or endowment and/or lost revenues. Roughly 15% drastically altered program delivery, froze salaries, or downsized operations. Satisfaction with diversity is lowest for race/ethnicity yet seen as most important to mission. —CEO of an association 22% 18% to a great extent 27% to some extent 13% to a great extent 24% to some extent “Several prominent board members continue to hold onto long-held beliefs and expectations that are no longer relevant in today’s society.” How do you cultivate an inclusive board? White People of Color <40 40-64 65+ Male Female Financial performance 46% 53% 53% Better than previous year About the same Worse than previous year Dissatisfied Satisfied not important important Small Organizations – Less than $1 million operating budget Satisfaction Satisfaction Satisfaction Board chair Board CEO Importance Importance Importance Medium Organizations – $1 million to $9.9 million operating budget Large Organizations – $10+ million operating budget 40% 38% 36% 14% 9% 11% Have a formal, written public policy/advocacy agenda Received info/resources on advocacy activities for the organization Monitored impact of public policy on mission delivery and resources —Board chair of an arts organization “Our board lobbies hard to keep our funding from our city and county government. We have been able to maintain our funding and increase programming during a poor economy.” What do you expect from your board members as ambassadors? Board fundraising remains a challenge. The old adage of “give, get, or get off” still resonates. Board members have improved at giving. In 1994, CEOs reported that 60% of their board members gave. In 2014, they reported 85% board giving, though only 60% of nonprofits had 100% board giving. Getting remains a challenge, perhaps because of unclear expectations and board member discomfort. 76% of board chairs agree (21% strongly agree and 55% agree) that fundraising expectations related to giving and getting are clearly explained during recruitment. Board participation in fundraising ComfortableNot Comfortable On average, 42% of board members provided names for letters and calls. On average, 26% of board members asked or joined others in directly asking for money. On average, 22% of board members met with potential donors face- to-face. “Although I have long been blessed with an INVOLVED board, it is really only in the last few years that the board has embraced the rigor and ‘professionalism’ of a STRATEGIC board, and we have grown accordingly.” —CEO of a historical society IDENTIFYING DONORS MEETING DONORS ASKING DONORS 51%60%56%20% GENDER GENDER AGE AGEROLE RACE/ ETHNICITY RACE/ ETHNICITY 24% 69% 33% 36% 29% 53% 75% 31% 67% 63% 71% 47% 90% 64% 54% 52% 65% 68% 80% 27% 46% 48% 35% 16% 14% 80% 89% 10% 10% 6% 17%20% 11% BOARDDIVERSITY STEPUP&SPEAKOUT Very Comfortable 24% 27% 43% 2 1STRATEGICLEADERSHIP 3 12% 6%
- 3. Board chair report card A B C Leading with Intent 2014 A National Index of Nonprofit Board Practices BoardSource has been collecting and analyzing trends in nonprofit board practices through its Nonprofit Governance Index since 1994. Now reintroduced as Leading with Intent, the index is the only national survey to gather information from both chief executives and board chairs on their experiences in the boardroom. BoardSource will be supplementing this short preview of key findings with in-depth reports beginning in late 2014. HUNGRY FOR MORE BOARD-ENRICHING, SECTOR-LEADING DATA? COMING SOON: WWW.BOARDSOURCE.ORG/LEADINGWITHINTENT FULL, DETAILED LEADING WITH INTENT REPORTS WILL BE AVAILABLE BEGINNING IN LATE 2014. Boards earn a B- average. To evaluate board performance, BoardSource asked chief executives and board chairs to grade their boards. Boards earned a 2.65 or B- average — underwhelming results for the top leaders of their organizations and such high- achieving individuals. The findings reveal that boards are generally better at technical tasks, such as financial oversight and compliance, than they are at adaptive work related to strategy and community outreach. Board report card Responsibility CEO Chair Mission A– A– Financial Oversight B+ B+ Legal/Ethical Oversight B+ B+ CEO Support B B+ Strategy B– B CEO Evaluation B– B Monitors Performance B– B Community Relations C+ C+ Board Composition C C+ Fundraising C C Is thisgood enough? Best-in-class boards do their homework on culture and dynamics. The real secret to board success — leadership culture — is difficult to measure. A productive leadership culture requires having the right people on the board, achieving clarity around roles and responsibilities, and educating and engaging board members. Strengthening the culture requires leading with intent: thoughtful planning, determined dedication, and collective commitment from chief executives, board chairs, and board members. Role clarity Board development Board culture Together, dynamic duos of board chairs and chief executives spent a combined total of four days per month on board work. Chairs spent an average of 14.5 hours and chief executives spent an average of 17.8 hours per month on board work. Sharing leadership is a delicate balancing act. Understanding, defining, and adhering to the respective roles of the board and chief executive in nonprofit governance is no small feat. And, it looks different depending on where you sit. 65% of board chairs, compared to 42% of CEOs, strongly agree that the CEO involves the board in leading the organization. 69 21 36 81 51 19 B- 12 28 41 percent of chairs feel board members are well informed of their governance responsibilities percent of board chairs strongly agree that orientation is effective fosters an environment that builds trust. is able to resolve conflict, build consensus, and reach compromise. encourages board members to frame and discuss strategic questions. establishes clear expectations of board service. My board chair... 42% 33% 34% 23% 33% 33% 29% 34% 19% 25% 25% 27% percent of CEOs feel that, to a great extent, board members are prepared for meetings percent of organizations with written board member job descriptions percent of boards have conducted a formal, written board self- assessment in the past three years percent of CEOs strongly agree that the majority of board members are engaged establishes clear expectations of board service percent of board chairs strongly agree that all board members participate in discussions percent of CEOs strongly agree that they have an effective board officer succession process percent of CEOs strongly agree that the board openly discusses and challenges their recommendations understanding the board’s roles and responsibilities What extra-credit work can and should your board do to become best-in-class? Methodology In 2014, the eighth iteration of BoardSource’s national survey of nonprofit board practices was sent to members, clients who recently used our services, and people who visited our website. 850 chief executives and 246 board chairs completed the survey. Of the chief executives, 37% represented small organizations with annual operating budgets less than $1 million, 49% represented medium organizations with budgets between $1 million and $9.9 million, and 14% represented large organizations with budgets of $10 million or more. Respondents represent a wide spectrum of the nonprofit sector, including public charities, associations, and foundations. CEO responses Board chair responses CULTURE&DYNAMICS4
- 4. HUNGRY FOR MORE BOARD-ENRICHING, SECTOR-LEADING DATA? COMING SOON: WWW.BOARDSOURCE.ORG/LEADINGWITHINTENT FULL, DETAILED LEADING WITH INTENT REPORTS WILL BE AVAILABLE BEGINNING IN LATE 2014. Methodology In 2014, the eighth iteration of BoardSource’s national survey of nonprofit board practices was sent to members, clients who recently used our services, and people who visited our website. 850 chief executives and 246 board chairs completed the survey. Of the chief executives, 37% represented small organizations with annual operating budgets less than $1 million, 49% represented medium organizations with budgets between $1 million and $9.9 million, and 14% represented large organizations with budgets of $10 million or more. Respondents represent a wide spectrum of the nonprofit sector, including public charities, associations, and foundations.