

Empfohlen
Weitere ähnliche Inhalte
Was ist angesagt?
Was ist angesagt? (20)
Andere mochten auch
Andere mochten auch (20)
Ähnlich wie 9.2 plant transport in the phloem
Ähnlich wie 9.2 plant transport in the phloem (20)
Mehr von Bob Smullen
Mehr von Bob Smullen (20)
Kürzlich hochgeladen
Kürzlich hochgeladen (20)
9.2 plant transport in the phloem
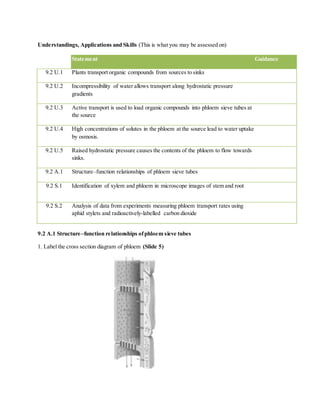
- 1. Understandings, Applications and Skills (This is what you may be assessed on) Statement Guidance 9.2 U.1 Plants transport organic compounds from sources to sinks 9.2 U.2 Incompressibility of water allows transport along hydrostatic pressure gradients 9.2 U.3 Active transport is used to load organic compounds into phloem sieve tubes at the source 9.2 U.4 High concentrations of solutes in the phloem at the source lead to water uptake by osmosis. 9.2 U.5 Raised hydrostatic pressure causes the contents of the phloem to flow towards sinks. 9.2 A.1 Structure–function relationships of phloem sieve tubes 9.2 S.1 Identification of xylem and phloem in microscope images of stem and root 9.2 S.2 Analysis of data from experiments measuring phloem transport rates using aphid stylets and radioactively-labelled carbon dioxide 9.2 A.1 Structure–function relationships ofphloem sieve tubes 1. Label the cross section diagram of phloem (Slide 5)
- 2. 9.2 S.1 Identification ofxylem and phloem in microscope imagesofstem and root 2. Label the cross section diagram of dicot and monocot roots and stems (Slide 6 & 7)
- 3. 9.2 U.1 Plants transport organic compounds from sources to sinks 3. The movement of materials in a plant is called (Slide 9) 4. The movement of material down from the leaves occurs in (Slide 9) 5. Distinguish between source and sink in terms of molecules in plants. (Slide 10-11) 9.2 U.2 Incompressibility ofwater allows transport along hydrostatic pressure gradients 4. Describe the effect of hydrostatic pressure. (Slide 12-13) 5. Explain hydrostatic pressure gradients helps move sucrose. (Slide 12-13) 9.2 U.3 Active transport is used to load organic compounds into phloem sieve tubes at the source 6. Explain the flow sucrose occurs from the storage cell, to the companion cells and then into the phloem. (Slides 14-15) 9.2 U.4 High concentrations ofsolutes in the phloem at the source lead to water uptake by osmosis 7. Why is it necessary for the veins (which contain xylem and phloem) to be relatively close together in plants? (Slide 16-17) 8. Describe how transpiration and osmosis help movement of sucrose in a plant. (Slide 16-17)
- 4. 9.2 U.5 Raised hydrostatic pressure causesthe contents ofthe phloem to flowtowards sinks. 9. Explain the mechanism for movement of sucrose during translocation 9.2 S.2 Analysis ofdata from experiments measuring phloem transport rates using aphid stylets and radioactively-labelled carbon dioxide 10. Describe how aphids feed (Slide 20) 9. Explain how data from radioactively-labeled carbon dioxide can be used to measure rates of phloem transport. (Slide 20-22) Translocation Lab Purpose Transpiration is the loss of water through the leaves of the plant. As the temperature increases,the rate of transpiration increases as the plant tries to cool itself and meet the demands of water use for photosynthesis and metabolism. The movement of water out the stomata causes transpiration pull. Transpiration pull is internal pressure,in this case suction, that is created as water moves through the plant and out of the leaves during transpiration. Translocation is the movement of the liquids within the plant system. As the plant absorbs water and dissolved nutrients in the roots, the vascular system carries these substances to where the plant needs them. Translocation also refers to the movement of dissolved sugars in the phloem. The relationship between translocation and transpiration is recognized as a direct relationship. For example, as the rate of transpiration increases the rate of translocation of fluids will also increase. This activity will explore transpiration and translocation of water through the leaves and stem of a plant. You will examine how different environmental conditions influence the rate of transpiration in plants.
- 5. Materials Per pair of students: 2 small beakers 2 stalk of celery Red food coloring Knife Graduated cylinder Distilled water 2 sheets paper towel Procedure You and a partner will conduct an investigation for transpiration rate. Your teacher will assign you an environmental condition to test and later report the data to the entire class to compare results. Follow the steps outlined below. Part 1 – Setup Experiment 1. Cut ½” off the end of each stalk of celery (not the leaf end to expose the xylem). 2. Trim your longer celery stalk so both stalks are the same height. Record the height in Table 1. 3. Record observations about your celery stalks in the box on the below. Record color, texture, turgidity, etc. 4. Use a graduated cylinder to fill the beakers with 200 ml of distilled water each. 5. Label the beakers with your group initials. Label one beaker “experiment” and one beaker “control.” 6. Use red food coloring to dye the water to a deep red color. 7. Choose and circle the environmental condition you will test: -Wind, higher light intensity, darkness, cold temp., warm temp, high humidity, other: 8. Place the cut end of the celery stalks in the red water. Record time of day in Table 1. 9. Place the control and experimental celery stalks in locations indicated by your teacher. 10. Make predictions for both the translocation and transpiration rates in the box below. Observations- Day 1 Experiment Control Predictions Experiment The translocation rate will be higher/lower that the control because: The transpiration rate will be higher/lower that the control because: Control The translocation rate will be higher/lower that the experiment because: The transpiration rate will be higher/lower that the experiment because:
- 6. Part 2 – Transpiration and translocation rates 1. Collect your experiment and control beakers. 2. Make observations in the box below. Observations- Day 2 Experiment Control 3. Determine the number of hours the celery was left in the red water and record in Table 1. 4. Remove the celery from the red water. 5. Use a paper towel to dry off excess liquid. 6. Use your knife to remove 1 cm slices from the bottom to the top. Examine each slice for appearance of red dye. When you stop seeing red dye, stop cutting. 7. Measure the length of the remaining celery stalk and subtract from the beginning length. Record in Table 1. 8. Divide the length of celery with dye by hours celery was left in red water to get translocation rate of cm/hr and record in Table 1. 9. Now find the transpiration rate. Use a graduated cylinder to measure the liquid left in your beaker and record in Table 1 as ending water volume. 10. Find the difference between beginning (200 ml) and ending water volume and record in Table as volume of water transpired. 11. Divide the volume transpired hours celery was left in red dye to get transpiration rate of ml/hr and record in Table 1. 12. Report your data to the class and record classmate’s data in Table 2. Table 1 Test Data Experiment Control Difference Beginning length (cm) Time at beginning ofexperiment Time at end of experiment Hours celery left in red water (hrs) Length ofcelery with dye (cm) Ending water volume (ml) Volume ofwater transpired (ml) Trans-location rate (cm/hr) Trans-piration rate (ml/hr)
- 7. Table 2 Class Data Test Translocation rate difference (cm/hr) Transpiration rate difference (ml/hr) Wind High light Darkness Cold temp. Warm temp. High humidity Other: Conclusion 1. Which experimental conditions caused increased translocation rates? Which experimental conditions caused increased transpiration rates? 2. Which variable resulted in the greatest difference in transpiration rates? Explain why this factor might increase water loss when compared to the others. 3. What adaptations enable plants to increase or decrease water loss? How might each affect transpiration?