Managerial Economics BEP Analysis
•Als DOCX, PDF herunterladen•
2 gefällt mir•562 views

Managerial Economics And Financial Analysis (MEFA) _JNTUA syllabus

Empfohlen
Weitere ähnliche Inhalte
Was ist angesagt?
Was ist angesagt? (20)
Ähnlich wie Managerial Economics BEP Analysis
Ähnlich wie Managerial Economics BEP Analysis (20)
Mehr von Shaik Mohammad Imran
Mehr von Shaik Mohammad Imran (20)
Kürzlich hochgeladen
Kürzlich hochgeladen (20)
Managerial Economics BEP Analysis
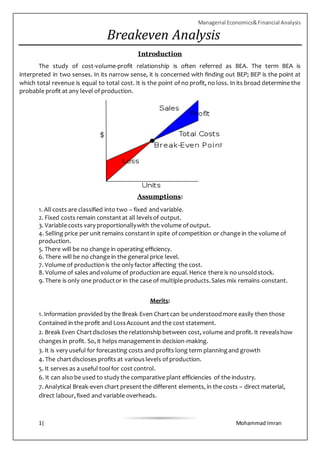
- 1. Managerial Economics&Financial Analysis 1| Mohammad Imran Breakeven Analysis Introduction The study of cost-volume-profit relationship is often referred as BEA. The term BEA is interpreted in two senses. In its narrow sense, it is concerned with finding out BEP; BEP is the point at which total revenue is equal to total cost. It is the point of no profit, no loss. In its broad determine the probable profit at any level of production. Assumptions: 1. All costs are classified into two – fixed andvariable. 2. Fixed costs remain constantat all levelsof output. 3. Variable costs vary proportionallywith the volume of output. 4. Selling price per unit remains constantin spite of competition or change in the volume of production. 5. There will be no change in operating efficiency. 6. There will be no change in the general price level. 7. Volume of productionis the only factor affecting the cost. 8. Volume of sales andvolume of productionare equal.Hence there is no unsoldstock. 9. There is only one productor in the case of multiple products.Sales mix remains constant. Merits: 1. Information provided by the Break Even Chartcan be understoodmore easily then those Contained in the profit and LossAccount and the cost statement. 2. Break Even Chartdiscloses the relationshipbetween cost, volume and profit. It revealshow changesin profit. So, it helps managementin decision-making. 3. It is very useful for forecasting costs and profits long term planningand growth 4. The chartdiscloses profits at variouslevels of production. 5. It serves as a useful toolfor cost control. 6. It can also be used to study the comparative plant efficiencies of the industry. 7. Analytical Break-even chart presentthe different elements, in the costs – direct material, direct labour,fixed and variable overheads.
- 2. Managerial Economics&Financial Analysis 2| Mohammad Imran Demerits: 1. Break-even chart presentsonly cost volumeprofits. It ignores other considerationssuch as capital amount, marketingaspects and effect of governmentpolicy etc., which are necessary in decision making. 2. It is assumed thatsales, totalcost and fixed cost can be represented as straightlines. In actual practice, this may not be so. 3. It assumesthat profit is a function of output.This is notalways true.The firm may increase the profit without increasing its output. 4. A major draw back of BEC is its inability to handle productionand sale of multiple products. 5. It is difficult to handleselling costs suchas advertisement and sale promotion in BEC. 6. It ignores economics of scale in production. 7. Fixed costs do not remain constantin the longrun. 8. Semi-variable costs are completely ignored. 9. It assumesproduction is equal to sale. It is not always truebecause generally there may be opening stock. 10. When production increases variable cost per unit may not remain constantbut may reduce on account of bulkbuying etc. 11. The assumptionof static nature of business and economic activities is a well-known defect of BEC. 1. Fixed cost 2. Variable cost 3. Contribution 4. Marginof safety 5. Angle of incidence 6. Profit volume ratio 7. Break-Even-Point 1. Fixed cost: Expenses that do not vary with the volume of production are known as fixed expenses. Eg. Manager’s salary, rent and taxes, insurance etc. It should be noted that fixed changes are fixed only within a certain range of plant capacity. The concept of fixed overhead is most useful in formulating a price fixing policy. Fixed cost per unit is not fixed. 2. Variable Cost: Expenses that vary almost in direct proportion to the volume of production of sales are called variable expenses. Eg. Electric power and fuel, packing materials consumable stores. It should be noted that variable cost per unit is fixed. 3. Contribution: Contribution is the difference between sales and variable costs and it contributed towards fixed costs and profit. It helps in sales and pricing policies and measuring the profitability of different proposals. Contribution is a sure test to decide whether a product is worthwhile to be continued among different products.
- 3. Managerial Economics&Financial Analysis 3| Mohammad Imran Contribution = Sales – Variable cost Contribution = Fixed Cost + Profit. 4. Margin of safety: Margin of safety is the excess of sales over the break even sales. It can be expressed in absolute sales amount or in percentage. It indicates the extent to which the sales can be reduced without resulting in loss. A large margin of safety indicates the soundness of the business. The formula for the margin of safety is: Present sales – Break even sales (or) Profit P. V. ratio Margin of safety can be improved by taking the following steps. 1. Increasing production 2. Increasing selling price 3. Reducing the fixed or the variable costs or both 4. Substituting unprofitable product with profitable one. 5. Angle of incidence: This is the angle between sales line and total cost line at the Break-even point. It indicates the profit earning capacity of the concern. Large angle of incidence indicates a high rate of profit; a small angle indicates a low rate of earnings. To improve this angle, contribution should be increased either by raising the selling price and/or by reducing variable cost. It also indicates as to what extent the output and sales price can be changed to attain a desired amount of profit. 6. Profit Volume Ratio is usually called P. V. ratio. It is one of the most useful ratios for studying the profitability of business. The ratio of contribution to sales is the P/V ratio. It may be expressed in percentage. Therefore, every organization tries to improve the P. V. ratio of each product by reducing the variable cost per unit or by increasing the selling price per unit. The concept of P. V. ratio helps in determining break even-point, a desired amount of profit etc. The formulais, Contribution X 100 Sales 7. Break – Even- Point:If we divide the term into three words, thenit does not require further explanation. Break-divide Even-equal Point-place or position Break Even Point refers to the point where total cost is equal to total revenue. It is a point of no profit, no loss.This is alsoa minimum point of no profit, no loss. This is also a minimum point of productionwhere totalcosts are recovered. If sales go up beyond the Break Even Point, organization makes a profit. If they come down, a loss is incurred. 1. Break Even point (Units)= Fixed Expenses Contributionper unit 2. Break Even point (In Rupees) = Fixedexpenses X Sales Contribution