
Empfohlen
Weitere ähnliche Inhalte
Ähnlich wie KnowAPIs-UnknownPerf-jaxMainz-2024 (1).pptx
Ähnlich wie KnowAPIs-UnknownPerf-jaxMainz-2024 (1).pptx (20)
Mehr von Tier1 app
Mehr von Tier1 app (20)
Kürzlich hochgeladen
Kürzlich hochgeladen (20)
KnowAPIs-UnknownPerf-jaxMainz-2024 (1).pptx
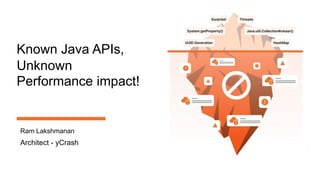
- 1. Known Java APIs, Unknown Performance impact! Ram Lakshmanan Architect - yCrash
- 3. System.out.println() – source code public void println(String x) { synchronized (this) { print(x); newLine(); } }
- 4. Performance Comparison with Log4j2 0 0.05 0.1 0.15 0.2 0.25 0.3 0.35 Logger System.out.print Avg Response Time 91% degradation
- 7. Thread dump analysis report – stack trace STATE : BLOCKED java.security.SecureRandom.nextBytes(SecureRandom.java:433) java.util.UUID.randomUUID(UUID.java:159) com.buggycompany.jtm.bp.<init>(bp.java:185) com.buggycompany.jtm.a4.f(a4.java:94) com.buggycompany.agent.trace.RootTracer.topComponentMethodBbuggycompanyin(RootTracer.java:439) weblogicx.servlet.gzip.filter.GZIPFilter.doFilter(GZIPFilter.java) weblogic.servlet.internal.FilterChainImpl.doFilter(FilterChainImpl.java:56) weblogic.servlet.internal.WebAppServletContext$ServletInvocationAction.wrapRun(WebAppServletContext.java:3730) weblogic.servlet.internal.WebAppServletContext$ServletInvocationAction.run(WebAppServletContext.java:3696) weblogic.security.acl.internal.AuthenticatedSubject.doAs(AuthenticatedSubject.java:321) weblogic.security.service.SecurityManager.runAs(SecurityManager.java:120) weblogic.servlet.internal.WebAppServletContext.securedExecute(WebAppServletContext.java:2273) weblogic.servlet.internal.WebAppServletContext.execute(WebAppServletContext.java:2179) weblogic.servlet.internal.ServletRequestImpl.run(ServletRequestImpl.java:1490) weblogic.work.ExecuteThread.execute(ExecuteThread.java:256) weblogic.work.ExecuteThread.run(ExecuteThread.java:221) Checking Entropy in Linux cat /proc/sys/kernel/random/entropy_avail If < 1000, it’s a problem
- 8. Solution • RHEL • Upgrade to RHEL 7 or above version • If < RHEL 7, follow recommendations given here • Install Haveged Library - Unpredictable Random number generator • Use /dev/urandom instead of /dev/random • ‘/dev/random’ serve as pseudorandom number generators • ‘/dev/urandom’ is another special file that is capable of generating random numbers. Downside: reduced security due to less randomness • -Djava.security.egd=file:/dev/urandom
- 10. System.getProperty() • ‘java.lang.System.getProperty()’ API underlyingly uses ‘java.util.Hashtable.get()’ API. public synchronized V get(Object key) { : : } • If used in critical code path, can significantly affect application performance
- 11. Real world problem: Atlassian SDK 189 Threads Blocked
- 12. Victim Thread Stack trace http-nio-8080-exec-293 Stack Trace is: java.lang.Thread.State: BLOCKED (on object monitor) at java.util.Hashtable.get(Hashtable.java:362) - waiting to lock <0x0000000080f5e118> (a java.util.Properties) at java.util.Properties.getProperty(Properties.java:969) at java.util.Properties.getProperty(Properties.java:988) at java.lang.System.getProperty(System.java:756) at net.java.ao.atlassian.ConverterUtils.enforceLength(ConverterUtils.java:16) at net.java.ao.atlassian.ConverterUtils.checkLength(ConverterUtils.java:9) :
- 13. Culprit Thread Stack trace Camel Thread #6 – backboneThreadPool Stack Trace is: at java.util.Hashtable.get(Hashtable.java:362) - locked <0x0000000080f5e118> (a java.util.Properties) at java.util.Properties.getProperty(Properties.java:969) at java.util.Properties.getProperty(Properties.java:988) at java.lang.System.getProperty(System.java:756) at net.java.ao.atlassian.ConverterUtils.enforceLength(ConverterUtils.java:16) at net.java.ao.atlassian.ConverterUtils.checkLength(ConverterUtils.java:9) :
- 14. Solution • Upgrade to JDK 11 or above Synchronized HashTable has been replaced with ConcurrentHashMap • Cache the values: public static String getAppName() { String app = System.getProperty("appName"); return app; } private static String app = System.getProperty("appName"); public static String getAppName() { return app; }
- 16. Interview question • What is the difference between HashMap and HashTable? • But what happens when you do concurrent put() and get() on HashMap - • How to diagnose CPU spike? top –H –p <PROCESS_ID> + Thread dump
- 17. top –H –p <PROCESS_ID>
- 18. 360° Troubleshooting artifacts Open-source script: https://github.com/ycrash/yc-data-script 1. GC Log 10. netstat 12. vmstat 2. Thread Dump 9. dmesg 3. Heap Dump (optional) 6. ps 8. Disk Usage 5. top 11. ping 16. metadata 4. Heap Substitute 7. top -H 13. iostat 14. Kernel Params 15. App Logs
- 19. Real case study: Major bank in Canada • https://tinyurl.com/j5jnmrxr
- 20. Which Map to use? • ConcurrentHashMap – Safe & fast • https://blog.ycrash.io/2022/04/15/java-hashtable-hashmap- concurrenthashmap-performance-impact/ 0 10 20 30 40 50 60 HashMap ConcurrentHashMap Hashtable 3.16 4.26 56.27 Execution Time
- 22. ArrayList Object[] 1 2 3 4 5 6 7 8 n ArrayList Object[] public class ArrayList<E> extends AbstractList<E> { : : transient Object[] elementData; : : }
- 26. Memory Impact 0 5 10 15 20 25 30 Just created clear() null 27.5 4.64 0 ArrayList Size (MB)
- 27. Real world example – Trading app public void clear() { modCount++; // clear to let GC do its work for (int i = 0; i < size; i++) elementData[i] = null; size = 0; }
- 29. JDBC SOAP MainFr ame REST Server Thread Pool Application Server HTTP(S) request Typical Architecture
- 30. 1 million threads for (int i = 0; i < 1_000_000; i++) { new Thread(new Runnable() { @Override public void run() { TimeUnit.HOURS.sleep(1); } }).start(); }
- 31. Performance Comparison Thread Count Memory Size Thread Analysis Heap Analysis Platform Threads 1599. After that OutOfMemoryErr or 1.85 MB https://tinyurl.co m/ntfastthread https://tinyurl.co m/ntheaphero Virtual Threads 1 million. No issues 401 MB https://tinyurl.co m/vtfastthread https://tinyurl.co m/vtheaphero
- 32. Threads Architecture O T O T O T O T O T O T P T P T P T P T P T P T Native Memory OT Operating System Thread PT Platform Thread
- 33. O T O T O T O T O T O T P T V T V T V T V T V T V T V T V T V T V T V T V T V T V T P T P T P T P T P T Java Heap Native Memory V T V T V T VT OT Virtual Thread Operating System Thread PT Platform Thread
- 34. O T O T O T O T O T O T P T V T V T V T V T V T V T V T V T V T V T V T V T V T V T V T P T P T P T P T P T Java Heap Native Memory V T V T V T VT OT Virtual Thread Operating System Thread PT Platform Thread
- 37. How objects are garbage collected? Evolution: Manual -> Automatic 3 – 4 decades before Now Developer Writes code to Manually evict Garbage JVM JVM Automatically evicts Garbage
- 38. Automatic GC sounds good, right? Yes, but for CPU consumption GC pauses
- 39. Real world – Long GC Pause in Top Cloud Provider https://blog.gceasy.io/2022/03/04/garbage-collection-tuning-success-story-reducing-young-gen-size/
- 40. What is GC throughput? How does 96% GC Throughput sound? 1 day = 1440 Minutes (i.e., 24 hours x 60 minutes) 96% GC Throughput means app pausing for 57.6 minutes/day Amount of time application spends in processing customer transactions vs Amount of time application spends in processing garbage collection activity
- 41. Real world – Largest Automobile manufacturer https://blog.gceasy.io/2022/08/25/automobile-company-optimizes-performance-using-gceasy/ Avg response time (secs) Transactions > 25 secs (%) Baseline 1.88 0.7 GC settings #2 1.36 0.12 GC settings #3 1.7 0.11 GC settings #4 1.48 0.08 GC settings #5 2.045 0.14 GC settings #6 1.087 0.24 GC settings #7 1.03 0.14 GC settings #8 0.95 0.31 49.46% Improvement GC Tuning improves entire app’s response time
- 42. More Case Studies Uber Saves Millions of $ https://blog.gceasy.io/2022/03/04/garbage-collection-tuning-success-story-reducing-young-gen-size/ Major Cloud Provider improves it’s SLA https://blog.gceasy.io/2022/03/04/garbage-collection-tuning-success-story-reducing-young-gen-size/ CloudBees (Jenkins Parent company) optimizes https://blog.gceasy.io/2019/08/01/cloudbees-gc-performance-optimized-with-gceasy/ Oracle optimizes App performance by tuning GC https://blog.gceasy.io/2022/12/06/oracle-architect-optimizes-performance-using-gceasy/
- 43. Large SaaS Company CEO’s tweet
- 44. How to tune GC Performance? Free Video: https://www.youtube.com/watch?v=6G0E4O5yxks Online Training: https://ycrash.io/java-performance-training
- 45. Thank you friends! Ram Lakshmanan ram@tier1app.com @tier1app linkedin.com/company/ycrash This deck will be published in: https://blog.fastthread.io
Hinweis der Redaktion
- https://gceasy.io/my-gc-report.jsp?p=c2hhcmVkLzIwMjQvMDQvMjMvMjQtaG91ci1nYy1sb2cuZ3otLTQtNDUtMzg=&channel=WEB https://gceasy.io/my-gc-report.jsp?p=c2hhcmVkLzIwMjQvMDQvMjMvNTAtaG91ci1nYy1sb2cuZ3otLTQtNTEtMjU=&channel=WEB http://localhost:8080/yc-report.jsp?ou=SAP&de=192.168.56.170&app=yc&ts=2024-04-21T11-43-54 http://localhost:8080/yc-report.jsp?ou=SAP&de=192.168.56.170&app=yc&ts=2024-04-21T11-45-24