How to Create KPIs WITHOUT Data?
•
0 gefällt mir•115 views

KPIs (Key PRocess Indicators) are basically graphs that ceated from data analysis. They like the car dashboard, where we see how much fuel the car has, what is the oil status, engine temperature and even if we have a flat tier. But how do you handle a situation when you have no data to analize and no resources to even begin to ccollect data? Check out this tip for creating graphs WITHOUT data, and what do you gain with that.
Melden
Teilen
Melden
Teilen
Downloaden Sie, um offline zu lesen

Empfohlen
Ian Swanson Keynote
Data science involves using automated methods to analyze massive amounts of data from various structured and unstructured sources to extract knowledge and insights. It is an interdisciplinary field that incorporates computer science, modeling, statistics, analytics, and mathematics. There is a growing demand and shortage of data scientists across many industries as organizations face challenges in organizing large amounts of data but most companies are not seeing significant value from their data science efforts yet.
Does employee happiness equal customer happiness? - No!
Here (at last) is definitive proof about the relationship between employee and customer satisfaction. Surprise! There is very little relationship between the two. The research covers 345 US businesses that sell to consumers. It confirms similar research done a year ago.
Apple & Dell - Financial Analysis 2008 - 2011
This document provides a financial analysis of Apple and Dell from 2008 to 2011. It includes information on the companies' markets, marketing strategies, net sales and income comparisons, balance sheets, income statements, ratios, and stock prices. Apple experienced strong net sales and income growth during this period, while Dell's sales and income declined or were volatile. The document analyzes various metrics to understand the financial performance and trends of the two companies.
Pres. Gertjan Kaart Credit Alliance Jan 2011
The document discusses credit scoring models and their quality. It notes that scoring models are tailored based on the available data in different markets and that a blended model using different data sources can improve scores. It also emphasizes that the predictive value of scores is important but other factors like coverage, speed, and understandability also contribute to quality. Customers evaluate scores based on both technical quality and other criteria.
Adjust App-Trends-Report-2020
Adjust’s annual App Trends 2020 report for long-term trends based on data from 2019 sheds light on insights into how COVID-19 has affected the app economy by comparing Q1 2019 and Q1 2020 figures.
Statistics presentation
Statistics can be used in various business and organizational applications. Some examples include:
1. Statistics can help small businesses with financial analysis and accounting by analyzing accounts, cash flow, budgets, and financial positions. Management accounts and balance sheets can provide accurate financial snapshots.
2. Analyzing company reports and statistics like ratios can help businesses make informed decisions about suppliers and customers. It can help avoid credit problems and financial impacts.
3. Performance ratios involving current assets, current liabilities, and cash flows can help track business performance over time.
4. Other applications include search analytics, official government statistics, and marketing analytics to understand customers and markets. Statistics are also used in policing to analyze crime data and
Beyond the Spreadsheet
The document discusses using data visualization to drive collaboration and quality improvement. It argues that while spreadsheets are useful for optimization problems, visualizing data in infographic style allows stakeholders to have more constructive conversations. The document presents an example from West Corporation called CEEQ (Comprehensive End to End Quality) scoring, which visualizes software quality metrics. CEEQ scoring frames discussions around overall success and quality rather than isolating individual metrics, and provides nuanced insights to identify improvement opportunities.
Lee rubin, metrics
This document summarizes how Lee Rubin, Senior Manager of Global Reference Programs at Citrix, uses metrics and data to strengthen Citrix's customer reference program and demonstrate its impact on revenue. It describes how Rubin began tracking metrics like asset utilization but realized he needed to directly link the reference program's activities to revenue figures. He launched a pilot program that showed how reference interactions at an event led to $1.5 million in closed sales. This convinced executives to increase funding. Rubin now tracks all interactions and assets in Salesforce to integrate metrics into executive dashboards, showing over $110 million in demonstrated sales influence in 2013. The program continues to optimize its use of data to close more deals faster.
Website 2018: Looking at the future of the law firm website.
The document discusses 5 emerging trends in law firm websites: 1) The death of practice areas in favor of focusing on emerging issues, 2) Advanced visitor tracking that provides actionable sales data, 3) Increased mobile usage requiring responsive design, 4) Websites becoming more sophisticated software requiring ongoing updates and maintenance, and 5) Enhanced attorney bios allowing more customization but requiring additional resources. The trends are presented to a panel for discussion on their potential benefits and challenges.
CFPB Consumer Complaints Report - Tableau
An Analysis of CFPB consumer complaints for the year 1990-2017. This was performed for an academic project for the module Data Visualization.
Technologies use - Tableau, Excel
BenchmarkIndex analysis -Final
The document analyzes the key performance measures of StartUp! Consulting Company based on a BenchmarkIndex analysis comparing it to 233 similar companies. There are issues in several key areas:
1. Financial performance is poor, with low and declining profit margins indicating strategic issues.
2. Customers are dissatisfied, shown by high complaint rates, and the company is struggling to attract new customers.
3. Staff issues include a high manager-to-worker ratio, high costs, low qualifications, and high turnover and absenteeism, reflecting poor management.
4. Investment in technology and innovation is very low compared to peers, risking the company falling behind. Overall the analysis finds serious strategic and operational problems
August Adtech Fallout Analysis
The document provides insights into trends in the affiliate marketing industry. It finds that Google Display Network continues to dominate the ad network landscape, while Tradedoubler has experienced impressive growth. Referral traffic has grown while display and email traffic have decreased for ecommerce sites. Amazon significantly cut commission rates for its affiliate program, with the biggest decreases in categories like home/garden and groceries. This has led to publishers uninstalling the program, with lifestyle seeing the biggest decline. Other affiliate networks like Tradedoubler and Adthink have benefited from an increase in traffic. Walmart is well positioned to take advantage as it expands its marketplace and launches a Prime competitor. [/SUMMARY]
Redspray ppt 2 mln
The document describes a presentation for a company called Redspray that is reinventing communication and social/business networking. It will introduce a new dimension to social networking and address problems with current platforms. The presentation will describe Redspray's solution, technology, team, marketing strategy, sales model, competition, milestones, and request for financing to test hypotheses.
Getting Digital Right
By delving deeply into customer experience, business process design and operating model change, organizations can more effectively move from 'doing' digital to 'being’ digital.
2012 B to B benchmark report
This document is a 2012 B2B marketing benchmark report from Optify that analyzes data from over 600 small and medium B2B websites. The report finds that organic search is the top traffic driver but has one of the lowest conversion rates, while email has the highest conversion rate. In general, it provides statistics on traffic sources, leads, pageviews, and conversion rates to help B2B marketers evaluate their performance.
Agency Food Barometer - 2016
This, the most recent Agency Food report
compiled by The Agency Works with the
highest level of response to the industry survey
we’ve had to date, gives a detailed insight into
Agencies in the Creative sector, looking at the
outlook and current perception of their trading
landscape in Q1 2016, versus Q1 2015.
agencyfoodbarometer
This report summarizes the results of a survey of UK creative agencies conducted in Q1 2016 by The Agency Works. It finds that while most agencies see their performance remaining stable or improving over the next quarter, increasing new business leads and recruiting talent remain key challenges. Compared to Q1 2015, more agencies cite talent recruitment, decreasing client budgets, and increased competition as difficulties. The report also analyzes differences between agencies focused on B2B versus consumer clients, finding they operate in different sectors and have varying financial models.
Foundation Capital Research: The E-Commerce Landscape
The document discusses the emerging landscape of e-commerce and outlines several trends:
1) Social media is becoming increasingly important for e-commerce, with over 50% of Facebook/Twitter users more likely to purchase from followed brands.
2) Mobile commerce is growing rapidly as smartphones and location-based services allow online purchases to translate into offline sales.
3) Daily deals and group buying sites like Groupon have helped bridge online and offline sales for local businesses by measuring customer acquisition.
A Simple Approach To Loyalty Programs...040111
The document describes a loyalty/rewards program called AdvantageCard that has tested two models - one with limited results, while the other increased customer spend by up to 120%. The key to making loyalty programs truly effective is described as being very simple, though the details are not provided. The program has led to increased customer spending, payments within terms, and cardholder numbers for participating businesses in Tasmania and Victoria.
Rise Broadband Final Deliverable
This document provides a marketing plan and data analysis for Rise Broadband to expand into the towns of Mackay and Arco, Idaho. The marketing plan includes a situation analysis of the target market and competitors in the area. It finds that the target market is older households without children and that Rise Broadband's main competitors are ATC and Frontier Communications. The plan also analyzes different marketing avenues and recommends a large budget approach including newspaper ads, direct mail, high school sports sponsorships, and local event participation. The data analysis section examines customer churn and sales data to build predictive models of what leads customers to cancel or keep service in order to inform marketing strategies.
The Incite Primer: The Evolution of Marketing and Communications in 2013
The first briefing for my new company, Incite.
In this document, we go into detail on three of the major foci for the marcomms professional in 2013:
1) How big data, social media, and customer-centricity will drive a merging of the marketing and communications department
2) How multi-channel is going to revolutionise marketing and communications - again
3) The growing primacy of 'customer-centric' strategy within large corporations
The Incite Primer: The Evolution of Marketing and Communications in 2013
The Incite Primer: The Evolution of Marketing and Communications in 2013Incite Marketing and Communications
This 20 page primer goes into detail on how large brands are evolving their approach to marketing and communications.
Download a full copy at www.bit.ly/IncitePrimer
We discuss:
1) The 4 Key Issues for 2013: Predictions for the development of your role
2) How big data, social media and customer-centricity will drive a merging of the marketing and communications departments
3) How ‘multi-channel’ is going to revolutionise marketing and communications. Again.
Have a look!Key differentiating characteristics of the offering jgj, inc. has
JGJ Inc. has created a line of 5 robotic products for upper middle class consumers, including a vacuum/mop, self-driving lawn mower, pet feeder, home security system, and personal assistant. All products connect to the personal assistant, allowing consumers to control devices with voice commands. The company believes these products will save customers 3.5 hours per day and increase demand as consumers realize the time savings outweigh costs. However, the COVID-19 pandemic has disrupted many business plans and income is projected to decrease in 2020 before rebounding in 2021.
2 Chapter 1 The Where, Why, and How of Data Collection Busines.docx
2 Chapter 1 | The Where, Why, and How of Data Collection
Business Statistics
A collection of procedures and techniques that are used to convert data into meaningful information in a business environment.
1.1
Chapter 18 provides an overview of business analytics and introduces you to Microsoft analytics software called Microsoft Power BI. People working in this field are referred to as “data scientists.” Doing an Internet search on data mining will yield a large number of sites that describe the field.
In today’s workplace, you can have an immediate competitive edge over other new employees, and even those with more experience, by applying statistical analysis skills to real-world decision making. The purpose of this text is to assist in your learning and to complement your instructor’s efforts in conveying how to apply a variety of important statistical procedures.
Cell phone companies such as Apple, Samsung, and LG maintain databases with information on production, quality, customer satisfaction, and much more. Amazon collects data on customers’ online purchases and uses the data to suggest additional items the customer may be interested in purchasing. Walmart collects and manages massive amounts of data related to the operation of its stores throughout the world. Its highly sophisticated database systems contain sales data, detailed customer data, employee satisfaction data, and much more. Governmental agencies amass extensive data on such things as unemployment, interest rates, incomes, and education. However, access to data is not limited to large companies. The relatively low cost of computer hard drives with massive data storage capacities makes it possible for small firms and even individuals to store vast amounts of data on desktop computers. But without some way to transform the data into useful information, the data these companies have gathered are of little value.
Transforming data into information is where business statistics comes in—the statistical procedures introduced in this text are those that are used to help transform data into information. This text focuses on the practical application of statistics; we do not develop the theory you would find in a mathematical statistics course. Will you need to use math in this course? Yes, but mainly the concepts covered in your college algebra course.
Statistics does have its own terminology. You will need to learn various terms that have special statistical meaning. You will also learn certain dos and don’ts related to statistics. But most importantly, you will learn specific methods to effectively convert data into information. Don’t try to memorize the concepts; rather, go to the next level of learning called understanding. Once you understand the underlying concepts, you will be able to think statistically.
Because data are the starting point for any statistical analysis, Chapter 1 is devoted to discussing various aspects of data, from how to collect data to the differen ...
CASE ANALYSIS ASSIGNMENTIntroduction The assig.docx
CASE ANALYSIS ASSIGNMENT
Introduction
The assignment is case 31.
The organization under review in the assignment is called Build-A-Bear-Workshop.
2
Financial Data Analysis- Horizontal analysis
According to According to Accounting Tools 2015, horizontal analysis is the comparison of historical financial information over a series of reporting periods, or of the ratios derived from this financial information. The intent is to see if any numbers are unusually high or low in comparison to the information for bracketing periods, which may then trigger a detailed investigation of the reason for the difference. The analysis is most commonly a simple grouping of information that is sorted by period, but the numbers in each succeeding period can also be expressed as a percentage of the amount in the baseline year, with the baseline
3
Income statement
The income statement reveals there is a huge difference between the year of 2008 and the following year 2009. The revenue between 2008 and 2009 shows a big decline in net retail sales, a decline over 15%.
4
Balance sheet- statement of financial position
The above statement reveals that the total assets have changed negatively over the last two years, and it was negative percent where it should have been positive if the company was succeeding. The statement points out the negative image that the company’s fixed assets are going down, in this case the company can’t expand and it shows their overall success is very poor at this time.
5
Key Success Factors
Build-A-Bear’s success was in the previous years, when they had record breaking profits, and was in top magazines. The income statements show they had some positive income from 2009 through 2010. They had adapted a great overall success when people entered into the stores. They have succeeded product segmentation, and had a different product that entered into the business world. They were able to capture a full on experience from picking out an animal to make, stuff it, name it, and even clothe it. This was the first company to offer an overall experience like this.
6
Market Data Analysis
In the beginning, Build-A-Bear workshop marketed their products for ages 3 to 12 years of age. This was their market segmentation, and it was working as profits were high. With very little competitors at the time, this workshop was in high demand, thus giving Build-A-Bear the competitive advantage.
7
SWOT-Strengths
-First real company into the market with unique product.
-Build-A-Bear name alone has a competitive advantage over other similar companies.
-Great management and customer appreciation, hands on environment.
-Great causes and charities for special occasions.
-Ranked no. 94 in Fortune ’s “100 Best Companies to Work For” list in 2009 and moved up to no. 80 in the 2010.
8
SWOT -Weaknesess
Lack of technology compared to similar stores.
-Kids are seeking more sophisticated entertainment . . . ...
1Q 2015 Journal.Final
James Avery jewelry sought to attract new customers with a new store prototype featuring digital signage. The signage tells the brand's story and highlights products in a dynamic way to engage customers. Pairs of video screens rotate messages about products and the brand's history and philosophy. This creates branded customer experiences that enhance approachability and visibility compared to static signage. The digital elements focus on connecting people to the brand through relevant experiences within different "shops" in the store highlighting products.
Contact Center Decisions July 2016
Unified Contact Center Reporting, July 2016 news letter on Contact Center Decisions. There's a place for Digital Signage, Dashboards, Desktops, and Mobile Reporting within the Contact Center environment, July's news letter covers the benefits of each method.
Solving the ten biggest hiring problems
Recruiters know they have issues, but sometimes don't have the right perspective to understand and solve them. This ebook sheds light on the most common issues and how to solve them.
2022 Vintage Roman Numerals Men Rings
Discover timeless style with the 2022 Vintage Roman Numerals Men's Ring. Crafted from premium stainless steel, this 6mm wide ring embodies elegance and durability. Perfect as a gift, it seamlessly blends classic Roman numeral detailing with modern sophistication, making it an ideal accessory for any occasion.
https://rb.gy/usj1a2
DearbornMusic-KatherineJasperFullSailUni
My powerpoint presentation for my Music Retail and Distribution class at Full Sail University
Weitere ähnliche Inhalte
Ähnlich wie How to Create KPIs WITHOUT Data?
Website 2018: Looking at the future of the law firm website.
The document discusses 5 emerging trends in law firm websites: 1) The death of practice areas in favor of focusing on emerging issues, 2) Advanced visitor tracking that provides actionable sales data, 3) Increased mobile usage requiring responsive design, 4) Websites becoming more sophisticated software requiring ongoing updates and maintenance, and 5) Enhanced attorney bios allowing more customization but requiring additional resources. The trends are presented to a panel for discussion on their potential benefits and challenges.
CFPB Consumer Complaints Report - Tableau
An Analysis of CFPB consumer complaints for the year 1990-2017. This was performed for an academic project for the module Data Visualization.
Technologies use - Tableau, Excel
BenchmarkIndex analysis -Final
The document analyzes the key performance measures of StartUp! Consulting Company based on a BenchmarkIndex analysis comparing it to 233 similar companies. There are issues in several key areas:
1. Financial performance is poor, with low and declining profit margins indicating strategic issues.
2. Customers are dissatisfied, shown by high complaint rates, and the company is struggling to attract new customers.
3. Staff issues include a high manager-to-worker ratio, high costs, low qualifications, and high turnover and absenteeism, reflecting poor management.
4. Investment in technology and innovation is very low compared to peers, risking the company falling behind. Overall the analysis finds serious strategic and operational problems
August Adtech Fallout Analysis
The document provides insights into trends in the affiliate marketing industry. It finds that Google Display Network continues to dominate the ad network landscape, while Tradedoubler has experienced impressive growth. Referral traffic has grown while display and email traffic have decreased for ecommerce sites. Amazon significantly cut commission rates for its affiliate program, with the biggest decreases in categories like home/garden and groceries. This has led to publishers uninstalling the program, with lifestyle seeing the biggest decline. Other affiliate networks like Tradedoubler and Adthink have benefited from an increase in traffic. Walmart is well positioned to take advantage as it expands its marketplace and launches a Prime competitor. [/SUMMARY]
Redspray ppt 2 mln
The document describes a presentation for a company called Redspray that is reinventing communication and social/business networking. It will introduce a new dimension to social networking and address problems with current platforms. The presentation will describe Redspray's solution, technology, team, marketing strategy, sales model, competition, milestones, and request for financing to test hypotheses.
Getting Digital Right
By delving deeply into customer experience, business process design and operating model change, organizations can more effectively move from 'doing' digital to 'being’ digital.
2012 B to B benchmark report
This document is a 2012 B2B marketing benchmark report from Optify that analyzes data from over 600 small and medium B2B websites. The report finds that organic search is the top traffic driver but has one of the lowest conversion rates, while email has the highest conversion rate. In general, it provides statistics on traffic sources, leads, pageviews, and conversion rates to help B2B marketers evaluate their performance.
Agency Food Barometer - 2016
This, the most recent Agency Food report
compiled by The Agency Works with the
highest level of response to the industry survey
we’ve had to date, gives a detailed insight into
Agencies in the Creative sector, looking at the
outlook and current perception of their trading
landscape in Q1 2016, versus Q1 2015.
agencyfoodbarometer
This report summarizes the results of a survey of UK creative agencies conducted in Q1 2016 by The Agency Works. It finds that while most agencies see their performance remaining stable or improving over the next quarter, increasing new business leads and recruiting talent remain key challenges. Compared to Q1 2015, more agencies cite talent recruitment, decreasing client budgets, and increased competition as difficulties. The report also analyzes differences between agencies focused on B2B versus consumer clients, finding they operate in different sectors and have varying financial models.
Foundation Capital Research: The E-Commerce Landscape
The document discusses the emerging landscape of e-commerce and outlines several trends:
1) Social media is becoming increasingly important for e-commerce, with over 50% of Facebook/Twitter users more likely to purchase from followed brands.
2) Mobile commerce is growing rapidly as smartphones and location-based services allow online purchases to translate into offline sales.
3) Daily deals and group buying sites like Groupon have helped bridge online and offline sales for local businesses by measuring customer acquisition.
A Simple Approach To Loyalty Programs...040111
The document describes a loyalty/rewards program called AdvantageCard that has tested two models - one with limited results, while the other increased customer spend by up to 120%. The key to making loyalty programs truly effective is described as being very simple, though the details are not provided. The program has led to increased customer spending, payments within terms, and cardholder numbers for participating businesses in Tasmania and Victoria.
Rise Broadband Final Deliverable
This document provides a marketing plan and data analysis for Rise Broadband to expand into the towns of Mackay and Arco, Idaho. The marketing plan includes a situation analysis of the target market and competitors in the area. It finds that the target market is older households without children and that Rise Broadband's main competitors are ATC and Frontier Communications. The plan also analyzes different marketing avenues and recommends a large budget approach including newspaper ads, direct mail, high school sports sponsorships, and local event participation. The data analysis section examines customer churn and sales data to build predictive models of what leads customers to cancel or keep service in order to inform marketing strategies.
The Incite Primer: The Evolution of Marketing and Communications in 2013
The first briefing for my new company, Incite.
In this document, we go into detail on three of the major foci for the marcomms professional in 2013:
1) How big data, social media, and customer-centricity will drive a merging of the marketing and communications department
2) How multi-channel is going to revolutionise marketing and communications - again
3) The growing primacy of 'customer-centric' strategy within large corporations
The Incite Primer: The Evolution of Marketing and Communications in 2013
The Incite Primer: The Evolution of Marketing and Communications in 2013Incite Marketing and Communications
This 20 page primer goes into detail on how large brands are evolving their approach to marketing and communications.
Download a full copy at www.bit.ly/IncitePrimer
We discuss:
1) The 4 Key Issues for 2013: Predictions for the development of your role
2) How big data, social media and customer-centricity will drive a merging of the marketing and communications departments
3) How ‘multi-channel’ is going to revolutionise marketing and communications. Again.
Have a look!Key differentiating characteristics of the offering jgj, inc. has
JGJ Inc. has created a line of 5 robotic products for upper middle class consumers, including a vacuum/mop, self-driving lawn mower, pet feeder, home security system, and personal assistant. All products connect to the personal assistant, allowing consumers to control devices with voice commands. The company believes these products will save customers 3.5 hours per day and increase demand as consumers realize the time savings outweigh costs. However, the COVID-19 pandemic has disrupted many business plans and income is projected to decrease in 2020 before rebounding in 2021.
2 Chapter 1 The Where, Why, and How of Data Collection Busines.docx
2 Chapter 1 | The Where, Why, and How of Data Collection
Business Statistics
A collection of procedures and techniques that are used to convert data into meaningful information in a business environment.
1.1
Chapter 18 provides an overview of business analytics and introduces you to Microsoft analytics software called Microsoft Power BI. People working in this field are referred to as “data scientists.” Doing an Internet search on data mining will yield a large number of sites that describe the field.
In today’s workplace, you can have an immediate competitive edge over other new employees, and even those with more experience, by applying statistical analysis skills to real-world decision making. The purpose of this text is to assist in your learning and to complement your instructor’s efforts in conveying how to apply a variety of important statistical procedures.
Cell phone companies such as Apple, Samsung, and LG maintain databases with information on production, quality, customer satisfaction, and much more. Amazon collects data on customers’ online purchases and uses the data to suggest additional items the customer may be interested in purchasing. Walmart collects and manages massive amounts of data related to the operation of its stores throughout the world. Its highly sophisticated database systems contain sales data, detailed customer data, employee satisfaction data, and much more. Governmental agencies amass extensive data on such things as unemployment, interest rates, incomes, and education. However, access to data is not limited to large companies. The relatively low cost of computer hard drives with massive data storage capacities makes it possible for small firms and even individuals to store vast amounts of data on desktop computers. But without some way to transform the data into useful information, the data these companies have gathered are of little value.
Transforming data into information is where business statistics comes in—the statistical procedures introduced in this text are those that are used to help transform data into information. This text focuses on the practical application of statistics; we do not develop the theory you would find in a mathematical statistics course. Will you need to use math in this course? Yes, but mainly the concepts covered in your college algebra course.
Statistics does have its own terminology. You will need to learn various terms that have special statistical meaning. You will also learn certain dos and don’ts related to statistics. But most importantly, you will learn specific methods to effectively convert data into information. Don’t try to memorize the concepts; rather, go to the next level of learning called understanding. Once you understand the underlying concepts, you will be able to think statistically.
Because data are the starting point for any statistical analysis, Chapter 1 is devoted to discussing various aspects of data, from how to collect data to the differen ...
CASE ANALYSIS ASSIGNMENTIntroduction The assig.docx
CASE ANALYSIS ASSIGNMENT
Introduction
The assignment is case 31.
The organization under review in the assignment is called Build-A-Bear-Workshop.
2
Financial Data Analysis- Horizontal analysis
According to According to Accounting Tools 2015, horizontal analysis is the comparison of historical financial information over a series of reporting periods, or of the ratios derived from this financial information. The intent is to see if any numbers are unusually high or low in comparison to the information for bracketing periods, which may then trigger a detailed investigation of the reason for the difference. The analysis is most commonly a simple grouping of information that is sorted by period, but the numbers in each succeeding period can also be expressed as a percentage of the amount in the baseline year, with the baseline
3
Income statement
The income statement reveals there is a huge difference between the year of 2008 and the following year 2009. The revenue between 2008 and 2009 shows a big decline in net retail sales, a decline over 15%.
4
Balance sheet- statement of financial position
The above statement reveals that the total assets have changed negatively over the last two years, and it was negative percent where it should have been positive if the company was succeeding. The statement points out the negative image that the company’s fixed assets are going down, in this case the company can’t expand and it shows their overall success is very poor at this time.
5
Key Success Factors
Build-A-Bear’s success was in the previous years, when they had record breaking profits, and was in top magazines. The income statements show they had some positive income from 2009 through 2010. They had adapted a great overall success when people entered into the stores. They have succeeded product segmentation, and had a different product that entered into the business world. They were able to capture a full on experience from picking out an animal to make, stuff it, name it, and even clothe it. This was the first company to offer an overall experience like this.
6
Market Data Analysis
In the beginning, Build-A-Bear workshop marketed their products for ages 3 to 12 years of age. This was their market segmentation, and it was working as profits were high. With very little competitors at the time, this workshop was in high demand, thus giving Build-A-Bear the competitive advantage.
7
SWOT-Strengths
-First real company into the market with unique product.
-Build-A-Bear name alone has a competitive advantage over other similar companies.
-Great management and customer appreciation, hands on environment.
-Great causes and charities for special occasions.
-Ranked no. 94 in Fortune ’s “100 Best Companies to Work For” list in 2009 and moved up to no. 80 in the 2010.
8
SWOT -Weaknesess
Lack of technology compared to similar stores.
-Kids are seeking more sophisticated entertainment . . . ...
1Q 2015 Journal.Final
James Avery jewelry sought to attract new customers with a new store prototype featuring digital signage. The signage tells the brand's story and highlights products in a dynamic way to engage customers. Pairs of video screens rotate messages about products and the brand's history and philosophy. This creates branded customer experiences that enhance approachability and visibility compared to static signage. The digital elements focus on connecting people to the brand through relevant experiences within different "shops" in the store highlighting products.
Contact Center Decisions July 2016
Unified Contact Center Reporting, July 2016 news letter on Contact Center Decisions. There's a place for Digital Signage, Dashboards, Desktops, and Mobile Reporting within the Contact Center environment, July's news letter covers the benefits of each method.
Solving the ten biggest hiring problems
Recruiters know they have issues, but sometimes don't have the right perspective to understand and solve them. This ebook sheds light on the most common issues and how to solve them.
Ähnlich wie How to Create KPIs WITHOUT Data? (20)
Website 2018: Looking at the future of the law firm website.
Website 2018: Looking at the future of the law firm website.
Foundation Capital Research: The E-Commerce Landscape
Foundation Capital Research: The E-Commerce Landscape
The Incite Primer: The Evolution of Marketing and Communications in 2013
The Incite Primer: The Evolution of Marketing and Communications in 2013
The Incite Primer: The Evolution of Marketing and Communications in 2013
The Incite Primer: The Evolution of Marketing and Communications in 2013
Key differentiating characteristics of the offering jgj, inc. has
Key differentiating characteristics of the offering jgj, inc. has
2 Chapter 1 The Where, Why, and How of Data Collection Busines.docx
2 Chapter 1 The Where, Why, and How of Data Collection Busines.docx
CASE ANALYSIS ASSIGNMENTIntroduction The assig.docx
CASE ANALYSIS ASSIGNMENTIntroduction The assig.docx
Kürzlich hochgeladen
2022 Vintage Roman Numerals Men Rings
Discover timeless style with the 2022 Vintage Roman Numerals Men's Ring. Crafted from premium stainless steel, this 6mm wide ring embodies elegance and durability. Perfect as a gift, it seamlessly blends classic Roman numeral detailing with modern sophistication, making it an ideal accessory for any occasion.
https://rb.gy/usj1a2
DearbornMusic-KatherineJasperFullSailUni
My powerpoint presentation for my Music Retail and Distribution class at Full Sail University
Innovative Uses of Revit in Urban Planning and Design
Discover innovative uses of Revit in urban planning and design, enhancing city landscapes with advanced architectural solutions. Understand how architectural firms are using Revit to transform how processes and outcomes within urban planning and design fields look. They are supplementing work and putting in value through speed and imagination that the architects and planners are placing into composing progressive urban areas that are not only colorful but also pragmatic.
Sustainable Logistics for Cost Reduction_ IPLTech Electric's Eco-Friendly Tra...
Sustainable Logistics for Cost Reduction_ IPLTech Electric's Eco-Friendly Transport Solution
一比一原版(QMUE毕业证书)英国爱丁堡玛格丽特女王大学毕业证文凭如何办理
永久可查学历认证【微信:A575476】【(QMUE毕业证书)英国爱丁堡玛格丽特女王大学毕业证成绩单Offer】【微信:A575476】(留信学历认证永久存档查询)采用学校原版纸张、特殊工艺完全按照原版一比一制作(包括:隐形水印,阴影底纹,钢印LOGO烫金烫银,LOGO烫金烫银复合重叠,文字图案浮雕,激光镭射,紫外荧光,温感,复印防伪)行业标杆!精益求精,诚心合作,真诚制作!多年品质 ,按需精细制作,24小时接单,全套进口原装设备,十五年致力于帮助留学生解决难题,业务范围有加拿大、英国、澳洲、韩国、美国、新加坡,新西兰等学历材料,包您满意。
【业务选择办理准则】
一、工作未确定,回国需先给父母、亲戚朋友看下文凭的情况,办理一份就读学校的毕业证【微信:A575476】文凭即可
二、回国进私企、外企、自己做生意的情况,这些单位是不查询毕业证真伪的,而且国内没有渠道去查询国外文凭的真假,也不需要提供真实教育部认证。鉴于此,办理一份毕业证【微信:A575476】即可
三、进国企,银行,事业单位,考公务员等等,这些单位是必需要提供真实教育部认证的,办理教育部认证所需资料众多且烦琐,所有材料您都必须提供原件,我们凭借丰富的经验,快捷的绿色通道帮您快速整合材料,让您少走弯路。
留信网认证的作用:
1:该专业认证可证明留学生真实身份
2:同时对留学生所学专业登记给予评定
3:国家专业人才认证中心颁发入库证书
4:这个认证书并且可以归档倒地方
5:凡事获得留信网入网的信息将会逐步更新到个人身份内,将在公安局网内查询个人身份证信息后,同步读取人才网入库信息
6:个人职称评审加20分
7:个人信誉贷款加10分
8:在国家人才网主办的国家网络招聘大会中纳入资料,供国家高端企业选择人才
→ 【关于价格问题(保证一手价格)
我们所定的价格是非常合理的,而且我们现在做得单子大多数都是代理和回头客户介绍的所以一般现在有新的单子 我给客户的都是第一手的代理价格,因为我想坦诚对待大家 不想跟大家在价格方面浪费时间
对于老客户或者被老客户介绍过来的朋友,我们都会适当给一些优惠。
选择实体注册公司办理,更放心,更安全!我们的承诺:可来公司面谈,可签订合同,会陪同客户一起到教育部认证窗口递交认证材料,客户在教育部官方认证查询网站查询到认证通过结果后付款,不成功不收费!
Best Competitive Marble Pricing in Dubai - ☎ 9928909666
Stone Art Hub offers the best competitive Marble Pricing in Dubai, ensuring affordability without compromising quality. With a wide range of exquisite marble options to choose from, you can enhance your spaces with elegance and sophistication. For inquiries or orders, contact us at ☎ 9928909666. Experience luxury at unbeatable prices.
Zodiac Signs and Food Preferences_ What Your Sign Says About Your Taste
Know what your zodiac sign says about your taste in food! Explore how the 12 zodiac signs influence your culinary preferences with insights from MyPandit. Dive into astrology and flavors!
Garments ERP Software in Bangladesh _ Pridesys IT Ltd.pdf
Pridesys Garments ERP is one of the leading ERP solution provider, especially for Garments industries which is integrated with
different modules that cover all the aspects of your Garments Business. This solution supports multi-currency and multi-location
based operations. It aims at keeping track of all the activities including receiving an order from buyer, costing of order, resource
planning, procurement of raw materials, production management, inventory management, import-export process, order
reconciliation process etc. It’s also integrated with other modules of Pridesys ERP including finance, accounts, HR, supply-chain etc.
With this automated solution you can easily track your business activities and entire operations of your garments manufacturing
proces
How to Buy an Engagement Ring.pcffbhfbfghfhptx
Dive into this presentation and learn about the ways in which you can buy an engagement ring. This guide will help you choose the perfect engagement rings for women.
Innovation Management Frameworks: Your Guide to Creativity & Innovation
Innovation Management Frameworks: Your Guide to Creativity & InnovationOperational Excellence Consulting
[To download this presentation, visit:
https://www.oeconsulting.com.sg/training-presentations]
This PowerPoint compilation offers a comprehensive overview of 20 leading innovation management frameworks and methodologies, selected for their broad applicability across various industries and organizational contexts. These frameworks are valuable resources for a wide range of users, including business professionals, educators, and consultants.
Each framework is presented with visually engaging diagrams and templates, ensuring the content is both informative and appealing. While this compilation is thorough, please note that the slides are intended as supplementary resources and may not be sufficient for standalone instructional purposes.
This compilation is ideal for anyone looking to enhance their understanding of innovation management and drive meaningful change within their organization. Whether you aim to improve product development processes, enhance customer experiences, or drive digital transformation, these frameworks offer valuable insights and tools to help you achieve your goals.
INCLUDED FRAMEWORKS/MODELS:
1. Stanford’s Design Thinking
2. IDEO’s Human-Centered Design
3. Strategyzer’s Business Model Innovation
4. Lean Startup Methodology
5. Agile Innovation Framework
6. Doblin’s Ten Types of Innovation
7. McKinsey’s Three Horizons of Growth
8. Customer Journey Map
9. Christensen’s Disruptive Innovation Theory
10. Blue Ocean Strategy
11. Strategyn’s Jobs-To-Be-Done (JTBD) Framework with Job Map
12. Design Sprint Framework
13. The Double Diamond
14. Lean Six Sigma DMAIC
15. TRIZ Problem-Solving Framework
16. Edward de Bono’s Six Thinking Hats
17. Stage-Gate Model
18. Toyota’s Six Steps of Kaizen
19. Microsoft’s Digital Transformation Framework
20. Design for Six Sigma (DFSS)
To download this presentation, visit:
https://www.oeconsulting.com.sg/training-presentationsPresentation by Herman Kienhuis (Curiosity VC) on Investing in AI for ABS Alu...
Presentation by Herman Kienhuis (Curiosity VC) on developments in AI, the venture capital investment landscape and Curiosity VC's approach to investing, at the alumni event of Amsterdam Business School (University of Amsterdam) on June 13, 2024 in Amsterdam.
Dpboss Matka Guessing Satta Matta Matka Kalyan Chart Indian Matka
Dpboss Matka Guessing Satta Matta Matka Kalyan Chart Indian Matka➒➌➎➏➑➐➋➑➐➐Dpboss Matka Guessing Satta Matka Kalyan Chart Indian Matka
9356872877Sattamatka.satta.matka.satta matka.kalyan weekly chart.kalyan chart.kalyan jodi chart.kalyan penal chart.kalyan today.kalyan open.fix satta.fix fix fix Satta matka nambar.Digital Transformation Frameworks: Driving Digital Excellence
[To download this presentation, visit:
https://www.oeconsulting.com.sg/training-presentations]
This presentation is a curated compilation of PowerPoint diagrams and templates designed to illustrate 20 different digital transformation frameworks and models. These frameworks are based on recent industry trends and best practices, ensuring that the content remains relevant and up-to-date.
Key highlights include Microsoft's Digital Transformation Framework, which focuses on driving innovation and efficiency, and McKinsey's Ten Guiding Principles, which provide strategic insights for successful digital transformation. Additionally, Forrester's framework emphasizes enhancing customer experiences and modernizing IT infrastructure, while IDC's MaturityScape helps assess and develop organizational digital maturity. MIT's framework explores cutting-edge strategies for achieving digital success.
These materials are perfect for enhancing your business or classroom presentations, offering visual aids to supplement your insights. Please note that while comprehensive, these slides are intended as supplementary resources and may not be complete for standalone instructional purposes.
Frameworks/Models included:
Microsoft’s Digital Transformation Framework
McKinsey’s Ten Guiding Principles of Digital Transformation
Forrester’s Digital Transformation Framework
IDC’s Digital Transformation MaturityScape
MIT’s Digital Transformation Framework
Gartner’s Digital Transformation Framework
Accenture’s Digital Strategy & Enterprise Frameworks
Deloitte’s Digital Industrial Transformation Framework
Capgemini’s Digital Transformation Framework
PwC’s Digital Transformation Framework
Cisco’s Digital Transformation Framework
Cognizant’s Digital Transformation Framework
DXC Technology’s Digital Transformation Framework
The BCG Strategy Palette
McKinsey’s Digital Transformation Framework
Digital Transformation Compass
Four Levels of Digital Maturity
Design Thinking Framework
Business Model Canvas
Customer Journey Map
Dpboss Matka Guessing Satta Matta Matka Kalyan panel Chart Indian Matka Dpbos...
Dpboss Matka Guessing Satta Matta Matka Kalyan panel Chart Indian Matka Dpbos...➒➌➎➏➑➐➋➑➐➐Dpboss Matka Guessing Satta Matka Kalyan Chart Indian Matka
Sattamatka.satta.matka.satta matka.kalyan weekly chart.kalyan chart.kalyan jodi chart.kalyan penal chart.kalyan today.kalyan open.fix satta.fix fix fix Satta matka nambarNIMA2024 | De toegevoegde waarde van DEI en ESG in campagnes | Nathalie Lam |...
Nathalie zal delen hoe DEI en ESG een fundamentele rol kunnen spelen in je merkstrategie en je de juiste aansluiting kan creëren met je doelgroep. Door middel van voorbeelden en simpele handvatten toont ze hoe dit in jouw organisatie toegepast kan worden.
Dpboss Matka Guessing Satta Matta Matka Kalyan Chart Satta Matka
Dpboss Matka Guessing Satta Matta Matka Kalyan Chart Satta Matka➒➌➎➏➑➐➋➑➐➐Dpboss Matka Guessing Satta Matka Kalyan Chart Indian Matka
Dpboss Matka Guessing Satta Matta Matka Kalyan Chart Indian Matka Indian satta Matka Dpboss Matka Kalyan Chart Matka Boss otg matka Guessing Satta Industrial Tech SW: Category Renewal and Creation
Every industrial revolution has created a new set of categories and a new set of players.
Multiple new technologies have emerged, but Samsara and C3.ai are only two companies which have gone public so far.
Manufacturing startups constitute the largest pipeline share of unicorns and IPO candidates in the SF Bay Area, and software startups dominate in Germany.
Kürzlich hochgeladen (20)
Innovative Uses of Revit in Urban Planning and Design
Innovative Uses of Revit in Urban Planning and Design
Sustainable Logistics for Cost Reduction_ IPLTech Electric's Eco-Friendly Tra...
Sustainable Logistics for Cost Reduction_ IPLTech Electric's Eco-Friendly Tra...
Best Competitive Marble Pricing in Dubai - ☎ 9928909666
Best Competitive Marble Pricing in Dubai - ☎ 9928909666
Zodiac Signs and Food Preferences_ What Your Sign Says About Your Taste
Zodiac Signs and Food Preferences_ What Your Sign Says About Your Taste
Garments ERP Software in Bangladesh _ Pridesys IT Ltd.pdf
Garments ERP Software in Bangladesh _ Pridesys IT Ltd.pdf
Innovation Management Frameworks: Your Guide to Creativity & Innovation
Innovation Management Frameworks: Your Guide to Creativity & Innovation
Presentation by Herman Kienhuis (Curiosity VC) on Investing in AI for ABS Alu...
Presentation by Herman Kienhuis (Curiosity VC) on Investing in AI for ABS Alu...
Dpboss Matka Guessing Satta Matta Matka Kalyan Chart Indian Matka
Dpboss Matka Guessing Satta Matta Matka Kalyan Chart Indian Matka
Digital Transformation Frameworks: Driving Digital Excellence
Digital Transformation Frameworks: Driving Digital Excellence
Dpboss Matka Guessing Satta Matta Matka Kalyan panel Chart Indian Matka Dpbos...
Dpboss Matka Guessing Satta Matta Matka Kalyan panel Chart Indian Matka Dpbos...
NIMA2024 | De toegevoegde waarde van DEI en ESG in campagnes | Nathalie Lam |...
NIMA2024 | De toegevoegde waarde van DEI en ESG in campagnes | Nathalie Lam |...
Dpboss Matka Guessing Satta Matta Matka Kalyan Chart Satta Matka
Dpboss Matka Guessing Satta Matta Matka Kalyan Chart Satta Matka
How to Create KPIs WITHOUT Data?
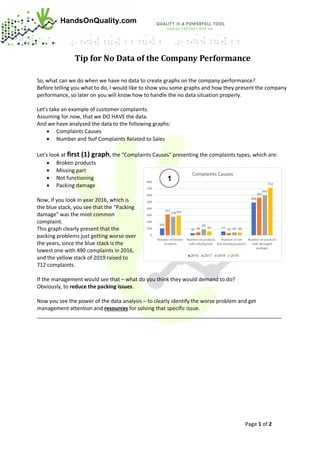
- 1. Page 1 of 2 HandsOnQuality.com Tip for No Data of the Company Performance So, what can we do when we have no data to create graphs on the company performance? Before telling you what to do, I would like to show you some graphs and how they present the company performance, so later on you will know how to handle the no data situation properly. Let's take an example of customer complaints. Assuming for now, that we DO HAVE the data. And we have analyzed the data to the following graphs: • Complaints Causes • Number and %of Complaints Related to Sales Let's look at first (1) graph, the "Complaints Causes" presenting the complaints types, which are: • Broken products • Missing part • Not functioning • Packing damage Now, if you look in year 2016, which is the blue stack, you see that the "Packing damage" was the most common complaint. This graph clearly present that the packing problems just getting worse over the years, since the blue stack is the lowest one with 490 complaints in 2016, and the yellow stack of 2019 raised to 712 complaints. If the management would see that – what do you think they would demand to do? Obviously, to reduce the packing issues. Now you see the power of the data analysis – to clearly identify the worse problem and get management attention and resources for solving that specific issue. ___________________________________________________________________________________ 1
- 2. Page 2 of 2 HandsOnQuality.com Now to the second (2) graph, the "Number and %of Complaints Related to Sales" graph. In this graph you can see the percentage of complaints in relation to the number of sales that year. So, in 2017 we have 13% complaints and in 2019 only 7%, which is great, but this graph does not reveal a major problem! ___________________________________________________________________________________ Which you can see in the third (3) graph, the complaints cost is raising – which is the red line with the cost of the complaints in US$. Now we learned that when analyzing data, we must look in several angels to reveal the problems. _____________________________________________________________________________________ OK, we done with reviewing how to conclude the company performance from the graphs. So, now you understand the power of data analysis (graphs). And now to the big question; What do you do without any data? Or with inaccurate data? For More: http://www.handsonquality.com/clear-practical/quality-saves-money/ 2 3