Social Media Analysis Report - Videocon
•
5 gefällt mir•6,586 views

Purpose of this Report 1. What customers are talking about Videocon brand on social media? 2. Are customers satisfied with the brand? 3. Which segment of Videocon is more prominent on social media? 4. What are key drivers of Customer Dissatisfaction about Videocon products? 5. How is the social media presence of Videocon brand compared to its competitors? 6. How competitors are engaging with their customers on social media?

Empfohlen
Weitere ähnliche Inhalte
Was ist angesagt?
Was ist angesagt? (20)
Andere mochten auch
Ähnlich wie Social Media Analysis Report - Videocon
Ähnlich wie Social Media Analysis Report - Videocon (20)
Mehr von Simplify360
Mehr von Simplify360 (20)
Kürzlich hochgeladen
Kürzlich hochgeladen (20)
Social Media Analysis Report - Videocon
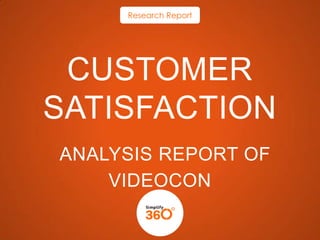
- 1. Research Report CUSTOMER SATISFACTION ANALYSIS REPORT OF VIDEOCON
- 2. PURPOSE OF THE REPORT What customers are talking about Videocon brand on social media? What are key drivers of Customer Dissatisfaction about Videocon products? Are customers satisfied with the brand? Which segment of Videocon is more prominent on social media? How is the social media presence of Videocon brand compared to its competitors? How competitors are engaging with their customers on social media?
- 3. APPROACH: SIMPLIFY360 PROVIDES Various Dimensions of Analysis BRAND ANALYSIS Videocon Videocon Vs Competitors (Metrics Comparison) Association Cloud Share of Voice Trend Analysis CHANNEL ANALYTICS Sentiment Analysis Sentiment Analysis
- 4. Association Cloud : Conversation In Social Media Space & Classified (Customer Satisfaction) Dish washer Association Cloud Trend Analysis Sentiment Analysis Granular Analysis • The raw conversations from social media are analyzed and segmented for providing better insights
- 5. MOST OF THE CONVERSATIONS ON Videocon WERE AROUND CUSTOMER SERVICES ISSUES Conversations peaked due to increased number of complaints on Videocon Washing Machine 7 6 5 4 3 2 1 0 17-Oct Association Cloud Trend Analysis Sentiment Analysis Granular Analysis 18-Oct 19-Oct 20-Oct 21-Oct 22-Oct 23-Oct 24-Oct 25-Oct 26-Oct 27-Oct 28-Oct 29-Oct 30-Oct Most of the conversations on Videocon were around customer service issues, functionality, price and sharing of customers experience with the similar products. In general, people were using social media platforms for resolving their queries/complaints and to recommend/detract others purchase decisions. Dis-satisfied customer can be disastrous for a brand, since he/she detracts others not to purchase any product of that particular brand and the other being he/she will avoid purchasing any further products of that brand
- 6. DTH is the most talked about Consum er Electroni cs & Home applianc es, 16% DTH, 41% Mobile Handsets , 19% Telecom, 34% DTH 2078 Telecom Mobile Handsets Consumer Electronics & Home appliances 1757 990 807
- 7. Videocon has 5 percent net sentiment score signifying a higher extent of customer dis-satisfaction COMPLAINTS CONSTITUTE A CONSIDERABLE PIE OF OVERALL CONVERSATIONS 28.08% Positive 48.88% Negative Neutral Association Cloud Trend Analysis Sentiment Analysis Granular Analysis 23.04%
- 8. DTH and consumer electronics receive the most number of complaints DTH Telecom Phone Consumer Electronics 716 731 233 1095 194 Negative 429 507 250 283 352 Neutral 631 Positive 205
- 9. TV SEGMENT HAS HIGHER NUMBER OF NEGATIVE COMPLAINTS in consumer electronics CUSTOMER SERVICE ISSUES DOMINATED COMPARED TO THE OTHER TYPES OF ISSUES SENTIMENT ANALYSIS NEGATIVE SENTIMENT: SEGMENT TV Washing Machine 79% 16% Fridge 14% 5% AC 5% 60% NEGATIVE SENTIMENT: TYPE 26% Customer… Positive Association Cloud Trend Analysis Sentiment Analysis Negative 56% Functionality 39% Accessories 3% Price 3% Granular Analysis
- 10. Issues around Customer service and Functionality of Videocon products were major cause of customer dis-satisfaction NEGATIVE SENTIMENT: SEGMENT • 80% of conversations on Videocon 15 % TV Washing machine 16 % Fridge 79 % 14 % 80 % 5% AC 5% Positive Association Cloud Trend Analysis Sentiment Analysis Granular Analysis Negative Neutral Most of the conversations on Videocon were around its TV segment followed by washing machine, Fridge and AC segments. Overall, Customer service issues, Functionality issues led the overall negative sentiment of Videocon. Deals and Technological aspects of the Videocon products led its positive sentiment accounted on TV. Among those conversations, 79% were negative. The key areas of customer dis-satisfaction are: • Customer Service was the major area which disappointed most of the customers followed by delivery. • Deals, Better Technology of Videocon washing machines led its positive Sentiment.
- 12. Source: Simplify360 8% 24% 31% 37% BUZZ SHARE OF BRANDS 12
- 13. Appliances wise share of buzz 56% TELEVISION 5% 5% 20% 13% MOBILE HANDSETS REFRIGIRATORS AC WASHING MACHINE Source: Simplify360 13
- 14. Videocon WHIRLPOOL BLUESTAR ANALYSIS ON SOCIAL MEDIA ENGAGEMENT
- 15. Videocon has PRESENCE IN MOST OF THE SOCIAL MEDIA PLATFORMS, SOCIAL MEDIA ENGAGEMENT OF Videocon IS above ITS COMPETITORS SOCIAL MEDIA PRESENCE Brand Name FACEBOOK TWITTER GOOGLE+ LINKEDIN YOUTUBE YES YES NO NO YES VIDEOCON IFB YES YES NO YES YES WHIRLPOOL YES YES NO YES YES BLUE STAR YES NO NO NO YES ANALYSIS ON SOCIAL MEDIA POPULARITY OF APPLIANCES BRANDS ON SOCIAL MEDIA PLATFORMS BRAND NAME FACEBOOK TWITTER GOOGLE+ PAGE FANS FOLLOWERS FOLLOWERS VIDEOCON 3,24,110 499 N/A IFB 244 106 N/A WHIRLPOOL 950 120 N/A BLUE STAR 29,406 N/A N/A
- 16. Social media provides an immense opportunity Consumers asks for friends suggestion before making purchases
- 17. THANK YOU CONNECT WITH US