SlideShare ist ein Scribd-Unternehmen logo
1 von 64
ABSTRACT
Analysts use ratios to predict financial variables and to evaluate relative performance. They
group ratios into liquidity and profitability category to forecast bankruptcy, the probability of
loan defaults and stock prices. Relative performance evaluation assumes comparing a company's
performance to that of a chosen industry or benchmark ratio filters out the performance effects of
common uncertainties, leaving only company-specific performance. In such evaluations, other
companies' performance provides information about a specific company's performance. Ratio
analysis is used primarily to compare a company’s financial results over a period of time. A
method sometimes called trend analysis. Trend analysis can also show how a company’s ratio
stock up against. Those of other business both within and outside. The industry ratios allow for
comparison below companies, below industries, below time periods for a single company of its
industry. Ratio analysis methods used by every company and it is essential to know the
fluctuations in Assets and Liabilities
1
INTRODUCTION
Ratio Analysis is uses on amalgamation of financial (or) operating data from a company (or)
operating data from a company (or) industry to provide a basis for comparison. Every ratio
measures a unique association that may have an impact or other ratios.
In accounts a financial ratio, accounting ratio is used to evaluate the overall financial conditions
of a company or other organizations. Company owners, stock holders (or) potential investors use
ratio analysis viability- liabilities and future performance.
A company owner should continuously evaluate the performance of the company by comparing
its historical figures with those for industry competitiveness and even with therefore successful
business in other industries. However an owner needs to look at more than easily attainable
numbers such as Sales, Profits, and Total Assets. Ratio analysis needs to be used to read below
the lines of financial statements and make senses of numbers. This will allow the owner to
identify and quantify the company’s strength and weaknesses, evaluate its financial position and
understand the risks it may be focusing.
For private and institutional investors, ratios are important profit tools in financial analysis.
Although ratios report mostly presents on past performance. They can be predicated too, and can
provide indications of potential problems areas.
2
OBJECTIVES OF THE STUDY
1. To measure the overall financial position of firm.
2. To know the nature of fixed and current assets.
3. To analyze the company liquidity position.
4. To elicit effectiveness of the firm in using available resources with activity ratios.
5. To seek aspects like leverage and profitability of company.
6. To provide measures for enriching the performance of the company.
3
NEED FOR THE STUDY
The study has great significance and will provide benefits to various parties, directly or indirectly
interact with the company .It is apparent to benefitize employees and offer motivation, impacting
there contribution for the company’s growth.
It is beneficial to the management of the company as it provides a clear cut picture with regard to
the LIQUIDITY, PROFITABILITY, LEVERAGE, and ACTIVITY RATIO.
4
IMPORTANCE OF THE STUDY
Mainly the persons interested in the analysis of the financial statements can be grouped under
three heads (i) Owners or investors, (ii) Creditors and (iii) Financial executives. The importance
of analysis varies materially with the purpose for which it is calculated. The primary information
which seeks to be obtained from these statements differs considerable reflecting the purpose that
the statement is to serve.
The significance of these ratios varies for these three groups as their purpose differs widely.
These investors are mainly concerned with the earning capacity of the company whereas the
creditors including bankers and financial institutions are interesting in knowing the ability of
enterprise to meet its financial obligations timely. The financial executives are concerned with
evolving analytical tools that will measure and compare costs, efficiency, liquidity and
profitability with a view to making intelligent decisions.
1. A useful tool in the hands of forecaster
2. Inter-Firm comparison:
3. Trend Analysis:
Thus ratio analysis plays a very important role in the interpretation of the financial statements
correctly and to make the figures comparable and more meaningful.
5
SCOPE OF THE STUDY
The study continuous pivotally on financial performance of the selected company. It helps to
estimate the company’s current financial position. In addition to this various financial aspects
can also be learned in observational studies. It also reflects categories of ratios towards firm
prospectus in their monetary paradigms.
6
RESEARCH METHODOLOGY & DATABASE
Research and experimental development is formal work undertaken systematically to increase
the stock of knowledge, including knowledge of humanity, culture and society, and the use of
this stock of knowledge to devise new applications standard practice for surveys on research and
experimental development, It is used to establish or confirm facts, reaffirm the results of
previous work, solve new or existing problems, support theorems, or develop new theories. A
research project may also be an expansion on past work in the field. To test the validity of
instruments, procedures, or experiments, research may replicate elements of prior projects, or the
project as a whole. The primary purposes of basic research (as opposed to applied research) are
documentation, discovery, interpretation, or the research and development of methods and
systems for the advancement of human knowledge. Approaches to research depend on
epistemologies, which vary considerably both within and between humanities and sciences.
Scientific research relies on the application of the scientific method. This research provides
scientific information and theories for the explanation of the nature and the properties of the
world. It makes practical applications possible. Scientific research is funded by public
authorities, by charitable organizations and by private groups, including many companies.
Scientific research can be subdivided into different classifications according to their academic
and application disciplines. Scientific research is a widely used criterion for judging the standing
of an academic institution, such as business schools, but some argue that such is an inaccurate
assessment of the institution.
Research in the humanities involves different methods such as for example hermeneutics and
semiotics, and a different, more relativist epistemology. Humanities scholars usually do not
search for the ultimate correct answer to a question, but instead explore the issues and details that
surround it. Context is always important, and context can be social, historical, political, cultural
7
or ethnic. An example of research in the humanities is historical research, which is embodied in
historical method. Historians use primary sources and other evidence to systematically
investigate a topic, and then to write histories in the form of accounts of the past.
Artistic research, also seen as 'practice-based research', can take form when creative works are
considered both the research and the object of research itself. It is the debatable body of thought
which offers an alternative to purely scientific methods in research in its search for knowledge
and truth.
Types of Data :
A data type, in programming, is a classification that specifies which type of value a variable has
and what type of mathematical, relational or logical operations can be applied to it without
causing an error. A string, for example, is a data type that is used to classify text and an integer is
a data type used to classify whole numbers.
Primary Source:
Most of the data collect from discussions with various officials in finance department and other
officers of other departments.
Secondary Source:
Most of the calculations are made on the financial statements of the company and the company
provided financial statements for five years. Some of the information regarding the theoretical
aspects was collected by referring standard textbooks and reference books On the basis of data
from the annual reports, brochures, and prospectus for public issue and on the various financial
ratios are calculated. The values are compared with desired levels of standard ratios to identify
financial position and performance.
Sources of Data:
The data relating to financial statement of Sujala Pipes Pvt Ltd and the information is obtained
with the cooperation of management
8
LIMITATIONS OF THE STUDY
1. The price level change makes the interpretation of ratios invalid.
2. Ratio analysis has impact of inflation.
3. The period of the study is limited.
4. The study is only on ratio analysis which is a tool of financial analysis so, it is not
possible to assess the company’s performance based on only this results.
5. Though employees are good co-operative as well as cordial they are unable to spend their
valuable time, as they are very busy with their work.
9
COMPANY PROFILE
Origin Rayalaseema, economically backward part of the Andhra Pradesh (state) has been
identified for-rapid industrialization. To boost up the economic level of the region, i.e., Nandyal
town in Rayalaseema was industrially indentified scope of development for dynamic
entrepreneurship. The Legendary personality Sri S.P.Y. Reddy was a Mechanical Engineer from
Farmers family. He started unit at Nandyal driving primarily in manufacturing black pipes since
1977, his determination and hard work has helped him in overcoming conundrums in the initial
years, with the financial assistance by the local commercial banks.
Later he extended manufacturing unit further to a Private Limited Company called SujalaPipes
Private Limited; He is acted as Managing Director and group promoter as well. He got financial
assistance and institutional assistance which motivated him to setup this firm sustainably and for
successful future. With a great hope and expectations he gladiate produces PVC Pipes for
improving the water transport system.
Nandi pipes are famous all over country stand and for testimony to zeal Perseverance and Hard
Work and for ‘sighted vision’ of the one individual. The founder is eminent technoi entrepreneur
possessing dynamic mechanical knowledge He left his plum job at bar to bring dynamism and
energy and aspirations started manufacturing of LDPE pipes and later switched to PVC
achieving incomparable success. SujalaPipes Private Ltd is the manufacturing of the largest and
most comprehensive range of PVC pipes in India.
Quality Policy / Processes:
We use ISO 9002 quality systems to maintain unsurpassed quality of our entire production.
Year of Establishment: 1979.
10
Nature of Business: Manufacturer, Exporter
Major markets: Indian subcontinent
GROWTH AND DEVELOPMENT OF THE ORGANIZATION:
The Sujala pipes private limited has excellent growth record from 1977 onwards
From this year onwards they have started in different regions.
‱ 1977- Nandyal region (polythene pipes)
‱ 1984-1985-PVC pipes Rayalaseema region
‱ 1985-1987-Rayalaseema, Telengana region
‱ 1987-1988-Andhra and Karnataka States
‱ 1989-1990-Andhra Tamilnadu and Karnataka states
‱ 1990-1992-Andhra, Kerala and Karnataka states
From this year onwards they have started to introduce their pipes in Orrisa, Utteranchal, and
Chattisghad etc.
HEAD OF THE DEPARTMENTS:
‱ Finance Manager: T.Maruthi Venkateshwar Rao
‱ Sales Manager: K.Satya.Reddy
‱ Human Resource Manager: G.Krishna Mohan
‱ Marketing Manager: K. Satya Reddy
11
PRODUCTS:
1) Agricultural pipes.
2) Blue casing & Submersible pipes.
3) Electrical pipes.
4) Plumbing pipes.
5) Ring fit pipes.
6) Solvent cements.
7) Suction & garden pipes.
8) Swr pipes.
9) Water tanks.
Esteemed customers:
Nandi pipes are proud to present list of customers which is includes big water pipe line projects,
dot projects panchayitiraj and industrial development corporation, Etc., Satya sai water schemes,
Lorhen projects ,NABARD Water schemes, Karnataka land army department and also we take
turkey projects for pipeline.
Size:
Various sizes ranging from œ” to 10” are offered to customers. But for the purpose of cubic
space utilization in trucks while transport organization is adopting the technique like pipe in
pipe.
Payment period:
12
The company adopts zero credit policy and goods are not delivered unless cash remittance is
made. The same policy is also applicable to authorized dealers of Sujala Pipes Pvt Ltd.
CHANNELS OF DISTRIBTION:
Sujala Pipes Pvt Ltd has gat zero level and single level channel distribution.
Sujala Pipes Pvt. Ltd. has an extensive network of 350 dealers in Andhra Pradesh and who are
directly by company sales force and 620 dealers in south India.
COVERAGE:
At Present Andhra Pradesh, part of Southern States of Karnataka, Thailand and Kerala are in
ambit of Sujala Pipes Pvt. Ltd.
TRANSPORT:
Transport vehicles of Sujala Pipes Pvt., outnumbers the fleet of the competitors vehicles. This
unique strength of the organization enables the delivery system to efficient. This event helps the
dealers to reduce inventory levels to the minimum. Thus dealers are also supplemented with the
benefit of their lower paid up capital in the form of inventory.
FUNCTIONAL DEPARTMENT OF THE COMPANY:
Financial Department:
Though initially the company approached the external sources for financial aid, now the financial
status of the company is very sound and is being run only with self finance except the loan taken
on hypothecation of machinery and stock from SBI Nandyal and karur Vysya bank, Nandyal.
MANUFACTURER CONSUMER
MANUFACTURER DEALER CONSUMER
13
The financial Department is headed by the financial manager with the help of four Accounts and
other Clerk of the department. The company follows cash& carries policy. The product is not
delivered until the cash is paid and these transactions are look after financial department with the
help of marketing department.
Marketing Department:
Executive Director heads marketing Department. Marketing Manger is in charge of all the
operations who reports to executive Director. Marketing Manager and 35 Sales Representatives
are under immediate control of Executive Director. There are also 20 salesmen who to report to
the representatives above them.
Personnel Department:
The personal department consists the details of the Executive and workers of the organization.
The organization is formed with S.P.Y. Reddy. The General Manager and Executive Director
who reports to Managing Director. Two Marketing Manager, Financial manager, Public
Relations officer and quality Control Officer who all reports to Executive director. Other than the
Executives there qre1500 workers in the organization. Panel consisting of Managing Director,
Executive Director, General Manager and Managers of concerned department makes the
recruitment and selection. Apart from the attractive salaries company provides meals and health
care facilities.
Purchasing Department
The perplexing situation that is confined by the manufacturers of the PVC Pipes is scarcity of
resin. Though the government of India has taken various steps to improve supply conditions of
PVC resin, the Indian manufacturers could meet only 50% of demand and remaining 50% is met
from imports.
14
Human resource policies and practices:
The following are highlights of H.R policies and practices. Effective utilization of man power,
‱ To provide good working condition.
‱ To promote industrial development.
NANDI PIPES:
Nandi has its origin in the year 1979 when Mr.S.P.Y Reddy a technocrat left his job at Bhaba
atomic research center, Mumbai to start plastic containers unit in Nandyal and his unit has grown
into conglomerate of 15 companies with combined annual turn over $75 million. Nandi group is
lead by Mr.S.P.Y.Reddy. The founder of company and had been witnessing annual growth of
20% for the past 5years. Mr.Reddy who sensed and opportunity in making pipes for irrigation
sated manufacture of PVC pipes in year 1984 and has fast become leading manufacturer in A.P
and a leading producer in India with annual production of 5000 tones of pipes. Their other
business includes dairy products, education, water storage container, flexible houses, and HDPE
pipes.
The group is privately owned. The group has manufacturing plant in 5 locations in South India to
improve operations efficiency and to enhance customer satisfaction. Nandi group sells PVC
pipes under 4 brands of which nandi brand is the most prominent. The group constantly updates
its products, machinery to reflect of venturing only into branded products to ensure the stability
and steady growth. Nandi pipes is brand name of popular PVC pipes mode by two companies,
Sujala Pipes and Rani Pipes. They made possible few other ventures pipes are sol under brand
names NANDI, RANI, and JALA together they are highest selling PVC pipe brand in South
India and will be among top 3 in India. Pipes are made in two varieties, self-socketing and ring
fit. Pipes are also made to suit various pressure and impacts requirements are even custom made
to meet special requirements.
15
The usage of PVC pipes as replacement for traditional materials in the field of construction is
one rise in India and that bodes well for future of business for Nandi group the whole range of
products meet all the relevant national and international standards and are produced in ISO 9000
certified manufacturing facilities.
Nandi rigid PVC pipes with their good quality. Free service, during and economical uses are
better choice then mild steel, galvanized steel cost iron and plastic pipes.
BENEFITS OF NANDI RIGID PVC PIPES:
Economy:
Being cheaper the conventional cement and steel pipes, Nandi rigid PVC pipes are very
economical.
Light weight:
PVC pipes are 1/6 of the weight of steel pipes. This makes them easy to carry and install, doing
way with heavy material handling equipment. This reduces labour cost as well as the process of
installation is faster.
Rugged and Durable:
Manufacture of the best PVC material. Nandi rigid PVC pipes do not rest are not affected by
most chemical hence they last longer. Render trouble free services and require less maintenance.
More Flow:
Fractional lopes in Nandi rigid pipes are 40% lower than conventional pipes hence there is
approximately 25% more flow than that of competitor.
ITL pipes:
“UBTEGRANTED THERMOPLASTICS LIMITED” incorporated in the state of A.P as
“TORRENT THERMOPLASTICS LIMIT on 25th
Jan 1994 PVC LTd” under the companies Act
1956 and thereafter converted into a public Ltd company on 25th
may 1994 in terms of the
special resolution dated: 28th
Jan 1994 under sec 31(1)44 of the companies Act 195.
16
The name of the company was changed to “INTEGRATED THERMOPLASTIC LIMITED” as
per fresh certificate of incorporation dated 5th
Aug 1994. The company has been formed the main
objective of manufacturing and dealing in the thermoplastics and allied products. Nandi pipes
took it over in 1999.
Products:
The ITL manufactures the following products High density polyethylene pipes
‱ Polypropylene pipes.
‱ Polyvinyl chloride pipes.
‱ Chlorinated polyvinyl chloride pipes.
MONARCH PIPES:
“MONARCH PIPES LIMITED” was incorporated in the year 1986. the factory is suited at NH-
7H, Humpapuram village, Rapthadu Mandal, Anantapur (Distric)t. It was taken over by Nandi
pipes. Its annual production capacity is 16000 meters, and it is one of the leading manufacturers
of PVC pipes in South India. The company equipped with technical collaboration from batter
field of West Germany. It has made possible few other small ventures Pipes and sold under
brand names MONARCH, KOHINOOR, and KRISHNA Monarch pipes with their good quality
trouble free service, durability and economical use are a better choice than mild steel, galvanized
steel, cost iron and plastic pipes. The company is managed by term of professional under the
guidance of a young experienced and well-qualified Dynamic Managing Director Mr. Sridhar
Reddy.
APPLICATIONS OF PVC PIPES:
‱ Agriculture and Irrigation Schemes.
‱ Rural & urban water supply schemes.
‱ Tubes well casing.
‱ Gas and oil supply ones.
17
‱ Industrial effluent disposal.
‱ Sewage and drainage schemes.
‱ Air condition ducting.
‱ Building installation.
‱ Industrial ducting.
STRATEGY:
Nandi pipes which re famous all over the A.P “To provide world class quality and customized
product development support. They enjoy the satisfaction of million of customers.
QUALITY POLICY:
‱ They shall provide products & services that meet started standard every time.
‱ They will organize their work practices to do a job right, first time every time.
‱ They are committed to continue this improvement in the quality in all business process.
SYSTEM:
The flow of activities in the daily operations of business including its core process and its
support system.
Purchase System:
Company purchases its raw materials from other states like Gujarat, Maharashtra and Orissa.
Other countries like Srilanka and Thailand.
Production System:
The work is fully automatic manufacturing lay out with world-class batten field extrusion plant
Sujala pipes Pvt. Ltd. have 3 units in A.P operating in Nandyal, Hyderabad and Anantapur.
18
Finance System:
Sujala pipes Pvt. Ltd follows two types of finance system they are
‱ Operational finance system
‱ Corporate finance system
Marketing System:
Sujala pipes pvt Ltd. Is following a variety of marketing strategies like hoardings advertisement
through television, paints etc for promotion of the products.
TRANSPORTATION OF FINISHED GOODS
Sujala pipes pvt. Ltd mainly depends on road for transportation of finished goods.
CORE PROCESS:
Product development is mainly based on consumer feedback.
DEMAND MANAGEMENT:
Company estimates its product demand in market by past sales. This is helpful for future
production of products and increase of man power for increased productivity.
ORDER FULFILMENT:
Customers can directly visit the company for the pipes or they can get through the dealers
required number of goods. if any customer who make bulk order (100 pipes) company provides
free transportation facilities with in 10 days the pipes will distributed to customers,
The chain is in two ways
Producer Dealers Customer
19
Producer Customers
SKILLS:
Organization’s dominants capability and competency.
INDUSTRIAL CONCEPT OF COMPETETION:
Higher market share of the company in comparison to its competitors. In A.P. Sujala Pipes Pvt.
Ltd. Has captured highest market in PVC pipes industry.
STAFF:
The company employees &share basic value of employees Company is approximately 1700
employees among those employees 1600 labor, 75 sales executives and 25 come under
management.
The staff is co-operative with internal and external persons.
The staff is sincere and hard working with corporate aim.
Staff is getting good salary as compared to other pipe industries, Proper uniform is provided to
labors and uniform to management and sales executives.
SHARED VALUES:
Idea above how organizations behave internally corporate culture of organization. The culture is
contemporary, modern management style and open dialogue. The organization structure is
modern management style of delegation suitable authority is provided is up to bottom
organization level .
STYLE:
How company is managing its operations Company has different department for its different
functions. They follow formal method of communications where the planning activities
arecarried out by the marketing heads and dealers will be informed about the new release of the
PVC products in market.
20
Company basically gets its orders from dealers allover A.P. based on the order placed. Goods
will be dispatched with in 10 days of order placed and company direct selling to the customers
THEORETICAL FRAMEWORK
Ratio Analysis is a widely used tool of financial analysis. It can be used to compare the risk and
return relationship of firms of different sizes. It is defined as the systematic use of ratio to
interpret the financial statements so that the strengths and weaknesses of a firm as well as its
historical performance and current financial condition can be determined. The term ratio refers to
the numerical or quantitative relationship between two items or variables. Ratios reveal the
relationship in a more meaningful way so as to enable equity investor’s management and lenders
make better investment and credit decisions.
A relationship between various accounting figures, which are connected with each other,
expressed in mathematical terms, is called accounting ratios.
According to Kennedy and Macmillan, "The relationship of one item to another expressed in simple
mathematical form is known as ratio."
Robert Anthony defines a ratio as “simply one number expressed in terms of another."
Standards of Comparison:
Ratios enable analysts to draw conclusions regarding financial operations. The use of ratios, as a
tool of financial analysis, involves their comparison, for a single ratio like absolute figures fails
to reveal the true position. Ratios should be compared with some standards of comparison.
Standards of comparison consists of
1. Trend ratios:
Trend ratios involves a comparison of the ratios of a firm over time that is present ratios are
compared with past ratios for the same firm. The comparison of the profitability of a firm say
year 1 through 5 is an illustration of a trend ratio.
21
2. Inter-firm comparison:
The interim comparison involving comparison of the ratios of a firm with those others in the
same line of business or for the industry as a whole reflects its performance in relation to its
competitors.
3. Time series analysis:
The easiest way to evaluate the performance of a firm is to course its present ratios with the past
ratios. When financial ratios over a period of time are compared, it is known as the time series
analysis. It gives an indication of the direction of change and reflects whether the firm’s financial
performance has improved deteriorated or remained constant over time.
4. Cross-sectional analysis:
Another way of comparison is to compare ratios of one firm with some selected risk in the same
industry at the same point in time. The kind of comparison is known as the cross-sectional
analysis or inter-firm analysis.
5. Proforma analysis:
Sometimes future ratios are used as the standard of comparison. Future ratios can be developed
from the projected, or proforma financial statements. The comparison of current or past ratios
with future ratios shows the firms relative strengths and weaknesses in the past and the future. If
the future ratios indicate weak financial position, corrective action should be initiated.
Importance of ratio analysis:
As tool of financial management ratios are of crucial significance. The importance of ration
analysis lies in the fact that it prevents facts on a comparative basis and enables the drawing of
inferences regarding the performance of a firm.
Liquidity position:
22
With the help of ratio analysis conclusion can be drawn regarding the liquidity position of a firm.
The liquidity position of a firm would be satisfactory if it is able to meet its current obligations
when they become due.
Operating Efficiency:
Yet another dimension of the usefulness of the ratio analysis, relevant from the view point of
management, is that it throws light on the degree of the efficiency in the management and
utilization of assets.
Overall profitability:
Unlike the outside parties which are interested in one aspect of the financial position or a firm
the management is constantly concerned about the overall profitability of the enterprise.
Long term solvency:
Ratio analysis is equally useful for assessing the long-term financial viability of a firm. This
aspect of the financial position of a borrower is of concern to the long term creditor’s security
analyst and the present and potential owners of a business.
ADVANTAGES OF RATIO ANALYSIS:
Financial ratios are essentially concerned with the identification of significant accounting data
relationships, which give the decision-maker insights into the financial performance of a
company. The advantages of ratio analysis can be summarized as follows:
1. Ratios facilitate conducting trend analysis, which is important for decision making and
forecasting
2. Ratio analysis helps in the assessment of the liquidity, operating efficiency, profitable
and solvency of a firm.
3. Ratio analysis provides a basis for both intra-firm as well as inter-firm comparisons.
4. The comparison of actual ratio with base year ratios or standard ratios helps the management
analyze the financial performance of the firm.
23
LIMITATIONS OF RATIO-ANALYSIS:
1. Ratio may not prove to be the ideal tool for inner-firm comparisons. When two firms adopt
different accounting policies.
2. A study of ratios in isolating, without studying the actual figures, may lead to wrong
conclusions.
3. Ratios can be calculated based on the data. If the original data is not reliable, then ratios will
be misleading
4. In the absence of well accepted standards, interpretation of ratios becomes subjective.
5. Ratio analysis suffers from lack of inconsistency.
6. Ratios fail to reflect the impact of price level changes and hence can be misleading.
7. Ratios are only tools of quantitative analysis and fail to take in to account the qualitative
aspects of a business.
8. Ratios are based on past data and hence cannot be reliable guide to future performance.
9. Ratios are volatile and can be influenced by a single transaction with extreme value.
CLASSIFICATION OF RATIOS:
Ratio may be classified in a number of ways keeping in view the particular purpose. Ratios
indicating profitability are calculated on the basis of profit and loss account: those indicating
financial position are computed on the basis of balance sheet and those which show operating
efficiency or productivity or effective use of resources are calculated on the of figures in the
profit and loss account and the balance sheet. To achieve this purpose effectively, ratios may be
classified.
24
1 .Profitability Ratios
2. Liquidity Ratio
3. Leverage Ratio
4. Turnover Ratios
1. PROFITABILITY RATIOS :
Profitability ratios are of utmost importance for a concern. These ratios are calculated to
enlighten the end results of business activities which is the sole criteria of the overall efficiency
of the business concern. The following are the important profitability ratios:
A) GENERAL PROFITABILITY RATIO:
1 .GROSS PROFIT RATIO:
This ratio reveals the result of trading operations of business. In other words, it indicates towards
to us the profitability of the core activity of the business
Gross Profit Ratio= Gross Profit x 100
Net sales
2. OPERATING RATIO:
This ratio indicates the proportion that the costs of sales bear to sales. Cost of sales includes
direct cost of goods sold as well as other operating expenses, administration, selling and
distribution expenses which have matching relationship with sales. It includes income and
expenses which have no bearing on production and sales, i.e., non-operating incomes and
expenses as interest and dividend received on investment, interest paid on long-term loans
And debentures, profit or loss on sale of fixed assets or long term investments. It is calculated as
follows:
Operating Ratio=Cost Of Goods Sold+ Operating Expense x 100
Net Sales
25
Here
.
Cost of goods sold = Openingstock+Purchases+DirectExpenses+Manufacturing
Expenses-Closing Stock of Sales-Gross Profit
Operating expenses=Administrative expenses+ selling and distribution expenses.
Lower the ratio, better it is. Higher the ratio, the less favorable it is because it would have a
smaller margin of operating profit for the payment of dividends and the creation of reserves. This
ratio should be analyzed further to throw light on the levels of efficiency prevailing in different
elements of total cost.
3. Expenses Ratio:
These are calculated to ascertain the relationship that exists between operating expenses and
volume of sales. The following ratios will help in analyzing operating ratio:
Material consumed ratio =Material consumed x100/ Sales
1. Conversion Cost Ratio =labor expenses+ manufacturing expenses x 100
Net Sales
2. Administrative Expenses Ratio =Administrative Expense Ratio x100
Net sales
3. Selling and distribution Expenses Ratio
=Selling and Distribution Expenses x100
Net Sales
The total of these four ratios will be equal to operating ratio.
4. Operating Profit Ratio
This ratio establishes the relationship between operating profit and sales it is calculated as
follows
Operating profit ratio= Operating Profit x100
Net Sales
Where,
Operating profit = Net profit+ non-operating Expenses-non-operating income.
26
(OR)
Operating Profit = Gross profit-Operating expenses.
Operating profit ratio can also be calculated with the help of operating ratio as follows:
Operating Profit Ratio=100-Operating expenses.
This indicates the portion remaining out of every rupee worth of sales after all operating cost and
expenses have been met. Higher the ratio the better it is.
5.Net Profit
This ratio is very useful to proprietors and prospective investors because it reveals the overall
profitability of the concern. This is the ratio of net profit after taxes to net sales and is calculated
as follows.
Net profit ratio=Net Profit after Tax x100
Net Sale
This ratio differs from the operating profit ratio in as much as it is calculated after deducting
non-operating expenses, such as loss on sale of fixed assets etc., from operating profit and adding
non-operating income like interest or dividend on investment or fixed asset ,etc., to such profit.
Higher the ratio, the better it gives idea of improved efficiency of the concern.
6. Cash profit Ratio:
The net profits of a firm are affected by the amount/method of depreciation charged.
Further depreciation a non-cash expenses, it is better to calculate cash profit ratio. This
ratio measures the relationship between cash generated from operations and net sales.
Thus,
Cash Profit Ratio= Cash Profit x100
27
Net sales
B) OVERALL PROFITABILITY RATIO:
1. Return on Capital Employed:
This ratio is an indicator of the earning capacity of the capital employed
in the business. This ratio is calculated as follows:
Return on Capital Employed=Operating Profit x 100
Capital employed
Here,
Operating Profit=profit before interest on long term borrowings and tax
Capital Employed=Equity Share capital + Preference Share capital+ undistributed profit+
Reserves and surplus+ long term liabilities- fictitious Assets. Alternatively, Tangible Fixed and
Intangible Assets + current assets- Current liabilities.
The ratio is considered to be the most important ratio because
It reflects the overall efficiency with which capital is used. This ratio is a helpful tool for making
capital budgeting decisions; a project yielding higher return is favored.
4. Return On Shareholder Fund: When it is desired to work out the profitability of the
company from the shareholders point of view, then it is calculated by the following
formula:
Return on Shareholders Fund= Net Profit after Interest and Tax x100
Shareholder’s Function
28
4. Return on equity shareholders Fund:
This ratio is a measure of the percentage of net profit to equity shareholders funds. The ratio is
expressed as follows.
Return on Equity Shareholders Fund= Net Profit after Tax, Interest and Preference Dividend
Equity Shareholders Funds
Here,
Equity Shareholders fund = Equity share capital + Capital Reserves + Revenue Reserves +
Balance of Profit and loss Account – Fictitious Assets.
5. Return on Total Assets:
This ratio is calculated to measure the profit after tax against the amount invested in total assets
to ascertain is being utilized properly or not. It is calculated as under.
Return on Total Assets=Net Profit after Tax x100
Total Assets
6. Earning Per Share: This helps in determining the market price of equity share of the
company and in estimating the companies’ capacity to pay dividend to its equity share holders. It
is calculated as follows.
Earning Per Share=Net Profit after Tax+ Preference Dividend
Number of Equity Shares
29
If there are both preference and equity share capitals, then out of net income first of all
preference dividends should be deducted in order to find out the net income available for equity
share holders. The performance and prospects of the company are affected by earning per share.
If earning per share increases, there is a possibility that the company pay more dividend or issue
bonus shares .In short the market price of the share of the company will be affected by all these
factors. A company of comparison of earning per share of the company will also help in deciding
whether the equity capital is being effectively used or not. Though the earning per share is the
most widely published data, yet it should be used cautiously as earning per share cannot
represent the various financial operations of the business. Moreover, the financial data collected
in respect of different companies may be affected by different practices followed by the
companies relating to stock in trade, depreciation etc. this ultimately will affect the calculation of
earnings per share and that is why earning per share should be used with precaution while
comparing the performance and prospectus of two companies.
7. Price Earning Ratio:
This ratio indicates the market value of every rupee earning in the firm and is compared with
industry average. High ratio indicates the share is overvalued and low ratio shows that share is
undervalued. It is computed as follows.
Price Earning Ratio=Market price per equity share
Earnings Per Share
8. Dividend Pay Out Ratio:
This is determined as follows: Payout Ratio=Dividend per equity share
Earning Per Share
Complementary to this ratio is retained earnings ratio. It is calculated as follows:
Retained Earnings Ratio= Retained Earnings x100
30
Total Earnings
This ratio indicates as to what proportion of earning per share has been used
For paying dividend and what has been retained for ploughing back. This ratio is very as it
important from shareholders point of view as it tells him that if a company has used whole or
substantially the whole of it’s earning for paying dividend and retained nothing for future growth
and expansion purposes, then there will be very dim chance of capital appreciation in the price of
shares of such company.
9. Dividend Yield Ratio:
This is computed as under:
Dividend Yield Ratio=Dividend Per Share
Market Price per Share
This ratio is important for those investors who are interested in the dividend income. As the
shareholder purchases the share in the open market, so his yield (rate of return) is not equal to the
dividend declared by the company. In fact, he calculates dividend per share by dividing the of
dividend by paid-up value of share. Then he calculates yield by dividing dividend per share by
the market price of share
FINANCIAL RATIO: These ratios are calculated to judge the financial position of the concern
from long term as well as short-term solvency point of view. These ratios can be divided into two
broad categories:
‱ Liquidity ratios
‱ Stability ratios
31
II. LIQUIDITY RATIOS OR SOLVENCY RATIO
These ratios are used to measure the firm’s ability to meet short term obligations. They compare
short term obligations to short term (or current) resources available to meet these obligations.
From these ratios, much insight can be obtained into the present cash solvency of the firm and
the firm’s ability to remain solvent in the event of adversity. The important liquidity ratios are
1) Current Ratio (or working capital ratio)
This is the most widely used ratio. It is the ratio of current assets to current liabilities .It shows a
firm’s ability to cover its current assets. It is expressed as follows
Current Ratio=Current Assets / Current Liabilities
Generally 2:1 is considered ideal for a concern i.e., current assets should be twice of the current
liabilities. If the current assets are two times of the current liabilities, there will be no adverse
effect on business operations when the payment of current liabilities is made.
If the ratio is less than 2, difficulty may be experienced in the payment of current liabilities and
day-to-day operations of the business may suffer. If the ratio is higher than 2, it is very
comfortable for the creditors but, for the concern, it is indicator of idle funds and a lack of
enthusiasm for work.
All current assets cannot be treated as investments which are easily marketable and sold in case
is required. For this purpose, the liquid ratio is reworked out.
2) Liquid (or Acid Test or Quick) Ratio:
This is the ratio of liquid assets to liquid liabilities. It shows a firms ability to meet current
liabilities with its most liquid (quick) assets. 1:1 ratio is considered because it is wise to keep the
liquid asset at least equal to the liquid liabilities at all times. Liquid assets are those assets which
are easily converted in to cash and will include cash balances, bills receivable, sundry debtors
32
and short-term investments. Inventories and prepaid expenses are not included in liquid assets
because the emphasis is in the ready availability of cash in case of liquid assets. Liquid liabilities
include all items of current liabilities except bank overdraft.
This ratio is the ‘acid test’ of a concerns financial soundness. It is calculated as under:
Liquid Ratio= Liquid Assets
Current Liabilities
3) Absolute Liquidity (or Super Quick ratio): Though receivables are generally more
liquid than inventories, there may be debts having doubt regarding their real stability in
time. So, to get an idea about absolute liquidity of a concern, both receivables and
inventories are excluded from current assets and only absolute liquid assets, such as cash
in hand, cash at bank and readily realizable securities are taken in to consideration.
Absolute liquidity ratio is calculated as follows:
Cash In Hand and at bank + short-term marketable securities
Current Liabilities
The desirable norm for this ratio is 1:2, i.e., Re.1 worth of absolute liquid assets are sufficient for
Rs.2 worth of current Liabilities. Even though the ratio gives a more meaningful measure of
liquidity, it is not in much use because the idea of keeping a large cash balance or near cash
items has long since been disapproved. Cash balance yields no return and as such barren.
4) Defensive Internal Ratio: It examines the firm’s liquidity position in terms of its ability to
meet projected daily expenditure for operations. It is calculated as follows:
Defensive Internal Ratio= Quick Assets
33
Projected daily cash requirements
Projected daily cash requirements are computed as follows
= Projected cash annual operating expenses
No. of days in a years
Projected cash operating expenses include cost of goods sold (excluding depreciation) and
selling and administration expenses payable in cash. It measures the time period for which a firm
can operate on the basis of present liquid assets without resorting to next year’s revenue. The
higher the ratio, the better it is.
5) Ratio of Inventory to Working Capital:
In order to ascertain that there is no overstocking, the ratio of inventory to working capital
should be calculated. It is worked as follows:
Working Capital= Inventory
Account Receivable +Inventory-Accounts Payable
Working capital is the excess of current assets over current liabilities. Increase in volume of sales
requires increase in size of inventory, but from a sound financial point of view, inventory should
not exceed of working capital. The desire ratio is 1:1.
2) STABILITY RATIO:
1) Fixed Assets to Net Worth Ratio:
The ratio establishes the relationship between fixed assets and shareholder’s fund.
Fixed Assets Net worth Ratio=Fixed Assets (After Depreciation)
Shareholder’s Funds
34
2) Solvency Ratio:
The ratio indicates the relationship between the total liabilities to outsiders to total assets of a
firm and can be calculated as follows:
Solvency Ratio=Total Liabilities to Outsiders
Total assets
3) Ratio of current assets to fixed assets:
This ratio is worked out as: Current Assets
Fixed Assets
This ratio will differ from industry to industry and, therefore, no standard can be laid down. A
decrease in the ratio may mean that trading in slack or more mechanization has been put through.
An increase in the ratio may reveal that inventories and debtors have unduly increased or fixed
assets have been intensively used. An increase in the ratio, accompanied by increase in profit,
indicates the business is expanding.
III. LEVERAGE RATIO:
These ratios help in ascertaining the long term solvency of a firm which depends on firm’s
adequate resources to meet its long term funds requirements, appropriate debt equity mix to raise
long term funds and earnings to pay interest and installment of long term loans in time (i.e.,
coverage ratios).
The following ratios can be calculated for this purpose:
1) Fixed Assets Ratio:
This ratio explains whether the firm has raised adequate long term funds to meet its fixed assets
requirements and is calculated as under:
35
Fixed Assets Ratio Fixed assets
Capital employed
This ratio gives an idea as to what part of the capital employed has been used in purchasing the
fixed assets for the concern. If the ratio is less than one it is good for the concern. The ideal ratio
0.67.
2) Debt Equity Ratio:
This ratio is calculated to measure the relative proportions of outsider’s funds and shareholders’
funds invested in the company. This ratio is determined to ascertain the soundness of long term
financial policies of the company and is also known as external-internal equity ratio. It is
calculated as follows:
Debt Equity Ratio = Long Term Debts
Shareholders’ Funds
Whether a given debt to equity ratio shows a favorable or unfavorable financial position of the
concern depends on the industry and the pattern of earning. A low ratio is generally viewed as
favorable from long term creditor’s point of view, because a large margin of protection provides
safety for the creditors. The same low ratio may be taken as quite unsatisfactory by the
shareholders because they find neglected opportunity for using low-cost outsider’s funds to
acquire fixed assets that could earn a high return. Keeping in view the interest of both
(shareholders and long-term creditors),
3) Proprietary Ratio:
A variant of debt to equity ratio is the proprietary ratio which shows the relationship between
shareholders funds and total tangible assets. This ratio is worked out as follows:
Proprietary Ratio= Shareholders’ Funds
Total Tangible Assets
36
This ratio should be 1:3, i.e., one-third of the assets minus current liabilities should be acquired
by share holders funds and the other two-thirds of the assets should be by outsider’s funds. It
focuses the attention on the general financial strength of the business enterprise.
4) Capital Gearing Ratio:
This ratio establishes the relationship between the fixed interest-bearing securities and equity
shares of a company.
It is calculated as follows:
Capital Gearing Ratio =Fixed interest-bearing securities
Equity shareholders fund
IV. TURN OVER RATIOS:
These ratios are very important for a concern to judge how well facilities at the disposal of the
concern are being used or to measure the effectiveness with which a concern uses its resources at
its disposal. These ratios are usually calculated on the basis of sales or cost of sales and are
expressed in integers rather than as a percentage. Such ratios should be calculated separately for
each type of asst. higher the turnover ratio, the better the profitability and use of capital or
resources will be.
The following are the
1) Sales to capital Employed (or capital turnover) Ratio:
This ratio shows the efficiency of capital employed in the business by computing how many
times capital employed is turned-over in a started period. The ratios are ascertained
Sales to capital Employed Sales
Capital Employed (shareholders Fund +Long –term Liabilities)
37
The higher the ratio, the greater are the profits. A low capital turnover ratio should be taken to
mean that sufficient sales are not being made and profits are lower.
2) Sales to Fixed Assets (or Fixed Assets turnover) Ratio:
This ratio expresses the number of times fixed assets are being turnover in a started period. It is
calculated as under:
Sales
Net fixed Assets (Fixed Assets-Depreciation)
This ratio shows how well the fixed assets being used in the business. The ratio is important in
case of manufacturing concerns because sales are produced not only by use of current assets but
also by amount invested in fixed assets. The higher is the ratio, the better is the performance. On
the other hand, a low ratio indicates that fixed assets are not being efficiently utilized.
3) Sales to Working Capital (or Working capital Turnover) Ratio:
Working capital a concern is directly related to sales. The current assets decrease in sales. The
working capital is taken as:
Working Capital=Current Assets- Current Liabilities
Working capital turnover ratio the velocity of utilization of net working capital. This ratio shows
the number of times working capital is turned-over in a stated period. It is
Calculated as
= Sales/ Net Working Capital (Current Assets – Current Liabilities)
38
The higher is the ratio, the lower is the investment in working capital and the greater are the
profits, a very high turnover of working capital is a sign of overtrading and may put the concern
into financial difficulties. On the other hand, a low working capital turnover ratio indicates that
working capital is not efficiently utilized.
4. Total Assets Turnover Ratio:
This ratio is calculated by dividing the net sales by the value of total assets (Net sales/total sales).
A high ratio is an indicator of over-trading of total assets while a low ratio reveals idle capacity.
The traditional standard for the ratio is two times. This ratio is calculated as follows:
Net Sales
Total Assets
5. Stock Turnover Ratio:
This ratio, also known as inventory turnover ratio, establishes relationship between cost of goods
sold during a given period and the average amount of inventory held during a accounting period.
This ratio reveals the number of times finished stock is turned over during given accounting
period. Higher the ratio, the better it is because it shows that finished stock is rapidly turned-
over. On the other hand, a low stock turnover ratio is not desirable because it reveals the
accumulation of obsolete stock, or the carrying of too much stock. This ratio is calculated as
follows:
Stock Turn Over Ratio= Cost of Goods Sold
Average stock held
Where,
Cost of goods sold=opening stock + Manufacturing Expenses-Closing Stock (or) Sales- Gross
profit.
39
Average Stock= Opening Stock +Closing Stock
2
Level of inventory should neither be too high nor too high. It is harmful to hold more inventory
for the following reasons:
It unnecessarily blocks capital which can otherwise be profitably used somewhere else.
There are chances of obsolescence of stock.
Slow disposal of stock will mean slow recovery of cash also which will adversely affect
liquidity.
There are chances of deterioration in quality if the stocks are held for more periods.
It will therefore, be advisable to dispose off inventory as early as possible. On the other hand, too
low may mean loss of business opportunities. Thus, it is very essential to keep sufficient stocks
in business.
6) Receivables (Debtors) Turnover Ratio:
This ratio measures the account receivables (trade debtors and bill receivable) in terms of
number of days of credit sales during a particular period. This ratio is calculated as follows:
Debtors Turnover Ratio= Net credit sales
Average debtors
The collection of period is calculated as under:
Collection period = 365
Debtors’ turnover ratio
(or)
Average debtors *No of days in a period
Net credit sales
40
This ratio is a measure of the collect ability of accounts receivables and tells about how the credit
policy of the company is being enforced. Suppose a company allows 30 days credit to its
customers and the ratio is 45; it is cause of anxiety to the management because debts are
outstanding for a period of 45 days. Efforts should be made to make the collection machinery
efficient so that the amount due from debtors may be realized in time. Higher the ratio, more the
chances of bad debts and lower the ratio, less the chances of bad debts.
Debtors Turnover Ratio= Credit Sales
Average Debtors
7. Creditors (or accounts payable) Turnover Ratio:
This ratio gives the average credit period enjoyed from the creditors and is calculated as:
.
Credit Purchases
Average Accounts Payable (creditors +B/P)
A high ratio indicates that creditors are not paid in time while a low ratio gives an idea that the
business is not taking full averages of credit period allowed by the creditors.
Sometimes it also required to calculate the average payment period (or average age of payables
or debt period enjoyed) to indicate the speed with which payments for credit purchases are made
to creditors. It is calculated as.
Average of payables = Months (or days) in a year
Creditor’s Turnover
41
DATA ANALYSIS AND INTERPRETATION
LIQUIDITY RATIOS:
1. CURRENT RATIO:
The current is the ratio of total assets to total liabilities. The current assets of a firm as already
stated represent those assets which can be in ordinary course of business converted into short
period of time normally not exceeding one year. The marketable securities, inventory of raw
materials, semi finished and finished goods, bills receivable and prepaid expenses. The current
liabilities are defined as liabilities which are short-term maturing obligations to be met as
originally contemplated with in a year. The ideal current ratio is 2:1. It is generally calculated as
follows
CURRENT RATIO = CURRENT ASSETS /CURRENT LIABILITIES
Table 1: CURRENT RATIO
DATA OF CURRENT RATIOs (2011-16)
The company’s current ratio in the year 2012-13 is 7.98 which is indicative of high current ratio
but in 2014-15 it is 2.29 which is satisfactory.
YEARS CURRENT
ASSETS
CURRENT
LIABILITIES
RATIO
2011-2012 130227665 72992162 1.78
2012-2013 136564815 17092387 7.98
2013-2014 220894797 91882683 2.40
2014-2015 243726601 106215516 2.29
2015-2016 370116490 173287544 2.13
42
Chart 1: CURRENT RATIO
INTERPRETATION
From the above Chart 1: The current ratio of 2015-2016 is 2.13 and that of previous year is 2.29.
When compared with previous year the current ratio has been decreased by 0.16 which shows
that the amount allocated for current assets has been decreased.
43
RATIO
2. NET WORKING CAPITAL RATIO:
Net working capital ratio represents the excess of current assets over current liabilities. Although
Net Working Capital is really not a ratio it is frequently employed as a measure of a company’s
liquidity position. An enterprise should have sufficient Net Working Capital in order to be able
to meet the claims of the creditors and the day to day needs of business. Net Working Capital is a
measure of liquidity calculated by subtracting current liabilities from current assets
Net assets = fixed assets (current assets – current liabilities) i.e., fixed assets + current assets
NET WORKING CAPITAL = CURRENT ASSETS – CURRENT LIABILITIES
NET WORKING CAPITAL RATIO = NET WORKING CAPITAL / NET ASSETS
Table 2: NET WORKING CAPITAL
YEARS NET WORKING
CAPITAL
NET ASSETS RATIO
2011-2012 57235503 173994298 0.32
2012-2013 119472427 256333412 0.46
2013-2014 129012114 257733115 0.50
2014-2015 137511085 296620694 0.46
2015-2016 196828946 361673215 0.54
The net working capital ratio has been increased when compared to previous year.
Chart 2: NET WORKING CAPITAL
44
INTERPRETATION:
From the above Chart 2: Net Working Capital of 2015-16 is 0.54 and that of 2014-15 is 0.46
when compared to previous year the Net Working Capital ratio has been increased by 0.08 this
shows that the investment on current assets has been increased.
3. LEVERAGE RATIOS:
DEBT – EQUITY RATIO:
45
The relationship between borrowed funds and owners capital is a popular measure of long-term
financial solvency of a firm. This relationship is shown by debt – equity ratio. Debt generally
refers to long term liabilities. Equity means owners funds. This ratio reflects the relative claims
of creditors and share holders against the assets of a firm. It is calculated using the formula.
DEBT – EQUITY RATIO = TOTAL DEBT / SHARE HOLDERS EQUITY
Table 3: LEVERAGE RATIOS
YEAR TOTAL DEBT SHAREHOLDERS
EQUITY
RATIO
2011-2012 143812074 31962224 4.49
2012-2013 201803812 56309600 3.58
2013-2014 199899031 59614083 3.35
2014-2015 211959144 86441549 2.45
2015-2016 247937757 115515457 2.14
Chart 3: LEVERAGE RATIOS
46
INTERPRETATION:
From the above Chart 3: The Debt - Equity Ratio of 2015-16 is 2.14 and that of 2014-15 is 2.45
when compared with previous year the ratio has been decreased by 0.31
4. CAPITAL EQUITY RATIO:
47
RATIO
Capital refers to the both amount i.e. invested in both fixed and current assets. In case of fixed
assets we should exclude depreciation and in case of current assets we should exclude current
liabilities. Shareholders equity includes share capital, past accumulated profits excluding
fictitious assets and discounts on issue of shares and so on. It is calculated by using
CAPITAL EQUITY RATIO = CAPITAL EMPLOYED / SHAREHOLDERS EQUITY
Table 4: CAPITAL EQUITY RATIO
YEAR CAPITAL
EMPLOYED
SHARE HOLDERS
EQUITY
RATIO
2011-2012 173994293 31962224 5.44
2012-2013 256333412 56309600 4.55
2013-2014 257733115 59614083 4.32
2014-2015 296620964 86441549 3.43
2015-2016 361673215 115515457 3.13
Even though the debt-equity ratio has been decreased from 4.49 to 2.14 which mean company
rely more on debt rather than equity.
Chart 4: CAPITAL EQUITY RATIO
48
INTERPRETATION
From the above Chart 4: The capital equity ratio of 2011-12 is 5.44 and that of 2014-15 is 3.43.
When compared with previous year the ratio has been decreased by 0.3
5. ACTIVITY RATIOS:
49
RATIO
FIXED ASSETS TURNOVER RATIO:
It is determined by using cost of goods sold by average fixed assets. It indicates as to what the
fixed assets of a concern have contributed to sales. It is calculated by using
FIXED ASSETS TURNOVER RATIO = COST OF GOODS SOLD/ AVERAGE FIXED ASSETS
Table 5: FIXED ASSETS TURNOVER RATIO
YEAR COST OF GOODS
SOLD
NET FIXED
ASSETS
RATIO
2011-2012 722957732 116758795 6.19
2012-2013 991439168 136860985 7.24
2013-2014 1089453932 128721001 8.46
2014-2015 1242157302 159109609 7.8
2015-2016 1620127506 164844269 9.82
The company maintained a satisfactory fixed asset turnover ratio which shows the company has
utilized assets efficiently.
Chart 5: FIXED ASSETS TURNOVER RATIO
50
INTERPRETATION:
From the above Chart 5: The fixed asset turnover ratio in the year 2015-16 is 9.82 and in the year
2014-15 is 7.8.When compared with previous year the ratio has been increased by 2.02.
6. CURRENT ASSET TURNOVER RATIO:
51
RATIO
Current assets turnover ratio is relationship between costs of goods sold by net current assets.
This ratio measures the efficiency of the firm in development of assets. High current asset
turnover ratio is an indication of better utilization of current assets. For determining the
efficiency of the management, the ratio is compared with similar firms and previous year’s ratio.
It is calculated by
CURRENT ASSETS TURNOVER RATIO = COST OF GOODS SOLD / AVERAGE CURRENT ASSETS
Table 6: CURRENT ASSET TURNOVER RATIO:
YEAR COST OF GOODS
SOLD
CURRENT
ASSETS
RATIO
2011-2012 722957732 130227665 5.55
2012-2013 991439168 136564815 7.25
2013-2014 1089453932 220894797 4.93
2014-2015 1242157302 243726601 5.09
2015-2016 1620127506 370116490 4.37
Chart 6: CURRENT ASSET TURNOVER RATIO:
52
INTERPRETATION:
From the above Chart 6: The current asset turnover ratio of 2015-16 is 4.37 and that of 2014-15
is 5.09. When compared with previous year the ratio has been decreased by 0.72
7. DEBTORS TURNOVER RATIO:
53
RATIO
Debtor’s turnover ratio is determined by dividing the net credit sales by average debtors
outstanding during the year. This ratio measures how rapidly receivables are collected. A high
ratio is indicative of shorter time lag between credit sales and cash collection. It is calculated by
DEBTORS TURNOVER RATIO = NET CREDIT SALES / AVERAGE DEBTORS
Table 7: DEBTORS TURNOVER RATIO:
YEAR NET CREDIT
SALES
AVERAGE
DEBTORS
RATIO
2011-2012 722957732 21914840 32.98
2012-2013 991439168 32555255 30.45
2013-2014 1089453932 77967182 13.97
2014-2015 1242157302 57175058 21.72
2015-2016 1620127506 102905202 15.74
From the above table we can determine that the Company’s debtor turnover ratio has been
fluctuating year by year.
Chart 7: DEBTORS TURNOVER RATIO:
54
INTERPRETATION:
From the above Chart 7: The debtor’s turnover ratio of 2015-16 is 15.74 and that of 2014-15 is
21.72 when compared with the previous year the current years ratio has been decreased by 5.98.
8. CREDITORS TURN OVER RATIO:
55
RATIO
It is a ratio between net credit purchases and the average amount of creditors outstanding during
the year. A low turnover ratio reflects liberal credit terms granted by suppliers while a high ratio
shows that accounts are to be settled rapidly. The credit turnover ratio is an important tool of
analysis as a firm can reduce its requirements of current assets by relying on supplier’s credit. It
is calculated by using,
CREDITORS TURNOVER RATIO = NET CREDIT PURCHASE / AVERAGE CREDITORS
Table 8: CREDITORS TURN OVER RATIO:
YEAR PURCHASES AVERAGE CREDITORS RATIO
2011-2012 545695201 66672316 8.18
2012-2013 699373875 79251084 8.82
2013-2014 870907282 84274183 10.3
2014-2015 1054468226 95558389 11.03
2015-2016 1489650659 162778692 9.15
Chart 8: CREDITORS TURN OVER RATIO:
56
INTERPRETATION:
From the above Chart 8: The creditor’s turnover ratio of 2015-16 is 9.15 and that of 2014-15 is
11.03 when compared to previous year the ratio is decreased by 1.88%
9. PROFITABILITY RATIOS:
57
RATIO
GROSS PROFIT RATIO:
It is also known as gross margin. Gross profit is the result of the relationship between prices,
sales volume and cost. A change in gross margin can be brought about by changes in any of
these factors.
Gross profit margin = Gross Profit *100
Sales
Table 9: PROFITABILITY RATIOS:
YEAR GROSS PROFIT SALES RATIO
2011-2012 166058217 722957732 0.229
2012-2013 245226580 991439168 0.247
2013-2014 230537456 1089453932 0.211
2014-2015 195162511 1242157302 0.157
2015-2016 258004452 1620127506 0.159
A high ratio of gross profit to sales is a sign of good management as it implies that the cost of
production of the firm is relatively low. It may be indicative of a higher sales price without a
corresponding increase in the cost of goods sold. It is calculated by using,
Chart 9: PROFITABILITY RATIOS:
58
INTERPRETATION:
From the above Chart 9: The gross profit ratio of 2015-16 is 0.159 and that of 2014-15 is
0.157.When compared with previous year the ratio has been increased by 0.002.
10. NET PROFIT RATIO:
59
RATIO
This is also known as net margin. This measures the relationship between net profits and sales of
a firm. The net profit measures the percentage of each sale rupee remaining after all costs and
expenses including interest and taxes have been deducted. The net profit is indicative of
management ability to operate the business with sufficient success.
NET PROFIT RATIO = EARNINGS AFTER INTEREST AND TAXES / NET SALES
Table 10: NET PROFIT RATIO:
YEAR NET PROFIT NET SALES RATIO
2011-2012 2555269 722957732 0.003
2012-2013 6347376 991439168 0.006
2013-2014 8517277 1089453932 0.007
2014-2015 10119736 1242157302 0.008
2015-2016 13815314 1620127506 0.009
From the table it can be justified that the company’s net profit ratio is increasing year by year.
Chart 10: NET PROFIT RATIO:
60
INTERPRETATION:
From the above Chart 10: The net profit ratio of 2015-16 is 0.009 and that of 2014-15 is 0.008
when compared to previous year the net profit ratio has been increased by 0.001.
FINDINGS
61
1. The current ratio of 2015-2016 is 2.13 and that of previous year is 2.29. When compared
with previous year the current ratio has been decreased by 0.16 which shows that the
amount allocated for current assets has been decreased.
2. Net Working Capital of 2015-16 is 0.54 and that of 2014-15 is 0.46 when compared to
previous year the Net Working Capital ratio has been increased by 0.08 this shows that
the investment on current assets has been increased.
3. The Debt - Equity Ratio of 2015-16 is 2.14 and that of 2014-15 is 2.45 when compared
with previous year the ratio has been decreased by 0.31
4. The capital equity ratio of 2011-12 is 5.44 and that of 2014-15 is 3.43. When compared
with previous year the ratio has been decreased by 0.3
5. The fixed asset turnover ratio in the year 2015-16 is 9.82 and in the year 2014-15 is
7.8.When compared with previous year the ratio has been increased by 2.02.
6. The current asset turnover ratio of 2015-16 is 4.37 and that of 2014-15 is 5.09. When
compared with previous year the ratio has been decreased by 0.72
7. The debtor’s turnover ratio of 2015-16 is 15.74 and that of 2014-15 is 21.72 when
compared with the previous year the current years ratio has been decreased by 5.98
8. The creditor’s turnover ratio of 2015-16 is 9.15 and that of 2014-15 is 11.03 when
compared to previous year the ratio is decreased by 1.88%
9. The gross profit ratio of 2015-16 is 0.159 and that of 2014-15 is 0.157.When compared
with previous year the ratio has been increased by 0.002.
10. The net profit ratio of 2015-16 is 0.009 and that of 2014-15 is 0.008 when compared to
previous year the net profit ratio has been increased by 0.001.
62
SUGGESTIONS
The company rely more on debt rather than equity which shows the company has to reduce debt
which is above the standard levels.
A high debtor turnover ratio is positive sign for the company but the company’s debtor turnover
ratio has been decreasing and the collection period has also been decreased which shows the
delayed payment of debtors.
A high debtor turnover ratio is an indicative of trade credit management.
CONCLUSION
63
Based on all the above observations we can conclude that the company is maintaining the
financial position in a successful way and only the suggestion is to maintain constant earnings
per share ratio which benefits’ the equity share holders.
The main purpose of ratio analysis is to measure past performance and project future trends. It is
also used for inter-firm and intra-firm comparison as a measure of comparative productivity. The
financial analyst X-rays the financial conditions of a concern by the use of various ratios and if
the conditions are not found to be favorable, suitable steps can be taken to overcome the
limitations.
64

Weitere Àhnliche Inhalte

Was ist angesagt?

Reliance & Retail
Reliance & RetailReliance & Retail
Reliance & Retail
Jerry Jose
 
COAL INDIA PROJECT REPORT
COAL INDIA PROJECT REPORTCOAL INDIA PROJECT REPORT
COAL INDIA PROJECT REPORT
YASHI YADUVANSHI
 
Project on lead generation and sales
Project on lead generation and salesProject on lead generation and sales
Project on lead generation and sales
Sushant Kohli
 
Apollo tyres ...aj
Apollo tyres ...ajApollo tyres ...aj
Apollo tyres ...aj
Ankur Jaiswal
 
Auto auto-ancillaries-sector
Auto auto-ancillaries-sectorAuto auto-ancillaries-sector
Auto auto-ancillaries-sector
sudhanshugargirevna
 
45907503 mrf-tyres
45907503 mrf-tyres45907503 mrf-tyres
45907503 mrf-tyres
Amit Bishyer
 

Was ist angesagt? (20)

Financial Statement of Tata Motors
Financial Statement of Tata MotorsFinancial Statement of Tata Motors
Financial Statement of Tata Motors
 
Reliance & Retail
Reliance & RetailReliance & Retail
Reliance & Retail
 
Lakme
LakmeLakme
Lakme
 
COAL INDIA PROJECT REPORT
COAL INDIA PROJECT REPORTCOAL INDIA PROJECT REPORT
COAL INDIA PROJECT REPORT
 
CavinKare Brand critique
CavinKare Brand critique CavinKare Brand critique
CavinKare Brand critique
 
Project on lead generation and sales
Project on lead generation and salesProject on lead generation and sales
Project on lead generation and sales
 
Apollo tyres ...aj
Apollo tyres ...ajApollo tyres ...aj
Apollo tyres ...aj
 
Sun Pharma Vs Lupin Pharma
Sun Pharma Vs Lupin PharmaSun Pharma Vs Lupin Pharma
Sun Pharma Vs Lupin Pharma
 
Hero motocorp ltd full PPT
Hero motocorp ltd full PPTHero motocorp ltd full PPT
Hero motocorp ltd full PPT
 
PROJECT ON RELIANCE RETAIL
PROJECT ON RELIANCE RETAILPROJECT ON RELIANCE RETAIL
PROJECT ON RELIANCE RETAIL
 
Swot analysis of automobile industry in India
Swot analysis of automobile industry in IndiaSwot analysis of automobile industry in India
Swot analysis of automobile industry in India
 
Indian Retail Sector and Pantaloons India Pvt. Ltd.mat
Indian Retail Sector and Pantaloons India Pvt. Ltd.matIndian Retail Sector and Pantaloons India Pvt. Ltd.mat
Indian Retail Sector and Pantaloons India Pvt. Ltd.mat
 
Patanjali's BCG Matrix, Ansoff's Matrix, Marketing Mix Details Business Project
Patanjali's BCG Matrix, Ansoff's Matrix, Marketing Mix Details Business ProjectPatanjali's BCG Matrix, Ansoff's Matrix, Marketing Mix Details Business Project
Patanjali's BCG Matrix, Ansoff's Matrix, Marketing Mix Details Business Project
 
a study on consumer perception of patanjali in bangalore
a study on consumer perception of patanjali in bangalorea study on consumer perception of patanjali in bangalore
a study on consumer perception of patanjali in bangalore
 
PROJECT REPORT ON MAHINDRA & MAHINDRA
PROJECT REPORT ON MAHINDRA & MAHINDRAPROJECT REPORT ON MAHINDRA & MAHINDRA
PROJECT REPORT ON MAHINDRA & MAHINDRA
 
Auto auto-ancillaries-sector
Auto auto-ancillaries-sectorAuto auto-ancillaries-sector
Auto auto-ancillaries-sector
 
45907503 mrf-tyres
45907503 mrf-tyres45907503 mrf-tyres
45907503 mrf-tyres
 
Customer satisfaction towards herbal product
Customer satisfaction towards herbal productCustomer satisfaction towards herbal product
Customer satisfaction towards herbal product
 
BCG matrix,Activity mapping,Porter's Five forces,Blue Ocean strategy & core ...
 BCG matrix,Activity mapping,Porter's Five forces,Blue Ocean strategy & core ... BCG matrix,Activity mapping,Porter's Five forces,Blue Ocean strategy & core ...
BCG matrix,Activity mapping,Porter's Five forces,Blue Ocean strategy & core ...
 
NYKAA
NYKAA NYKAA
NYKAA
 

Ähnlich wie 15361

financial statement analysis. trishit
financial statement analysis. trishitfinancial statement analysis. trishit
financial statement analysis. trishit
Trishit Dutta
 
Financial statements analysis
Financial statements analysisFinancial statements analysis
Financial statements analysis
oonyu
 

Ähnlich wie 15361 (20)

FINANCIAL PERFORMANCE ANALYSIS OF BHARTI AIRTEL LIMITED
FINANCIAL PERFORMANCE ANALYSIS OF BHARTI AIRTEL LIMITEDFINANCIAL PERFORMANCE ANALYSIS OF BHARTI AIRTEL LIMITED
FINANCIAL PERFORMANCE ANALYSIS OF BHARTI AIRTEL LIMITED
 
minor project on ratio analysis of "......"
minor project on ratio analysis of "......"minor project on ratio analysis of "......"
minor project on ratio analysis of "......"
 
Financial analysis
Financial analysisFinancial analysis
Financial analysis
 
financial statement analysis. trishit
financial statement analysis. trishitfinancial statement analysis. trishit
financial statement analysis. trishit
 
Ratios Analysis
Ratios Analysis Ratios Analysis
Ratios Analysis
 
A Study on Ratio Analysis at Accord Puducherry
A Study on Ratio Analysis at Accord PuducherryA Study on Ratio Analysis at Accord Puducherry
A Study on Ratio Analysis at Accord Puducherry
 
Report on the Financial Ratios and IT Industry Analysis
Report on the Financial Ratios and IT Industry AnalysisReport on the Financial Ratios and IT Industry Analysis
Report on the Financial Ratios and IT Industry Analysis
 
financial statement bharath bag works nizamabad
 financial statement bharath bag works nizamabad financial statement bharath bag works nizamabad
financial statement bharath bag works nizamabad
 
Financial Analysis on Recession Period at M&M Tractors
Financial Analysis on Recession Period at M&M TractorsFinancial Analysis on Recession Period at M&M Tractors
Financial Analysis on Recession Period at M&M Tractors
 
Mtm4 white paper financial ratio and statement analysis
Mtm4 white paper   financial ratio and statement analysisMtm4 white paper   financial ratio and statement analysis
Mtm4 white paper financial ratio and statement analysis
 
Research project final
Research project finalResearch project final
Research project final
 
Financial statements analysis
Financial statements analysisFinancial statements analysis
Financial statements analysis
 
Project wipro
Project wiproProject wipro
Project wipro
 
Wip
WipWip
Wip
 
Financial analysis on recession period conducted at mahindra & mahindra tractors
Financial analysis on recession period conducted at mahindra & mahindra tractorsFinancial analysis on recession period conducted at mahindra & mahindra tractors
Financial analysis on recession period conducted at mahindra & mahindra tractors
 
the-concept-of-financial-analysis-in-detail.pdf
the-concept-of-financial-analysis-in-detail.pdfthe-concept-of-financial-analysis-in-detail.pdf
the-concept-of-financial-analysis-in-detail.pdf
 
STR.docx
STR.docxSTR.docx
STR.docx
 
the-concept-of-financial-analysis-in-detail.pdf
the-concept-of-financial-analysis-in-detail.pdfthe-concept-of-financial-analysis-in-detail.pdf
the-concept-of-financial-analysis-in-detail.pdf
 
FINANCIAL STATEMENT ANALYSIS
FINANCIAL STATEMENT ANALYSISFINANCIAL STATEMENT ANALYSIS
FINANCIAL STATEMENT ANALYSIS
 
Ijetr042103
Ijetr042103Ijetr042103
Ijetr042103
 

KĂŒrzlich hochgeladen

Mifepristone Available in Muscat +918761049707^^ €€ Buy Abortion Pills in Oman
Mifepristone Available in Muscat +918761049707^^ €€ Buy Abortion Pills in OmanMifepristone Available in Muscat +918761049707^^ €€ Buy Abortion Pills in Oman
Mifepristone Available in Muscat +918761049707^^ €€ Buy Abortion Pills in Oman
instagramfab782445
 
Structuring and Writing DRL Mckinsey (1).pdf
Structuring and Writing DRL Mckinsey (1).pdfStructuring and Writing DRL Mckinsey (1).pdf
Structuring and Writing DRL Mckinsey (1).pdf
laloo_007
 

KĂŒrzlich hochgeladen (20)

New 2024 Cannabis Edibles Investor Pitch Deck Template
New 2024 Cannabis Edibles Investor Pitch Deck TemplateNew 2024 Cannabis Edibles Investor Pitch Deck Template
New 2024 Cannabis Edibles Investor Pitch Deck Template
 
Falcon Invoice Discounting: The best investment platform in india for investors
Falcon Invoice Discounting: The best investment platform in india for investorsFalcon Invoice Discounting: The best investment platform in india for investors
Falcon Invoice Discounting: The best investment platform in india for investors
 
Organizational Transformation Lead with Culture
Organizational Transformation Lead with CultureOrganizational Transformation Lead with Culture
Organizational Transformation Lead with Culture
 
Getting Real with AI - Columbus DAW - May 2024 - Nick Woo from AlignAI
Getting Real with AI - Columbus DAW - May 2024 - Nick Woo from AlignAIGetting Real with AI - Columbus DAW - May 2024 - Nick Woo from AlignAI
Getting Real with AI - Columbus DAW - May 2024 - Nick Woo from AlignAI
 
Falcon Invoice Discounting: Aviate Your Cash Flow Challenges
Falcon Invoice Discounting: Aviate Your Cash Flow ChallengesFalcon Invoice Discounting: Aviate Your Cash Flow Challenges
Falcon Invoice Discounting: Aviate Your Cash Flow Challenges
 
SEO Case Study: How I Increased SEO Traffic & Ranking by 50-60% in 6 Months
SEO Case Study: How I Increased SEO Traffic & Ranking by 50-60%  in 6 MonthsSEO Case Study: How I Increased SEO Traffic & Ranking by 50-60%  in 6 Months
SEO Case Study: How I Increased SEO Traffic & Ranking by 50-60% in 6 Months
 
Lucknow Housewife Escorts by Sexy Bhabhi Service 8250092165
Lucknow Housewife Escorts  by Sexy Bhabhi Service 8250092165Lucknow Housewife Escorts  by Sexy Bhabhi Service 8250092165
Lucknow Housewife Escorts by Sexy Bhabhi Service 8250092165
 
TVB_The Vietnam Believer Newsletter_May 6th, 2024_ENVol. 006.pdf
TVB_The Vietnam Believer Newsletter_May 6th, 2024_ENVol. 006.pdfTVB_The Vietnam Believer Newsletter_May 6th, 2024_ENVol. 006.pdf
TVB_The Vietnam Believer Newsletter_May 6th, 2024_ENVol. 006.pdf
 
Call 7737669865 Vadodara Call Girls Service at your Door Step Available All Time
Call 7737669865 Vadodara Call Girls Service at your Door Step Available All TimeCall 7737669865 Vadodara Call Girls Service at your Door Step Available All Time
Call 7737669865 Vadodara Call Girls Service at your Door Step Available All Time
 
Buy Verified TransferWise Accounts From Seosmmearth
Buy Verified TransferWise Accounts From SeosmmearthBuy Verified TransferWise Accounts From Seosmmearth
Buy Verified TransferWise Accounts From Seosmmearth
 
Unveiling Falcon Invoice Discounting: Leading the Way as India's Premier Bill...
Unveiling Falcon Invoice Discounting: Leading the Way as India's Premier Bill...Unveiling Falcon Invoice Discounting: Leading the Way as India's Premier Bill...
Unveiling Falcon Invoice Discounting: Leading the Way as India's Premier Bill...
 
Cannabis Legalization World Map: 2024 Updated
Cannabis Legalization World Map: 2024 UpdatedCannabis Legalization World Map: 2024 Updated
Cannabis Legalization World Map: 2024 Updated
 
PHX May 2024 Corporate Presentation Final
PHX May 2024 Corporate Presentation FinalPHX May 2024 Corporate Presentation Final
PHX May 2024 Corporate Presentation Final
 
Mifepristone Available in Muscat +918761049707^^ €€ Buy Abortion Pills in Oman
Mifepristone Available in Muscat +918761049707^^ €€ Buy Abortion Pills in OmanMifepristone Available in Muscat +918761049707^^ €€ Buy Abortion Pills in Oman
Mifepristone Available in Muscat +918761049707^^ €€ Buy Abortion Pills in Oman
 
Structuring and Writing DRL Mckinsey (1).pdf
Structuring and Writing DRL Mckinsey (1).pdfStructuring and Writing DRL Mckinsey (1).pdf
Structuring and Writing DRL Mckinsey (1).pdf
 
CROSS CULTURAL NEGOTIATION BY PANMISEM NS
CROSS CULTURAL NEGOTIATION BY PANMISEM NSCROSS CULTURAL NEGOTIATION BY PANMISEM NS
CROSS CULTURAL NEGOTIATION BY PANMISEM NS
 
Pre Engineered Building Manufacturers Hyderabad.pptx
Pre Engineered  Building Manufacturers Hyderabad.pptxPre Engineered  Building Manufacturers Hyderabad.pptx
Pre Engineered Building Manufacturers Hyderabad.pptx
 
Arti Languages Pre Seed Teaser Deck 2024.pdf
Arti Languages Pre Seed Teaser Deck 2024.pdfArti Languages Pre Seed Teaser Deck 2024.pdf
Arti Languages Pre Seed Teaser Deck 2024.pdf
 
Rice Manufacturers in India | Shree Krishna Exports
Rice Manufacturers in India | Shree Krishna ExportsRice Manufacturers in India | Shree Krishna Exports
Rice Manufacturers in India | Shree Krishna Exports
 
Lundin Gold - Q1 2024 Conference Call Presentation (Revised)
Lundin Gold - Q1 2024 Conference Call Presentation (Revised)Lundin Gold - Q1 2024 Conference Call Presentation (Revised)
Lundin Gold - Q1 2024 Conference Call Presentation (Revised)
 

15361

  • 1. ABSTRACT Analysts use ratios to predict financial variables and to evaluate relative performance. They group ratios into liquidity and profitability category to forecast bankruptcy, the probability of loan defaults and stock prices. Relative performance evaluation assumes comparing a company's performance to that of a chosen industry or benchmark ratio filters out the performance effects of common uncertainties, leaving only company-specific performance. In such evaluations, other companies' performance provides information about a specific company's performance. Ratio analysis is used primarily to compare a company’s financial results over a period of time. A method sometimes called trend analysis. Trend analysis can also show how a company’s ratio stock up against. Those of other business both within and outside. The industry ratios allow for comparison below companies, below industries, below time periods for a single company of its industry. Ratio analysis methods used by every company and it is essential to know the fluctuations in Assets and Liabilities 1
  • 2. INTRODUCTION Ratio Analysis is uses on amalgamation of financial (or) operating data from a company (or) operating data from a company (or) industry to provide a basis for comparison. Every ratio measures a unique association that may have an impact or other ratios. In accounts a financial ratio, accounting ratio is used to evaluate the overall financial conditions of a company or other organizations. Company owners, stock holders (or) potential investors use ratio analysis viability- liabilities and future performance. A company owner should continuously evaluate the performance of the company by comparing its historical figures with those for industry competitiveness and even with therefore successful business in other industries. However an owner needs to look at more than easily attainable numbers such as Sales, Profits, and Total Assets. Ratio analysis needs to be used to read below the lines of financial statements and make senses of numbers. This will allow the owner to identify and quantify the company’s strength and weaknesses, evaluate its financial position and understand the risks it may be focusing. For private and institutional investors, ratios are important profit tools in financial analysis. Although ratios report mostly presents on past performance. They can be predicated too, and can provide indications of potential problems areas. 2
  • 3. OBJECTIVES OF THE STUDY 1. To measure the overall financial position of firm. 2. To know the nature of fixed and current assets. 3. To analyze the company liquidity position. 4. To elicit effectiveness of the firm in using available resources with activity ratios. 5. To seek aspects like leverage and profitability of company. 6. To provide measures for enriching the performance of the company. 3
  • 4. NEED FOR THE STUDY The study has great significance and will provide benefits to various parties, directly or indirectly interact with the company .It is apparent to benefitize employees and offer motivation, impacting there contribution for the company’s growth. It is beneficial to the management of the company as it provides a clear cut picture with regard to the LIQUIDITY, PROFITABILITY, LEVERAGE, and ACTIVITY RATIO. 4
  • 5. IMPORTANCE OF THE STUDY Mainly the persons interested in the analysis of the financial statements can be grouped under three heads (i) Owners or investors, (ii) Creditors and (iii) Financial executives. The importance of analysis varies materially with the purpose for which it is calculated. The primary information which seeks to be obtained from these statements differs considerable reflecting the purpose that the statement is to serve. The significance of these ratios varies for these three groups as their purpose differs widely. These investors are mainly concerned with the earning capacity of the company whereas the creditors including bankers and financial institutions are interesting in knowing the ability of enterprise to meet its financial obligations timely. The financial executives are concerned with evolving analytical tools that will measure and compare costs, efficiency, liquidity and profitability with a view to making intelligent decisions. 1. A useful tool in the hands of forecaster 2. Inter-Firm comparison: 3. Trend Analysis: Thus ratio analysis plays a very important role in the interpretation of the financial statements correctly and to make the figures comparable and more meaningful. 5
  • 6. SCOPE OF THE STUDY The study continuous pivotally on financial performance of the selected company. It helps to estimate the company’s current financial position. In addition to this various financial aspects can also be learned in observational studies. It also reflects categories of ratios towards firm prospectus in their monetary paradigms. 6
  • 7. RESEARCH METHODOLOGY & DATABASE Research and experimental development is formal work undertaken systematically to increase the stock of knowledge, including knowledge of humanity, culture and society, and the use of this stock of knowledge to devise new applications standard practice for surveys on research and experimental development, It is used to establish or confirm facts, reaffirm the results of previous work, solve new or existing problems, support theorems, or develop new theories. A research project may also be an expansion on past work in the field. To test the validity of instruments, procedures, or experiments, research may replicate elements of prior projects, or the project as a whole. The primary purposes of basic research (as opposed to applied research) are documentation, discovery, interpretation, or the research and development of methods and systems for the advancement of human knowledge. Approaches to research depend on epistemologies, which vary considerably both within and between humanities and sciences. Scientific research relies on the application of the scientific method. This research provides scientific information and theories for the explanation of the nature and the properties of the world. It makes practical applications possible. Scientific research is funded by public authorities, by charitable organizations and by private groups, including many companies. Scientific research can be subdivided into different classifications according to their academic and application disciplines. Scientific research is a widely used criterion for judging the standing of an academic institution, such as business schools, but some argue that such is an inaccurate assessment of the institution. Research in the humanities involves different methods such as for example hermeneutics and semiotics, and a different, more relativist epistemology. Humanities scholars usually do not search for the ultimate correct answer to a question, but instead explore the issues and details that surround it. Context is always important, and context can be social, historical, political, cultural 7
  • 8. or ethnic. An example of research in the humanities is historical research, which is embodied in historical method. Historians use primary sources and other evidence to systematically investigate a topic, and then to write histories in the form of accounts of the past. Artistic research, also seen as 'practice-based research', can take form when creative works are considered both the research and the object of research itself. It is the debatable body of thought which offers an alternative to purely scientific methods in research in its search for knowledge and truth. Types of Data : A data type, in programming, is a classification that specifies which type of value a variable has and what type of mathematical, relational or logical operations can be applied to it without causing an error. A string, for example, is a data type that is used to classify text and an integer is a data type used to classify whole numbers. Primary Source: Most of the data collect from discussions with various officials in finance department and other officers of other departments. Secondary Source: Most of the calculations are made on the financial statements of the company and the company provided financial statements for five years. Some of the information regarding the theoretical aspects was collected by referring standard textbooks and reference books On the basis of data from the annual reports, brochures, and prospectus for public issue and on the various financial ratios are calculated. The values are compared with desired levels of standard ratios to identify financial position and performance. Sources of Data: The data relating to financial statement of Sujala Pipes Pvt Ltd and the information is obtained with the cooperation of management 8
  • 9. LIMITATIONS OF THE STUDY 1. The price level change makes the interpretation of ratios invalid. 2. Ratio analysis has impact of inflation. 3. The period of the study is limited. 4. The study is only on ratio analysis which is a tool of financial analysis so, it is not possible to assess the company’s performance based on only this results. 5. Though employees are good co-operative as well as cordial they are unable to spend their valuable time, as they are very busy with their work. 9
  • 10. COMPANY PROFILE Origin Rayalaseema, economically backward part of the Andhra Pradesh (state) has been identified for-rapid industrialization. To boost up the economic level of the region, i.e., Nandyal town in Rayalaseema was industrially indentified scope of development for dynamic entrepreneurship. The Legendary personality Sri S.P.Y. Reddy was a Mechanical Engineer from Farmers family. He started unit at Nandyal driving primarily in manufacturing black pipes since 1977, his determination and hard work has helped him in overcoming conundrums in the initial years, with the financial assistance by the local commercial banks. Later he extended manufacturing unit further to a Private Limited Company called SujalaPipes Private Limited; He is acted as Managing Director and group promoter as well. He got financial assistance and institutional assistance which motivated him to setup this firm sustainably and for successful future. With a great hope and expectations he gladiate produces PVC Pipes for improving the water transport system. Nandi pipes are famous all over country stand and for testimony to zeal Perseverance and Hard Work and for ‘sighted vision’ of the one individual. The founder is eminent technoi entrepreneur possessing dynamic mechanical knowledge He left his plum job at bar to bring dynamism and energy and aspirations started manufacturing of LDPE pipes and later switched to PVC achieving incomparable success. SujalaPipes Private Ltd is the manufacturing of the largest and most comprehensive range of PVC pipes in India. Quality Policy / Processes: We use ISO 9002 quality systems to maintain unsurpassed quality of our entire production. Year of Establishment: 1979. 10
  • 11. Nature of Business: Manufacturer, Exporter Major markets: Indian subcontinent GROWTH AND DEVELOPMENT OF THE ORGANIZATION: The Sujala pipes private limited has excellent growth record from 1977 onwards From this year onwards they have started in different regions. ‱ 1977- Nandyal region (polythene pipes) ‱ 1984-1985-PVC pipes Rayalaseema region ‱ 1985-1987-Rayalaseema, Telengana region ‱ 1987-1988-Andhra and Karnataka States ‱ 1989-1990-Andhra Tamilnadu and Karnataka states ‱ 1990-1992-Andhra, Kerala and Karnataka states From this year onwards they have started to introduce their pipes in Orrisa, Utteranchal, and Chattisghad etc. HEAD OF THE DEPARTMENTS: ‱ Finance Manager: T.Maruthi Venkateshwar Rao ‱ Sales Manager: K.Satya.Reddy ‱ Human Resource Manager: G.Krishna Mohan ‱ Marketing Manager: K. Satya Reddy 11
  • 12. PRODUCTS: 1) Agricultural pipes. 2) Blue casing & Submersible pipes. 3) Electrical pipes. 4) Plumbing pipes. 5) Ring fit pipes. 6) Solvent cements. 7) Suction & garden pipes. 8) Swr pipes. 9) Water tanks. Esteemed customers: Nandi pipes are proud to present list of customers which is includes big water pipe line projects, dot projects panchayitiraj and industrial development corporation, Etc., Satya sai water schemes, Lorhen projects ,NABARD Water schemes, Karnataka land army department and also we take turkey projects for pipeline. Size: Various sizes ranging from œ” to 10” are offered to customers. But for the purpose of cubic space utilization in trucks while transport organization is adopting the technique like pipe in pipe. Payment period: 12
  • 13. The company adopts zero credit policy and goods are not delivered unless cash remittance is made. The same policy is also applicable to authorized dealers of Sujala Pipes Pvt Ltd. CHANNELS OF DISTRIBTION: Sujala Pipes Pvt Ltd has gat zero level and single level channel distribution. Sujala Pipes Pvt. Ltd. has an extensive network of 350 dealers in Andhra Pradesh and who are directly by company sales force and 620 dealers in south India. COVERAGE: At Present Andhra Pradesh, part of Southern States of Karnataka, Thailand and Kerala are in ambit of Sujala Pipes Pvt. Ltd. TRANSPORT: Transport vehicles of Sujala Pipes Pvt., outnumbers the fleet of the competitors vehicles. This unique strength of the organization enables the delivery system to efficient. This event helps the dealers to reduce inventory levels to the minimum. Thus dealers are also supplemented with the benefit of their lower paid up capital in the form of inventory. FUNCTIONAL DEPARTMENT OF THE COMPANY: Financial Department: Though initially the company approached the external sources for financial aid, now the financial status of the company is very sound and is being run only with self finance except the loan taken on hypothecation of machinery and stock from SBI Nandyal and karur Vysya bank, Nandyal. MANUFACTURER CONSUMER MANUFACTURER DEALER CONSUMER 13
  • 14. The financial Department is headed by the financial manager with the help of four Accounts and other Clerk of the department. The company follows cash& carries policy. The product is not delivered until the cash is paid and these transactions are look after financial department with the help of marketing department. Marketing Department: Executive Director heads marketing Department. Marketing Manger is in charge of all the operations who reports to executive Director. Marketing Manager and 35 Sales Representatives are under immediate control of Executive Director. There are also 20 salesmen who to report to the representatives above them. Personnel Department: The personal department consists the details of the Executive and workers of the organization. The organization is formed with S.P.Y. Reddy. The General Manager and Executive Director who reports to Managing Director. Two Marketing Manager, Financial manager, Public Relations officer and quality Control Officer who all reports to Executive director. Other than the Executives there qre1500 workers in the organization. Panel consisting of Managing Director, Executive Director, General Manager and Managers of concerned department makes the recruitment and selection. Apart from the attractive salaries company provides meals and health care facilities. Purchasing Department The perplexing situation that is confined by the manufacturers of the PVC Pipes is scarcity of resin. Though the government of India has taken various steps to improve supply conditions of PVC resin, the Indian manufacturers could meet only 50% of demand and remaining 50% is met from imports. 14
  • 15. Human resource policies and practices: The following are highlights of H.R policies and practices. Effective utilization of man power, ‱ To provide good working condition. ‱ To promote industrial development. NANDI PIPES: Nandi has its origin in the year 1979 when Mr.S.P.Y Reddy a technocrat left his job at Bhaba atomic research center, Mumbai to start plastic containers unit in Nandyal and his unit has grown into conglomerate of 15 companies with combined annual turn over $75 million. Nandi group is lead by Mr.S.P.Y.Reddy. The founder of company and had been witnessing annual growth of 20% for the past 5years. Mr.Reddy who sensed and opportunity in making pipes for irrigation sated manufacture of PVC pipes in year 1984 and has fast become leading manufacturer in A.P and a leading producer in India with annual production of 5000 tones of pipes. Their other business includes dairy products, education, water storage container, flexible houses, and HDPE pipes. The group is privately owned. The group has manufacturing plant in 5 locations in South India to improve operations efficiency and to enhance customer satisfaction. Nandi group sells PVC pipes under 4 brands of which nandi brand is the most prominent. The group constantly updates its products, machinery to reflect of venturing only into branded products to ensure the stability and steady growth. Nandi pipes is brand name of popular PVC pipes mode by two companies, Sujala Pipes and Rani Pipes. They made possible few other ventures pipes are sol under brand names NANDI, RANI, and JALA together they are highest selling PVC pipe brand in South India and will be among top 3 in India. Pipes are made in two varieties, self-socketing and ring fit. Pipes are also made to suit various pressure and impacts requirements are even custom made to meet special requirements. 15
  • 16. The usage of PVC pipes as replacement for traditional materials in the field of construction is one rise in India and that bodes well for future of business for Nandi group the whole range of products meet all the relevant national and international standards and are produced in ISO 9000 certified manufacturing facilities. Nandi rigid PVC pipes with their good quality. Free service, during and economical uses are better choice then mild steel, galvanized steel cost iron and plastic pipes. BENEFITS OF NANDI RIGID PVC PIPES: Economy: Being cheaper the conventional cement and steel pipes, Nandi rigid PVC pipes are very economical. Light weight: PVC pipes are 1/6 of the weight of steel pipes. This makes them easy to carry and install, doing way with heavy material handling equipment. This reduces labour cost as well as the process of installation is faster. Rugged and Durable: Manufacture of the best PVC material. Nandi rigid PVC pipes do not rest are not affected by most chemical hence they last longer. Render trouble free services and require less maintenance. More Flow: Fractional lopes in Nandi rigid pipes are 40% lower than conventional pipes hence there is approximately 25% more flow than that of competitor. ITL pipes: “UBTEGRANTED THERMOPLASTICS LIMITED” incorporated in the state of A.P as “TORRENT THERMOPLASTICS LIMIT on 25th Jan 1994 PVC LTd” under the companies Act 1956 and thereafter converted into a public Ltd company on 25th may 1994 in terms of the special resolution dated: 28th Jan 1994 under sec 31(1)44 of the companies Act 195. 16
  • 17. The name of the company was changed to “INTEGRATED THERMOPLASTIC LIMITED” as per fresh certificate of incorporation dated 5th Aug 1994. The company has been formed the main objective of manufacturing and dealing in the thermoplastics and allied products. Nandi pipes took it over in 1999. Products: The ITL manufactures the following products High density polyethylene pipes ‱ Polypropylene pipes. ‱ Polyvinyl chloride pipes. ‱ Chlorinated polyvinyl chloride pipes. MONARCH PIPES: “MONARCH PIPES LIMITED” was incorporated in the year 1986. the factory is suited at NH- 7H, Humpapuram village, Rapthadu Mandal, Anantapur (Distric)t. It was taken over by Nandi pipes. Its annual production capacity is 16000 meters, and it is one of the leading manufacturers of PVC pipes in South India. The company equipped with technical collaboration from batter field of West Germany. It has made possible few other small ventures Pipes and sold under brand names MONARCH, KOHINOOR, and KRISHNA Monarch pipes with their good quality trouble free service, durability and economical use are a better choice than mild steel, galvanized steel, cost iron and plastic pipes. The company is managed by term of professional under the guidance of a young experienced and well-qualified Dynamic Managing Director Mr. Sridhar Reddy. APPLICATIONS OF PVC PIPES: ‱ Agriculture and Irrigation Schemes. ‱ Rural & urban water supply schemes. ‱ Tubes well casing. ‱ Gas and oil supply ones. 17
  • 18. ‱ Industrial effluent disposal. ‱ Sewage and drainage schemes. ‱ Air condition ducting. ‱ Building installation. ‱ Industrial ducting. STRATEGY: Nandi pipes which re famous all over the A.P “To provide world class quality and customized product development support. They enjoy the satisfaction of million of customers. QUALITY POLICY: ‱ They shall provide products & services that meet started standard every time. ‱ They will organize their work practices to do a job right, first time every time. ‱ They are committed to continue this improvement in the quality in all business process. SYSTEM: The flow of activities in the daily operations of business including its core process and its support system. Purchase System: Company purchases its raw materials from other states like Gujarat, Maharashtra and Orissa. Other countries like Srilanka and Thailand. Production System: The work is fully automatic manufacturing lay out with world-class batten field extrusion plant Sujala pipes Pvt. Ltd. have 3 units in A.P operating in Nandyal, Hyderabad and Anantapur. 18
  • 19. Finance System: Sujala pipes Pvt. Ltd follows two types of finance system they are ‱ Operational finance system ‱ Corporate finance system Marketing System: Sujala pipes pvt Ltd. Is following a variety of marketing strategies like hoardings advertisement through television, paints etc for promotion of the products. TRANSPORTATION OF FINISHED GOODS Sujala pipes pvt. Ltd mainly depends on road for transportation of finished goods. CORE PROCESS: Product development is mainly based on consumer feedback. DEMAND MANAGEMENT: Company estimates its product demand in market by past sales. This is helpful for future production of products and increase of man power for increased productivity. ORDER FULFILMENT: Customers can directly visit the company for the pipes or they can get through the dealers required number of goods. if any customer who make bulk order (100 pipes) company provides free transportation facilities with in 10 days the pipes will distributed to customers, The chain is in two ways Producer Dealers Customer 19
  • 20. Producer Customers SKILLS: Organization’s dominants capability and competency. INDUSTRIAL CONCEPT OF COMPETETION: Higher market share of the company in comparison to its competitors. In A.P. Sujala Pipes Pvt. Ltd. Has captured highest market in PVC pipes industry. STAFF: The company employees &share basic value of employees Company is approximately 1700 employees among those employees 1600 labor, 75 sales executives and 25 come under management. The staff is co-operative with internal and external persons. The staff is sincere and hard working with corporate aim. Staff is getting good salary as compared to other pipe industries, Proper uniform is provided to labors and uniform to management and sales executives. SHARED VALUES: Idea above how organizations behave internally corporate culture of organization. The culture is contemporary, modern management style and open dialogue. The organization structure is modern management style of delegation suitable authority is provided is up to bottom organization level . STYLE: How company is managing its operations Company has different department for its different functions. They follow formal method of communications where the planning activities arecarried out by the marketing heads and dealers will be informed about the new release of the PVC products in market. 20
  • 21. Company basically gets its orders from dealers allover A.P. based on the order placed. Goods will be dispatched with in 10 days of order placed and company direct selling to the customers THEORETICAL FRAMEWORK Ratio Analysis is a widely used tool of financial analysis. It can be used to compare the risk and return relationship of firms of different sizes. It is defined as the systematic use of ratio to interpret the financial statements so that the strengths and weaknesses of a firm as well as its historical performance and current financial condition can be determined. The term ratio refers to the numerical or quantitative relationship between two items or variables. Ratios reveal the relationship in a more meaningful way so as to enable equity investor’s management and lenders make better investment and credit decisions. A relationship between various accounting figures, which are connected with each other, expressed in mathematical terms, is called accounting ratios. According to Kennedy and Macmillan, "The relationship of one item to another expressed in simple mathematical form is known as ratio." Robert Anthony defines a ratio as “simply one number expressed in terms of another." Standards of Comparison: Ratios enable analysts to draw conclusions regarding financial operations. The use of ratios, as a tool of financial analysis, involves their comparison, for a single ratio like absolute figures fails to reveal the true position. Ratios should be compared with some standards of comparison. Standards of comparison consists of 1. Trend ratios: Trend ratios involves a comparison of the ratios of a firm over time that is present ratios are compared with past ratios for the same firm. The comparison of the profitability of a firm say year 1 through 5 is an illustration of a trend ratio. 21
  • 22. 2. Inter-firm comparison: The interim comparison involving comparison of the ratios of a firm with those others in the same line of business or for the industry as a whole reflects its performance in relation to its competitors. 3. Time series analysis: The easiest way to evaluate the performance of a firm is to course its present ratios with the past ratios. When financial ratios over a period of time are compared, it is known as the time series analysis. It gives an indication of the direction of change and reflects whether the firm’s financial performance has improved deteriorated or remained constant over time. 4. Cross-sectional analysis: Another way of comparison is to compare ratios of one firm with some selected risk in the same industry at the same point in time. The kind of comparison is known as the cross-sectional analysis or inter-firm analysis. 5. Proforma analysis: Sometimes future ratios are used as the standard of comparison. Future ratios can be developed from the projected, or proforma financial statements. The comparison of current or past ratios with future ratios shows the firms relative strengths and weaknesses in the past and the future. If the future ratios indicate weak financial position, corrective action should be initiated. Importance of ratio analysis: As tool of financial management ratios are of crucial significance. The importance of ration analysis lies in the fact that it prevents facts on a comparative basis and enables the drawing of inferences regarding the performance of a firm. Liquidity position: 22
  • 23. With the help of ratio analysis conclusion can be drawn regarding the liquidity position of a firm. The liquidity position of a firm would be satisfactory if it is able to meet its current obligations when they become due. Operating Efficiency: Yet another dimension of the usefulness of the ratio analysis, relevant from the view point of management, is that it throws light on the degree of the efficiency in the management and utilization of assets. Overall profitability: Unlike the outside parties which are interested in one aspect of the financial position or a firm the management is constantly concerned about the overall profitability of the enterprise. Long term solvency: Ratio analysis is equally useful for assessing the long-term financial viability of a firm. This aspect of the financial position of a borrower is of concern to the long term creditor’s security analyst and the present and potential owners of a business. ADVANTAGES OF RATIO ANALYSIS: Financial ratios are essentially concerned with the identification of significant accounting data relationships, which give the decision-maker insights into the financial performance of a company. The advantages of ratio analysis can be summarized as follows: 1. Ratios facilitate conducting trend analysis, which is important for decision making and forecasting 2. Ratio analysis helps in the assessment of the liquidity, operating efficiency, profitable and solvency of a firm. 3. Ratio analysis provides a basis for both intra-firm as well as inter-firm comparisons. 4. The comparison of actual ratio with base year ratios or standard ratios helps the management analyze the financial performance of the firm. 23
  • 24. LIMITATIONS OF RATIO-ANALYSIS: 1. Ratio may not prove to be the ideal tool for inner-firm comparisons. When two firms adopt different accounting policies. 2. A study of ratios in isolating, without studying the actual figures, may lead to wrong conclusions. 3. Ratios can be calculated based on the data. If the original data is not reliable, then ratios will be misleading 4. In the absence of well accepted standards, interpretation of ratios becomes subjective. 5. Ratio analysis suffers from lack of inconsistency. 6. Ratios fail to reflect the impact of price level changes and hence can be misleading. 7. Ratios are only tools of quantitative analysis and fail to take in to account the qualitative aspects of a business. 8. Ratios are based on past data and hence cannot be reliable guide to future performance. 9. Ratios are volatile and can be influenced by a single transaction with extreme value. CLASSIFICATION OF RATIOS: Ratio may be classified in a number of ways keeping in view the particular purpose. Ratios indicating profitability are calculated on the basis of profit and loss account: those indicating financial position are computed on the basis of balance sheet and those which show operating efficiency or productivity or effective use of resources are calculated on the of figures in the profit and loss account and the balance sheet. To achieve this purpose effectively, ratios may be classified. 24
  • 25. 1 .Profitability Ratios 2. Liquidity Ratio 3. Leverage Ratio 4. Turnover Ratios 1. PROFITABILITY RATIOS : Profitability ratios are of utmost importance for a concern. These ratios are calculated to enlighten the end results of business activities which is the sole criteria of the overall efficiency of the business concern. The following are the important profitability ratios: A) GENERAL PROFITABILITY RATIO: 1 .GROSS PROFIT RATIO: This ratio reveals the result of trading operations of business. In other words, it indicates towards to us the profitability of the core activity of the business Gross Profit Ratio= Gross Profit x 100 Net sales 2. OPERATING RATIO: This ratio indicates the proportion that the costs of sales bear to sales. Cost of sales includes direct cost of goods sold as well as other operating expenses, administration, selling and distribution expenses which have matching relationship with sales. It includes income and expenses which have no bearing on production and sales, i.e., non-operating incomes and expenses as interest and dividend received on investment, interest paid on long-term loans And debentures, profit or loss on sale of fixed assets or long term investments. It is calculated as follows: Operating Ratio=Cost Of Goods Sold+ Operating Expense x 100 Net Sales 25
  • 26. Here
. Cost of goods sold = Openingstock+Purchases+DirectExpenses+Manufacturing Expenses-Closing Stock of Sales-Gross Profit Operating expenses=Administrative expenses+ selling and distribution expenses. Lower the ratio, better it is. Higher the ratio, the less favorable it is because it would have a smaller margin of operating profit for the payment of dividends and the creation of reserves. This ratio should be analyzed further to throw light on the levels of efficiency prevailing in different elements of total cost. 3. Expenses Ratio: These are calculated to ascertain the relationship that exists between operating expenses and volume of sales. The following ratios will help in analyzing operating ratio: Material consumed ratio =Material consumed x100/ Sales 1. Conversion Cost Ratio =labor expenses+ manufacturing expenses x 100 Net Sales 2. Administrative Expenses Ratio =Administrative Expense Ratio x100 Net sales 3. Selling and distribution Expenses Ratio =Selling and Distribution Expenses x100 Net Sales The total of these four ratios will be equal to operating ratio. 4. Operating Profit Ratio This ratio establishes the relationship between operating profit and sales it is calculated as follows Operating profit ratio= Operating Profit x100 Net Sales Where, Operating profit = Net profit+ non-operating Expenses-non-operating income. 26
  • 27. (OR) Operating Profit = Gross profit-Operating expenses. Operating profit ratio can also be calculated with the help of operating ratio as follows: Operating Profit Ratio=100-Operating expenses. This indicates the portion remaining out of every rupee worth of sales after all operating cost and expenses have been met. Higher the ratio the better it is. 5.Net Profit This ratio is very useful to proprietors and prospective investors because it reveals the overall profitability of the concern. This is the ratio of net profit after taxes to net sales and is calculated as follows. Net profit ratio=Net Profit after Tax x100 Net Sale This ratio differs from the operating profit ratio in as much as it is calculated after deducting non-operating expenses, such as loss on sale of fixed assets etc., from operating profit and adding non-operating income like interest or dividend on investment or fixed asset ,etc., to such profit. Higher the ratio, the better it gives idea of improved efficiency of the concern. 6. Cash profit Ratio: The net profits of a firm are affected by the amount/method of depreciation charged. Further depreciation a non-cash expenses, it is better to calculate cash profit ratio. This ratio measures the relationship between cash generated from operations and net sales. Thus, Cash Profit Ratio= Cash Profit x100 27
  • 28. Net sales B) OVERALL PROFITABILITY RATIO: 1. Return on Capital Employed: This ratio is an indicator of the earning capacity of the capital employed in the business. This ratio is calculated as follows: Return on Capital Employed=Operating Profit x 100 Capital employed Here, Operating Profit=profit before interest on long term borrowings and tax Capital Employed=Equity Share capital + Preference Share capital+ undistributed profit+ Reserves and surplus+ long term liabilities- fictitious Assets. Alternatively, Tangible Fixed and Intangible Assets + current assets- Current liabilities. The ratio is considered to be the most important ratio because It reflects the overall efficiency with which capital is used. This ratio is a helpful tool for making capital budgeting decisions; a project yielding higher return is favored. 4. Return On Shareholder Fund: When it is desired to work out the profitability of the company from the shareholders point of view, then it is calculated by the following formula: Return on Shareholders Fund= Net Profit after Interest and Tax x100 Shareholder’s Function 28
  • 29. 4. Return on equity shareholders Fund: This ratio is a measure of the percentage of net profit to equity shareholders funds. The ratio is expressed as follows. Return on Equity Shareholders Fund= Net Profit after Tax, Interest and Preference Dividend Equity Shareholders Funds Here, Equity Shareholders fund = Equity share capital + Capital Reserves + Revenue Reserves + Balance of Profit and loss Account – Fictitious Assets. 5. Return on Total Assets: This ratio is calculated to measure the profit after tax against the amount invested in total assets to ascertain is being utilized properly or not. It is calculated as under. Return on Total Assets=Net Profit after Tax x100 Total Assets 6. Earning Per Share: This helps in determining the market price of equity share of the company and in estimating the companies’ capacity to pay dividend to its equity share holders. It is calculated as follows. Earning Per Share=Net Profit after Tax+ Preference Dividend Number of Equity Shares 29
  • 30. If there are both preference and equity share capitals, then out of net income first of all preference dividends should be deducted in order to find out the net income available for equity share holders. The performance and prospects of the company are affected by earning per share. If earning per share increases, there is a possibility that the company pay more dividend or issue bonus shares .In short the market price of the share of the company will be affected by all these factors. A company of comparison of earning per share of the company will also help in deciding whether the equity capital is being effectively used or not. Though the earning per share is the most widely published data, yet it should be used cautiously as earning per share cannot represent the various financial operations of the business. Moreover, the financial data collected in respect of different companies may be affected by different practices followed by the companies relating to stock in trade, depreciation etc. this ultimately will affect the calculation of earnings per share and that is why earning per share should be used with precaution while comparing the performance and prospectus of two companies. 7. Price Earning Ratio: This ratio indicates the market value of every rupee earning in the firm and is compared with industry average. High ratio indicates the share is overvalued and low ratio shows that share is undervalued. It is computed as follows. Price Earning Ratio=Market price per equity share Earnings Per Share 8. Dividend Pay Out Ratio: This is determined as follows: Payout Ratio=Dividend per equity share Earning Per Share Complementary to this ratio is retained earnings ratio. It is calculated as follows: Retained Earnings Ratio= Retained Earnings x100 30
  • 31. Total Earnings This ratio indicates as to what proportion of earning per share has been used For paying dividend and what has been retained for ploughing back. This ratio is very as it important from shareholders point of view as it tells him that if a company has used whole or substantially the whole of it’s earning for paying dividend and retained nothing for future growth and expansion purposes, then there will be very dim chance of capital appreciation in the price of shares of such company. 9. Dividend Yield Ratio: This is computed as under: Dividend Yield Ratio=Dividend Per Share Market Price per Share This ratio is important for those investors who are interested in the dividend income. As the shareholder purchases the share in the open market, so his yield (rate of return) is not equal to the dividend declared by the company. In fact, he calculates dividend per share by dividing the of dividend by paid-up value of share. Then he calculates yield by dividing dividend per share by the market price of share FINANCIAL RATIO: These ratios are calculated to judge the financial position of the concern from long term as well as short-term solvency point of view. These ratios can be divided into two broad categories: ‱ Liquidity ratios ‱ Stability ratios 31
  • 32. II. LIQUIDITY RATIOS OR SOLVENCY RATIO These ratios are used to measure the firm’s ability to meet short term obligations. They compare short term obligations to short term (or current) resources available to meet these obligations. From these ratios, much insight can be obtained into the present cash solvency of the firm and the firm’s ability to remain solvent in the event of adversity. The important liquidity ratios are 1) Current Ratio (or working capital ratio) This is the most widely used ratio. It is the ratio of current assets to current liabilities .It shows a firm’s ability to cover its current assets. It is expressed as follows Current Ratio=Current Assets / Current Liabilities Generally 2:1 is considered ideal for a concern i.e., current assets should be twice of the current liabilities. If the current assets are two times of the current liabilities, there will be no adverse effect on business operations when the payment of current liabilities is made. If the ratio is less than 2, difficulty may be experienced in the payment of current liabilities and day-to-day operations of the business may suffer. If the ratio is higher than 2, it is very comfortable for the creditors but, for the concern, it is indicator of idle funds and a lack of enthusiasm for work. All current assets cannot be treated as investments which are easily marketable and sold in case is required. For this purpose, the liquid ratio is reworked out. 2) Liquid (or Acid Test or Quick) Ratio: This is the ratio of liquid assets to liquid liabilities. It shows a firms ability to meet current liabilities with its most liquid (quick) assets. 1:1 ratio is considered because it is wise to keep the liquid asset at least equal to the liquid liabilities at all times. Liquid assets are those assets which are easily converted in to cash and will include cash balances, bills receivable, sundry debtors 32
  • 33. and short-term investments. Inventories and prepaid expenses are not included in liquid assets because the emphasis is in the ready availability of cash in case of liquid assets. Liquid liabilities include all items of current liabilities except bank overdraft. This ratio is the ‘acid test’ of a concerns financial soundness. It is calculated as under: Liquid Ratio= Liquid Assets Current Liabilities 3) Absolute Liquidity (or Super Quick ratio): Though receivables are generally more liquid than inventories, there may be debts having doubt regarding their real stability in time. So, to get an idea about absolute liquidity of a concern, both receivables and inventories are excluded from current assets and only absolute liquid assets, such as cash in hand, cash at bank and readily realizable securities are taken in to consideration. Absolute liquidity ratio is calculated as follows: Cash In Hand and at bank + short-term marketable securities Current Liabilities The desirable norm for this ratio is 1:2, i.e., Re.1 worth of absolute liquid assets are sufficient for Rs.2 worth of current Liabilities. Even though the ratio gives a more meaningful measure of liquidity, it is not in much use because the idea of keeping a large cash balance or near cash items has long since been disapproved. Cash balance yields no return and as such barren. 4) Defensive Internal Ratio: It examines the firm’s liquidity position in terms of its ability to meet projected daily expenditure for operations. It is calculated as follows: Defensive Internal Ratio= Quick Assets 33
  • 34. Projected daily cash requirements Projected daily cash requirements are computed as follows = Projected cash annual operating expenses No. of days in a years Projected cash operating expenses include cost of goods sold (excluding depreciation) and selling and administration expenses payable in cash. It measures the time period for which a firm can operate on the basis of present liquid assets without resorting to next year’s revenue. The higher the ratio, the better it is. 5) Ratio of Inventory to Working Capital: In order to ascertain that there is no overstocking, the ratio of inventory to working capital should be calculated. It is worked as follows: Working Capital= Inventory Account Receivable +Inventory-Accounts Payable Working capital is the excess of current assets over current liabilities. Increase in volume of sales requires increase in size of inventory, but from a sound financial point of view, inventory should not exceed of working capital. The desire ratio is 1:1. 2) STABILITY RATIO: 1) Fixed Assets to Net Worth Ratio: The ratio establishes the relationship between fixed assets and shareholder’s fund. Fixed Assets Net worth Ratio=Fixed Assets (After Depreciation) Shareholder’s Funds 34
  • 35. 2) Solvency Ratio: The ratio indicates the relationship between the total liabilities to outsiders to total assets of a firm and can be calculated as follows: Solvency Ratio=Total Liabilities to Outsiders Total assets 3) Ratio of current assets to fixed assets: This ratio is worked out as: Current Assets Fixed Assets This ratio will differ from industry to industry and, therefore, no standard can be laid down. A decrease in the ratio may mean that trading in slack or more mechanization has been put through. An increase in the ratio may reveal that inventories and debtors have unduly increased or fixed assets have been intensively used. An increase in the ratio, accompanied by increase in profit, indicates the business is expanding. III. LEVERAGE RATIO: These ratios help in ascertaining the long term solvency of a firm which depends on firm’s adequate resources to meet its long term funds requirements, appropriate debt equity mix to raise long term funds and earnings to pay interest and installment of long term loans in time (i.e., coverage ratios). The following ratios can be calculated for this purpose: 1) Fixed Assets Ratio: This ratio explains whether the firm has raised adequate long term funds to meet its fixed assets requirements and is calculated as under: 35
  • 36. Fixed Assets Ratio Fixed assets Capital employed This ratio gives an idea as to what part of the capital employed has been used in purchasing the fixed assets for the concern. If the ratio is less than one it is good for the concern. The ideal ratio 0.67. 2) Debt Equity Ratio: This ratio is calculated to measure the relative proportions of outsider’s funds and shareholders’ funds invested in the company. This ratio is determined to ascertain the soundness of long term financial policies of the company and is also known as external-internal equity ratio. It is calculated as follows: Debt Equity Ratio = Long Term Debts Shareholders’ Funds Whether a given debt to equity ratio shows a favorable or unfavorable financial position of the concern depends on the industry and the pattern of earning. A low ratio is generally viewed as favorable from long term creditor’s point of view, because a large margin of protection provides safety for the creditors. The same low ratio may be taken as quite unsatisfactory by the shareholders because they find neglected opportunity for using low-cost outsider’s funds to acquire fixed assets that could earn a high return. Keeping in view the interest of both (shareholders and long-term creditors), 3) Proprietary Ratio: A variant of debt to equity ratio is the proprietary ratio which shows the relationship between shareholders funds and total tangible assets. This ratio is worked out as follows: Proprietary Ratio= Shareholders’ Funds Total Tangible Assets 36
  • 37. This ratio should be 1:3, i.e., one-third of the assets minus current liabilities should be acquired by share holders funds and the other two-thirds of the assets should be by outsider’s funds. It focuses the attention on the general financial strength of the business enterprise. 4) Capital Gearing Ratio: This ratio establishes the relationship between the fixed interest-bearing securities and equity shares of a company. It is calculated as follows: Capital Gearing Ratio =Fixed interest-bearing securities Equity shareholders fund IV. TURN OVER RATIOS: These ratios are very important for a concern to judge how well facilities at the disposal of the concern are being used or to measure the effectiveness with which a concern uses its resources at its disposal. These ratios are usually calculated on the basis of sales or cost of sales and are expressed in integers rather than as a percentage. Such ratios should be calculated separately for each type of asst. higher the turnover ratio, the better the profitability and use of capital or resources will be. The following are the 1) Sales to capital Employed (or capital turnover) Ratio: This ratio shows the efficiency of capital employed in the business by computing how many times capital employed is turned-over in a started period. The ratios are ascertained Sales to capital Employed Sales Capital Employed (shareholders Fund +Long –term Liabilities) 37
  • 38. The higher the ratio, the greater are the profits. A low capital turnover ratio should be taken to mean that sufficient sales are not being made and profits are lower. 2) Sales to Fixed Assets (or Fixed Assets turnover) Ratio: This ratio expresses the number of times fixed assets are being turnover in a started period. It is calculated as under: Sales Net fixed Assets (Fixed Assets-Depreciation) This ratio shows how well the fixed assets being used in the business. The ratio is important in case of manufacturing concerns because sales are produced not only by use of current assets but also by amount invested in fixed assets. The higher is the ratio, the better is the performance. On the other hand, a low ratio indicates that fixed assets are not being efficiently utilized. 3) Sales to Working Capital (or Working capital Turnover) Ratio: Working capital a concern is directly related to sales. The current assets decrease in sales. The working capital is taken as: Working Capital=Current Assets- Current Liabilities Working capital turnover ratio the velocity of utilization of net working capital. This ratio shows the number of times working capital is turned-over in a stated period. It is Calculated as = Sales/ Net Working Capital (Current Assets – Current Liabilities) 38
  • 39. The higher is the ratio, the lower is the investment in working capital and the greater are the profits, a very high turnover of working capital is a sign of overtrading and may put the concern into financial difficulties. On the other hand, a low working capital turnover ratio indicates that working capital is not efficiently utilized. 4. Total Assets Turnover Ratio: This ratio is calculated by dividing the net sales by the value of total assets (Net sales/total sales). A high ratio is an indicator of over-trading of total assets while a low ratio reveals idle capacity. The traditional standard for the ratio is two times. This ratio is calculated as follows: Net Sales Total Assets 5. Stock Turnover Ratio: This ratio, also known as inventory turnover ratio, establishes relationship between cost of goods sold during a given period and the average amount of inventory held during a accounting period. This ratio reveals the number of times finished stock is turned over during given accounting period. Higher the ratio, the better it is because it shows that finished stock is rapidly turned- over. On the other hand, a low stock turnover ratio is not desirable because it reveals the accumulation of obsolete stock, or the carrying of too much stock. This ratio is calculated as follows: Stock Turn Over Ratio= Cost of Goods Sold Average stock held Where, Cost of goods sold=opening stock + Manufacturing Expenses-Closing Stock (or) Sales- Gross profit. 39
  • 40. Average Stock= Opening Stock +Closing Stock 2 Level of inventory should neither be too high nor too high. It is harmful to hold more inventory for the following reasons: It unnecessarily blocks capital which can otherwise be profitably used somewhere else. There are chances of obsolescence of stock. Slow disposal of stock will mean slow recovery of cash also which will adversely affect liquidity. There are chances of deterioration in quality if the stocks are held for more periods. It will therefore, be advisable to dispose off inventory as early as possible. On the other hand, too low may mean loss of business opportunities. Thus, it is very essential to keep sufficient stocks in business. 6) Receivables (Debtors) Turnover Ratio: This ratio measures the account receivables (trade debtors and bill receivable) in terms of number of days of credit sales during a particular period. This ratio is calculated as follows: Debtors Turnover Ratio= Net credit sales Average debtors The collection of period is calculated as under: Collection period = 365 Debtors’ turnover ratio (or) Average debtors *No of days in a period Net credit sales 40
  • 41. This ratio is a measure of the collect ability of accounts receivables and tells about how the credit policy of the company is being enforced. Suppose a company allows 30 days credit to its customers and the ratio is 45; it is cause of anxiety to the management because debts are outstanding for a period of 45 days. Efforts should be made to make the collection machinery efficient so that the amount due from debtors may be realized in time. Higher the ratio, more the chances of bad debts and lower the ratio, less the chances of bad debts. Debtors Turnover Ratio= Credit Sales Average Debtors 7. Creditors (or accounts payable) Turnover Ratio: This ratio gives the average credit period enjoyed from the creditors and is calculated as: . Credit Purchases Average Accounts Payable (creditors +B/P) A high ratio indicates that creditors are not paid in time while a low ratio gives an idea that the business is not taking full averages of credit period allowed by the creditors. Sometimes it also required to calculate the average payment period (or average age of payables or debt period enjoyed) to indicate the speed with which payments for credit purchases are made to creditors. It is calculated as. Average of payables = Months (or days) in a year Creditor’s Turnover 41
  • 42. DATA ANALYSIS AND INTERPRETATION LIQUIDITY RATIOS: 1. CURRENT RATIO: The current is the ratio of total assets to total liabilities. The current assets of a firm as already stated represent those assets which can be in ordinary course of business converted into short period of time normally not exceeding one year. The marketable securities, inventory of raw materials, semi finished and finished goods, bills receivable and prepaid expenses. The current liabilities are defined as liabilities which are short-term maturing obligations to be met as originally contemplated with in a year. The ideal current ratio is 2:1. It is generally calculated as follows CURRENT RATIO = CURRENT ASSETS /CURRENT LIABILITIES Table 1: CURRENT RATIO DATA OF CURRENT RATIOs (2011-16) The company’s current ratio in the year 2012-13 is 7.98 which is indicative of high current ratio but in 2014-15 it is 2.29 which is satisfactory. YEARS CURRENT ASSETS CURRENT LIABILITIES RATIO 2011-2012 130227665 72992162 1.78 2012-2013 136564815 17092387 7.98 2013-2014 220894797 91882683 2.40 2014-2015 243726601 106215516 2.29 2015-2016 370116490 173287544 2.13 42
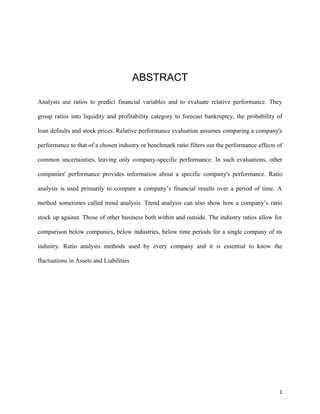
  • 43. Chart 1: CURRENT RATIO INTERPRETATION From the above Chart 1: The current ratio of 2015-2016 is 2.13 and that of previous year is 2.29. When compared with previous year the current ratio has been decreased by 0.16 which shows that the amount allocated for current assets has been decreased. 43 RATIO
  • 44. 2. NET WORKING CAPITAL RATIO: Net working capital ratio represents the excess of current assets over current liabilities. Although Net Working Capital is really not a ratio it is frequently employed as a measure of a company’s liquidity position. An enterprise should have sufficient Net Working Capital in order to be able to meet the claims of the creditors and the day to day needs of business. Net Working Capital is a measure of liquidity calculated by subtracting current liabilities from current assets Net assets = fixed assets (current assets – current liabilities) i.e., fixed assets + current assets NET WORKING CAPITAL = CURRENT ASSETS – CURRENT LIABILITIES NET WORKING CAPITAL RATIO = NET WORKING CAPITAL / NET ASSETS Table 2: NET WORKING CAPITAL YEARS NET WORKING CAPITAL NET ASSETS RATIO 2011-2012 57235503 173994298 0.32 2012-2013 119472427 256333412 0.46 2013-2014 129012114 257733115 0.50 2014-2015 137511085 296620694 0.46 2015-2016 196828946 361673215 0.54 The net working capital ratio has been increased when compared to previous year. Chart 2: NET WORKING CAPITAL 44
  • 45. INTERPRETATION: From the above Chart 2: Net Working Capital of 2015-16 is 0.54 and that of 2014-15 is 0.46 when compared to previous year the Net Working Capital ratio has been increased by 0.08 this shows that the investment on current assets has been increased. 3. LEVERAGE RATIOS: DEBT – EQUITY RATIO: 45
  • 46. The relationship between borrowed funds and owners capital is a popular measure of long-term financial solvency of a firm. This relationship is shown by debt – equity ratio. Debt generally refers to long term liabilities. Equity means owners funds. This ratio reflects the relative claims of creditors and share holders against the assets of a firm. It is calculated using the formula. DEBT – EQUITY RATIO = TOTAL DEBT / SHARE HOLDERS EQUITY Table 3: LEVERAGE RATIOS YEAR TOTAL DEBT SHAREHOLDERS EQUITY RATIO 2011-2012 143812074 31962224 4.49 2012-2013 201803812 56309600 3.58 2013-2014 199899031 59614083 3.35 2014-2015 211959144 86441549 2.45 2015-2016 247937757 115515457 2.14 Chart 3: LEVERAGE RATIOS 46
  • 47. INTERPRETATION: From the above Chart 3: The Debt - Equity Ratio of 2015-16 is 2.14 and that of 2014-15 is 2.45 when compared with previous year the ratio has been decreased by 0.31 4. CAPITAL EQUITY RATIO: 47 RATIO
  • 48. Capital refers to the both amount i.e. invested in both fixed and current assets. In case of fixed assets we should exclude depreciation and in case of current assets we should exclude current liabilities. Shareholders equity includes share capital, past accumulated profits excluding fictitious assets and discounts on issue of shares and so on. It is calculated by using CAPITAL EQUITY RATIO = CAPITAL EMPLOYED / SHAREHOLDERS EQUITY Table 4: CAPITAL EQUITY RATIO YEAR CAPITAL EMPLOYED SHARE HOLDERS EQUITY RATIO 2011-2012 173994293 31962224 5.44 2012-2013 256333412 56309600 4.55 2013-2014 257733115 59614083 4.32 2014-2015 296620964 86441549 3.43 2015-2016 361673215 115515457 3.13 Even though the debt-equity ratio has been decreased from 4.49 to 2.14 which mean company rely more on debt rather than equity. Chart 4: CAPITAL EQUITY RATIO 48
  • 49. INTERPRETATION From the above Chart 4: The capital equity ratio of 2011-12 is 5.44 and that of 2014-15 is 3.43. When compared with previous year the ratio has been decreased by 0.3 5. ACTIVITY RATIOS: 49 RATIO
  • 50. FIXED ASSETS TURNOVER RATIO: It is determined by using cost of goods sold by average fixed assets. It indicates as to what the fixed assets of a concern have contributed to sales. It is calculated by using FIXED ASSETS TURNOVER RATIO = COST OF GOODS SOLD/ AVERAGE FIXED ASSETS Table 5: FIXED ASSETS TURNOVER RATIO YEAR COST OF GOODS SOLD NET FIXED ASSETS RATIO 2011-2012 722957732 116758795 6.19 2012-2013 991439168 136860985 7.24 2013-2014 1089453932 128721001 8.46 2014-2015 1242157302 159109609 7.8 2015-2016 1620127506 164844269 9.82 The company maintained a satisfactory fixed asset turnover ratio which shows the company has utilized assets efficiently. Chart 5: FIXED ASSETS TURNOVER RATIO 50
  • 51. INTERPRETATION: From the above Chart 5: The fixed asset turnover ratio in the year 2015-16 is 9.82 and in the year 2014-15 is 7.8.When compared with previous year the ratio has been increased by 2.02. 6. CURRENT ASSET TURNOVER RATIO: 51 RATIO
  • 52. Current assets turnover ratio is relationship between costs of goods sold by net current assets. This ratio measures the efficiency of the firm in development of assets. High current asset turnover ratio is an indication of better utilization of current assets. For determining the efficiency of the management, the ratio is compared with similar firms and previous year’s ratio. It is calculated by CURRENT ASSETS TURNOVER RATIO = COST OF GOODS SOLD / AVERAGE CURRENT ASSETS Table 6: CURRENT ASSET TURNOVER RATIO: YEAR COST OF GOODS SOLD CURRENT ASSETS RATIO 2011-2012 722957732 130227665 5.55 2012-2013 991439168 136564815 7.25 2013-2014 1089453932 220894797 4.93 2014-2015 1242157302 243726601 5.09 2015-2016 1620127506 370116490 4.37 Chart 6: CURRENT ASSET TURNOVER RATIO: 52
  • 53. INTERPRETATION: From the above Chart 6: The current asset turnover ratio of 2015-16 is 4.37 and that of 2014-15 is 5.09. When compared with previous year the ratio has been decreased by 0.72 7. DEBTORS TURNOVER RATIO: 53 RATIO
  • 54. Debtor’s turnover ratio is determined by dividing the net credit sales by average debtors outstanding during the year. This ratio measures how rapidly receivables are collected. A high ratio is indicative of shorter time lag between credit sales and cash collection. It is calculated by DEBTORS TURNOVER RATIO = NET CREDIT SALES / AVERAGE DEBTORS Table 7: DEBTORS TURNOVER RATIO: YEAR NET CREDIT SALES AVERAGE DEBTORS RATIO 2011-2012 722957732 21914840 32.98 2012-2013 991439168 32555255 30.45 2013-2014 1089453932 77967182 13.97 2014-2015 1242157302 57175058 21.72 2015-2016 1620127506 102905202 15.74 From the above table we can determine that the Company’s debtor turnover ratio has been fluctuating year by year. Chart 7: DEBTORS TURNOVER RATIO: 54
  • 55. INTERPRETATION: From the above Chart 7: The debtor’s turnover ratio of 2015-16 is 15.74 and that of 2014-15 is 21.72 when compared with the previous year the current years ratio has been decreased by 5.98. 8. CREDITORS TURN OVER RATIO: 55 RATIO
  • 56. It is a ratio between net credit purchases and the average amount of creditors outstanding during the year. A low turnover ratio reflects liberal credit terms granted by suppliers while a high ratio shows that accounts are to be settled rapidly. The credit turnover ratio is an important tool of analysis as a firm can reduce its requirements of current assets by relying on supplier’s credit. It is calculated by using, CREDITORS TURNOVER RATIO = NET CREDIT PURCHASE / AVERAGE CREDITORS Table 8: CREDITORS TURN OVER RATIO: YEAR PURCHASES AVERAGE CREDITORS RATIO 2011-2012 545695201 66672316 8.18 2012-2013 699373875 79251084 8.82 2013-2014 870907282 84274183 10.3 2014-2015 1054468226 95558389 11.03 2015-2016 1489650659 162778692 9.15 Chart 8: CREDITORS TURN OVER RATIO: 56
  • 57. INTERPRETATION: From the above Chart 8: The creditor’s turnover ratio of 2015-16 is 9.15 and that of 2014-15 is 11.03 when compared to previous year the ratio is decreased by 1.88% 9. PROFITABILITY RATIOS: 57 RATIO
  • 58. GROSS PROFIT RATIO: It is also known as gross margin. Gross profit is the result of the relationship between prices, sales volume and cost. A change in gross margin can be brought about by changes in any of these factors. Gross profit margin = Gross Profit *100 Sales Table 9: PROFITABILITY RATIOS: YEAR GROSS PROFIT SALES RATIO 2011-2012 166058217 722957732 0.229 2012-2013 245226580 991439168 0.247 2013-2014 230537456 1089453932 0.211 2014-2015 195162511 1242157302 0.157 2015-2016 258004452 1620127506 0.159 A high ratio of gross profit to sales is a sign of good management as it implies that the cost of production of the firm is relatively low. It may be indicative of a higher sales price without a corresponding increase in the cost of goods sold. It is calculated by using, Chart 9: PROFITABILITY RATIOS: 58
  • 59. INTERPRETATION: From the above Chart 9: The gross profit ratio of 2015-16 is 0.159 and that of 2014-15 is 0.157.When compared with previous year the ratio has been increased by 0.002. 10. NET PROFIT RATIO: 59 RATIO
  • 60. This is also known as net margin. This measures the relationship between net profits and sales of a firm. The net profit measures the percentage of each sale rupee remaining after all costs and expenses including interest and taxes have been deducted. The net profit is indicative of management ability to operate the business with sufficient success. NET PROFIT RATIO = EARNINGS AFTER INTEREST AND TAXES / NET SALES Table 10: NET PROFIT RATIO: YEAR NET PROFIT NET SALES RATIO 2011-2012 2555269 722957732 0.003 2012-2013 6347376 991439168 0.006 2013-2014 8517277 1089453932 0.007 2014-2015 10119736 1242157302 0.008 2015-2016 13815314 1620127506 0.009 From the table it can be justified that the company’s net profit ratio is increasing year by year. Chart 10: NET PROFIT RATIO: 60
  • 61. INTERPRETATION: From the above Chart 10: The net profit ratio of 2015-16 is 0.009 and that of 2014-15 is 0.008 when compared to previous year the net profit ratio has been increased by 0.001. FINDINGS 61
  • 62. 1. The current ratio of 2015-2016 is 2.13 and that of previous year is 2.29. When compared with previous year the current ratio has been decreased by 0.16 which shows that the amount allocated for current assets has been decreased. 2. Net Working Capital of 2015-16 is 0.54 and that of 2014-15 is 0.46 when compared to previous year the Net Working Capital ratio has been increased by 0.08 this shows that the investment on current assets has been increased. 3. The Debt - Equity Ratio of 2015-16 is 2.14 and that of 2014-15 is 2.45 when compared with previous year the ratio has been decreased by 0.31 4. The capital equity ratio of 2011-12 is 5.44 and that of 2014-15 is 3.43. When compared with previous year the ratio has been decreased by 0.3 5. The fixed asset turnover ratio in the year 2015-16 is 9.82 and in the year 2014-15 is 7.8.When compared with previous year the ratio has been increased by 2.02. 6. The current asset turnover ratio of 2015-16 is 4.37 and that of 2014-15 is 5.09. When compared with previous year the ratio has been decreased by 0.72 7. The debtor’s turnover ratio of 2015-16 is 15.74 and that of 2014-15 is 21.72 when compared with the previous year the current years ratio has been decreased by 5.98 8. The creditor’s turnover ratio of 2015-16 is 9.15 and that of 2014-15 is 11.03 when compared to previous year the ratio is decreased by 1.88% 9. The gross profit ratio of 2015-16 is 0.159 and that of 2014-15 is 0.157.When compared with previous year the ratio has been increased by 0.002. 10. The net profit ratio of 2015-16 is 0.009 and that of 2014-15 is 0.008 when compared to previous year the net profit ratio has been increased by 0.001. 62
  • 63. SUGGESTIONS The company rely more on debt rather than equity which shows the company has to reduce debt which is above the standard levels. A high debtor turnover ratio is positive sign for the company but the company’s debtor turnover ratio has been decreasing and the collection period has also been decreased which shows the delayed payment of debtors. A high debtor turnover ratio is an indicative of trade credit management. CONCLUSION 63
  • 64. Based on all the above observations we can conclude that the company is maintaining the financial position in a successful way and only the suggestion is to maintain constant earnings per share ratio which benefits’ the equity share holders. The main purpose of ratio analysis is to measure past performance and project future trends. It is also used for inter-firm and intra-firm comparison as a measure of comparative productivity. The financial analyst X-rays the financial conditions of a concern by the use of various ratios and if the conditions are not found to be favorable, suitable steps can be taken to overcome the limitations. 64