SlideShare ist ein Scribd-Unternehmen logo
1 von 33
Downloaden Sie, um offline zu lesen
MNRAS 451, 3768–3800 (2015) doi:10.1093/mnras/stv1151
Far-ultraviolet morphology of star-forming filaments in cool core
brightest cluster galaxies
G. R. Tremblay,1,2‹
† C. P. O’Dea,3,4
S. A. Baum,3,4,5,6
R. Mittal,6,7
M. A. McDonald,8‡
F. Combes,9
Y. Li,10
B. R. McNamara,11,12
M. N. Bremer,13
T. E. Clarke,14
M. Donahue,15
A. C. Edge,16
A. C. Fabian,17
S. L. Hamer,9
M. T. Hogan,11
J. B. R. Oonk,18
A. C. Quillen,19
J. S. Sanders,20
P. Salom´e9
and G. M. Voit15
Affiliations are listed at the end of the paper
Accepted 2015 May 18. Received 2015 May 14; in original form 2015 April 20
ABSTRACT
We present a multiwavelength morphological analysis of star-forming clouds and filaments in
the central ( 50 kpc) regions of 16 low-redshift (z < 0.3) cool core brightest cluster galaxies.
New Hubble Space Telescope imaging of far-ultraviolet continuum emission from young
( 10 Myr), massive ( 5 M⊙) stars reveals filamentary and clumpy morphologies, which we
quantify by means of structural indices. The FUV data are compared with X-ray, Lyα, narrow-
band Hα, broad-band optical/IR, and radio maps, providing a high spatial resolution atlas of
star formation locales relative to the ambient hot (∼107–8
K) and warm ionized (∼104
K) gas
phases, as well as the old stellar population and radio-bright active galactic nucleus (AGN)
outflows. Nearly half of the sample possesses kpc-scale filaments that, in projection, extend
towards and around radio lobes and/or X-ray cavities. These filaments may have been uplifted
by the propagating jet or buoyant X-ray bubble, or may have formed in situ by cloud collapse at
the interface of a radio lobe or rapid cooling in a cavity’s compressed shell. The morphological
diversity of nearly the entire FUV sample is reproduced by recent hydrodynamical simulations
in which the AGN powers a self-regulating rain of thermally unstable star-forming clouds that
precipitate from the hot atmosphere. In this model, precipitation triggers where the cooling-
to-free-fall time ratio is tcool/tff ∼ 10. This condition is roughly met at the maximal projected
FUV radius for more than half of our sample, and clustering about this ratio is stronger for
sources with higher star formation rates.
Key words: galaxies: active – galaxies: clusters: general – galaxies: clusters: intracluster
medium – galaxies: star formation.
1 INTRODUCTION
Many giant elliptical, groups, and clusters of galaxies inhabit an
X-ray bright halo of 107
K plasma whose core radiative lifetime
is much shorter than its age. Absent a heating mechanism, simple
models predict that the rapid cooling of gas within this ∼100 kpc
‘cool core’ (CC) should result in a long-lived cascade of multiphase
clouds collapsing into the galaxy at its centre, fuelling extreme star
formation rates (SFRs; 102
–103
M⊙ yr−1
) amid massive reservoirs
(∼1012
M⊙) of cold molecular gas (e.g. review by Fabian, John-
⋆E-mail: grant.tremblay@yale.edu
† Einstein Fellow.
‡ Hubble Fellow.
stone & Daines 1994b). Although brightest cluster galaxies (BCGs)
embedded in CC clusters do preferentially harbour these supposed
cooling flow mass sinks, the observed SFRs and cold gas masses are
often orders of magnitude below predictions, and high-resolution
X-ray spectroscopy of the intracluster medium (ICM; e.g. Sarazin
1986) is only consistent with reduced cooling at ∼10 per cent of the
expected classical rates (e.g. review by Peterson & Fabian 2006).
The mechanical dissipation of active galactic nucleus (AGN)
power is now routinely invoked by theorists and observers as a
solution to the problem, as the average associated energy budget
for groups and clusters is large enough to inhibit or replenish
cooling flow radiative losses not only at late epochs (e.g. Bˆırzan
et al. 2004, 2008; Best et al. 2006, 2007; Dunn & Fabian 2006;
Rafferty et al. 2006; Mittal et al. 2009; Dong, Rasmussen &
Mulchaey 2010), but perhaps over a significant fraction of cosmic
C⃝ 2015 The Authors
Published by Oxford University Press on behalf of the Royal Astronomical Society
atSpaceTelescopeScienceInstituteonJuly9,2015http://mnras.oxfordjournals.org/Downloadedfrom
FUV morphology of cool core BCGs 3769
time (e.g. Hlavacek-Larrondo et al. 2012; Simpson et al. 2013;
McDonald et al. 2013b). The paradigm is motivated by strong cir-
cumstantial evidence, including nearly ubiquitous observations of
radio-bright AGN outflows driving shocks and excavating kpc-scale
buoyant cavities in the ambient X-ray gas, acting as lower limit
calorimeters to the often extreme ( 1046
erg s−1
) AGN kinetic
energy input (e.g. reviews by McNamara & Nulsen 2007, 2012;
Sun 2012). Yet amid panoramic supporting evidence (reviewed by
Fabian 2012), the physics that governs the spatial distribution and
thermal coupling of AGN mechanical energy to the multiphase
(10–107
K) gaseous environment remains poorly understood, and
cooling flow alternatives invoking (e.g.) wet mergers, thermal con-
duction, and evaporation have been a persistent matter of debate
(e.g. Bregman & David 1988; Sparks, Macchetto & Golombek
1989; Sparks 1992, 1997; Fabian, Canizares & Boehringer 1994a;
Soker 2003; Voit et al. 2008; Sparks et al. 2009, 2012; Voit 2011;
Smith et al. 2013; Canning et al. 2015; Voit & Donahue 2015).
Although often invoked exclusively as a star formation quench-
ing mechanism, observations have long demonstrated that AGN
mechanical feedback does not completely offset radiative losses or
establish an impermeable ‘entropy floor’, instead permitting resid-
ual cooling either at constant low (∼10 per cent) rates (e.g. Trem-
blay et al. 2012a,b), or in elevated episodes as the AGN varies
in power (e.g. O’Dea et al. 2010; Tremblay 2011). Relative to
field galaxies or those in non-CC clusters, BCGs in CCs prefer-
entially harbour radio sources and kpc-scale filamentary forbidden
and Balmer emission line nebulae amid 109
–1011
M⊙ repositories
of vibrationally excited and cold molecular gas (Heckman 1981;
Hu, Cowie & Wang 1985; Baum 1987; Heckman et al. 1989; Burns
1990; Jaffe & Bremer 1997; Donahue et al. 2000; Edge 2001;
Edge & Frayer 2003; Salom´e & Combes 2003; McNamara, Wise &
Murray 2004; Egami et al. 2006; Salom´e et al. 2006; Edwards et al.
2007; von der Linden et al. 2007; Wilman, Edge & Swinbank 2009;
Edge et al. 2010a,b; Salom´e et al. 2011; McNamara et al. 2014;
Russell et al. 2014). Low to moderate levels (∼1 to 10 M⊙ yr−1
)
of star formation appear to be ongoing amid these mysteriously
dusty (O’Dea et al. 2008; Quillen et al. 2008; Edge et al. 2010a,b;
Mittal et al. 2011; Rawle et al. 2012; Tremblay et al. 2012b), poly-
cyclic aromatic hydrocarbon (PAH)-rich (Donahue et al. 2011) cold
reservoirs on 50 kpc scales in clumpy and filamentary distribu-
tions (e.g. Johnstone, Fabian & Nulsen 1987; McNamara et al.
2004; O’Dea et al. 2004, 2008, 2010; Rafferty et al. 2006; Rafferty,
McNamara & Nulsen 2008; McDonald et al. 2011b; Tremblay et al.
2014). The ionization states of the nebulae have been a mystery for
three decades, and debate continues over the roles played by stellar
photoionization, shocks, thermal conduction, mixing, and cosmic
ray heating (e.g. Voit & Donahue 1997; Ferland et al. 2009; Sparks
et al. 2009, 2012; McDonald et al. 2010; O’Dea et al. 2010; Fabian
et al. 2011b; McDonald, Veilleux & Rupke 2011a; Mittal et al. 2011;
Oonk et al. 2011; Tremblay 2011; Johnstone et al. 2012). Whatever
the case, there is strong evidence that young stars might play an
important (although not exclusive) role in dictating the physics of
both the warm (∼104
K) and cold (∼100 K) phases of the filaments
(Voit & Donahue 1997; Canning et al. 2010, 2014; McDonald et al.
2010, 2011a; O’Dea et al. 2010).
Recent work on star formation in CC BCGs has demonstrated its
efficacy as an observable tracer for otherwise unobservable phys-
ical processes regulating the heating and cooling balance in hot
atmospheres. While low in general and effectively zero in some
cases, the observed SFRs in CC BCGs are sometimes high enough
( 100 M⊙ yr−1
) to match condensation rates from the X-ray halo
(O’Dea et al. 2008). Emergent work at higher redshift has shown
that the long-ago-predicted classical cooling flows may exist after
all, forming stars at many hundreds of solar masses per year (i.e. the
Phoenix cluster; McDonald et al. 2012, 2013a, 2014; see also work
on Abell 1068 by McNamara, Wise & Murray 2004; Wise, McNa-
mara & Murray 2004). Cooling flows may begin to form stars when
the central entropy or cooling time drops below a critical threshold
(e.g. Voit & Donahue 2005; Cavagnolo et al. 2008; Rafferty et al.
2008; Voit et al. 2008, 2015a; Guo & Mathews 2014), or when the
ratio of cooling-to-dynamical times permits a self-regulating ‘rain’
of thermally unstable, spatially inhomogeneous clouds condensing
from the hot atmosphere (Gaspari, Ruszkowski & Sharma 2012;
McCourt et al. 2012; Sharma et al. 2012a; Li & Bryan 2014a,b;
Brighenti, Mathews & Temi 2015; Li et al. 2015; Voit & Donahue
2015; Voit et al. 2015a). There is also some observational evi-
dence for enhanced cooling in spatially confined ‘cooling channels’
where AGN heating may be locally inefficient (see e.g. evidence
for enhanced cooling in regions perpendicular to the projected cav-
ity/radio ‘heating axis’ in Perseus and Abell 2597; Lim, Ao &
Dinh-V-Trung 2008; Tremblay et al. 2012b).
Direct observations of young stars in BCGs can test predictions
of these various models. To that end, this paper presents a morpho-
logical analysis of new and archival Hubble Space Telescope (HST)
far-ultraviolet (FUV) continuum images of young, massive stars
in 16 low-redshift (z < 0.29) CC BCGs. X-ray, Lyα, Hα, broad-
band optical, and radio data are also leveraged to create an ‘atlas’
of star formation locales relative to the ambient hot ( 107
K) and
warm ionized (∼104
K) gas phases, as well as the old stellar popu-
lation and radio-bright AGN outflows. In Section 2, we discuss the
sample selection, observations, and data reduction. Our results are
presented in Section 3, discussed in Section 4, and summarized in
Section 5. An appendix contains additional multiwavelength over-
lay figures (see Figs A1–A16) for all sources in our sample. We
will frequently abbreviate target names in an obvious manner (i.e.
Abell 2597 is written as A2597, etc.). Unless otherwise noted, we
use the names of the parent clusters to refer to their central BCGs
(i.e. ‘Perseus’ refers to its BCG, NGC 1275). Cosmology-dependent
physical quantities quoted in this paper assume a flat cold dark
matter model wherein H0 = 70 km s−1
Mpc−1
, M = 0.3, and
= 0.7. Errors are quoted at the 1σ level, unless otherwise noted.
2 SAMPLE, OBSERVATIONS,
AND DATA REDUCTION
2.1 Sample selection
The 16 low-redshift (z < 0.3) CC BCGs that make up our sample
are listed in Table 1. All are well studied in the literature, and
enjoy nearly complete cross-spectrum (radio through X-ray) data
coverage from many ground- and space-based facilities, including
the Chandra X-ray Observatory, HST, Spitzer Space Telescope, and
Herschel Space Observatory. Eleven of these targets constitute the
Herschel CC clusters Open Time Key Project sample of A. Edge and
collaborators (Edge et al. 2010a,b; Mittal et al. 2011, 2012; Rawle
et al. 2012; Tremblay et al. 2012a,b; Hamer et al. 2014), selected to
span a wide range of both cooling flow and BCG physical properties.
The remaining five targets are from the non-overlapping sample of
O’Dea et al. (2010), selected from the Quillen et al. (2008) sample
on the basis of elevated infrared-estimated SFRs.
Although biased, our sample spans decade-wide ranges of X-ray
mass deposition and SFRs, Balmer and forbidden line luminosi-
ties, as well as AGN, radio source, and X-ray cavity power (in-
cluding sources that lack detected cavities). Its constituent galaxies
MNRAS 451, 3768–3800 (2015)
atSpaceTelescopeScienceInstituteonJuly9,2015http://mnras.oxfordjournals.org/Downloadedfrom
3770 G. R. Tremblay et al.
Table 1. Basic information on the 16 low-redshift cool core brightest cluster galaxies that make up our sample. (1) Source name (note that while we
list the most commonly used name for the cluster, the actual target studied in this paper is the central brightest cluster galaxy of the named cluster);
(2) non-exhaustive list of other commonly used names for the cluster, central brightest cluster galaxy, or central radio source; (3) right ascension and
(4) declination for the J2000.0 epoch; (5) redshift (z) as listed in the NASA/IPAC Extragalactic data base (NED); (6) the number of kiloparsecs (kpc)
that correspond to 1 arcsec at the given redshift in our assumed cosmology (H0 = 70 km s−1 Mpc−1); (7) the associated figure number(s) where the
multiwavelength data for the listed BCG can be viewed. The FUV continuum images for the entire sample can be viewed at a glance in Fig. 1.
RA Dec. Redshift Shown in
Source name Associated name(s) (J2000) (J2000) (z) kpc arcsec−1 Figure #
(1) (2) (3) (4) (5) (6) (7)
Abell 11 – 00h12m44.s8 −16◦26′19′′ 0.1660 2.81 1, 2, A1
Abell 1068 ZwCl 1037.6+4013 10h40m47.s1 +39◦57′19′′ 0.1375 2.40 1, 7, A2
Abell 1664 RX J1303.7−2414 13h03m41.s8 −24◦13′06′′ 0.1283 2.27 1, 2, 8, A3
Abell 1795 ZwCl 1346.9+2655 13h49m00.s5 +26◦35′07′′ 0.0625 1.19 1, 3, 10, A4
Abell 1835 ZwCl 1358.5+0305 14h01m02.s0 +02◦51′32′′ 0.2532 3.91 1, 2, 7, 11, A5
Abell 2199 NGC 6166, 3C 338 16h28m38.s5 +39◦33′06′′ 0.0302 0.60 1, 9, A6
Abell 2597 PKS 2322−122 23h25m18.s0 −12◦06′30′′ 0.0821 1.53 1, 3, 8, 2, 10, 11, A7
Centaurus NGC 4696, Abell 3526, PKS 1245-41 12h48m49.s2 +41◦18′39′′ 0.0099 0.20 1, 9, 11, A8
Hydra A Abell 780, 3C 218 09h18m05.s7 −12◦05′44′′ 0.0549 1.05 1, 3, 8, 10, 11, 12, A9
Perseus NGC 1275, Abell 426, 3C 84 03h19m48.s1 +41◦30′42′′ 0.0176 0.35 1, 3, 11, A10
PKS 0745−191 – 07h47m31.s3 −19◦17′40′′ 0.1028 1.89 1, 11, A11
RX J1504.1−0248 – 15h04m07.s5 −02◦48′16′′ 0.2153 3.46 1, 7, A12
RX J2129.6+0005 – 21h29m37.s9 +00◦05′39′′ 0.2350 3.70 1, 2, A13
ZwCl 0348 ZwCl 0104.4+0048 01h06m58.s0 +01◦04′01′′ 0.2545 3.93 1, 2, A14
ZwCl 3146 ZwCl 1021.0+0426 10h23m39.s6 +04◦11′10′′ 0.2906 4.32 1, 2, A15
ZwCl 8193 ZwCl 1715.5+4229 17h17m19.s0 +42◦26′57′′ 0.1829 3.04 1, 2, A16
therefore occupy unique milestones in the supposed ICM cooling
and AGN heating feedback cycle over the last ∼3 Gyr of cosmic
history (redshifts 0.0099 ≤ z ≤ 0.2906), including sources with
high and low SFRs, strong and weak AGN feedback signatures,
as well as many intermediate locales between these extremes. A
non-exhaustive summary of these various properties can be found
in Table 2.
2.2 New observations
Along with more than 50 multiwavelength archival observations,
this paper presents five new FUV continuum and two new broad-
band optical HST observations, all of which are summarized in
Table 3. Although much of these data have been rereduced in a
homogeneous way for this analysis (see Section 2.3), we refer the
reader to the references listed in the rightmost column of Table 3
for more observational details pertaining to the archival data.
The new HST FUV and optical images we present were obtained
in Cycle 19 as part of General Observer program 12220 (PI: R.
Mittal). The line-free FUV continuum data were obtained with
the Solar Blind Channel (SBC) Multi-Anode Microchannel Array
(MAMA) detector of the Advanced Camera for Surveys (ACS;
Clampin et al. 2004). Total exposure times for each target were
roughly ∼2700 s (roughly one HST orbit minus overheads), and
the observations were carried out with a standard three-point dither
pattern. Depending on target redshift, we used the F140LP, F150LP,
and F165LP long-pass filters with pivot wavelengths of 1527, 1611,
and 1758 Å, respectively. These filter choices ensured that Lyα
emission did not fall within their bandpasses, which have similar
red cutoff wavelengths of ∼2000 Å, but different blue cutoff (or
minimum) wavelengths of 1370, 1470, and 1650 Å, respectively.
The plate scale for the SBC is 0.034 × 0.030 arcsec2
pixel−1
, and
the detector field of view is 346 × 308 arcsec2
. Although we will not
discuss the archival FUV observations for all other sources, we note
that the observing strategy employed for those data sets was very
similar (if not identical) to that used for our new FUV observations.
To fill a data coverage gap, we also obtained two new line-free
optical images of Hydra A and RX J1504.1−0248 (hereafter R1504)
using the UVIS channel of HST’s Wide Field Camera 3 (WFC3;
Dressel 2012). As for the FUV images, a three-point dither pattern
was used over a ∼2500 s total exposure time for each target. The
F814W and F689M filters with pivot wavelengths of 8024 and 6876
Å were used for Hydra A and R1504, respectively. The widths of
these passbands (1536 and 683 Å) forbid optical line contamination
(though note that some archival optical images we use for other
sources do contain optical line emission like Hα+[N II]). More
details on these new HST observations can be found in Mittal,
Whelan & Combes (2015).
2.3 Data reduction
All new or archival HST FUV and optical data used in this anal-
ysis were retrieved from either the Mikulski Archive for Space
Telescopes (MAST1
) or the Hubble Legacy Archive2
, and MAST
products were reduced using the standard on-the-fly recalibration
pipelines. Chandra X-ray observations were obtained as level one
products from the Chandra Data Archive.3
Exposures were re-
duced, reprojected, exposure-corrected, and merged using the stan-
dard CIAO (Fruscione et al. 2006) v4.5 scripts (chandra_repro,
reproject_obs, flux_obs) with v4.5.5.1 of the calibration data
base. Finally, while many high-resolution Very Large Array (VLA)
radio maps were kindly provided by colleagues, some raw data
sets (for A1068, RX J1504, and PKS 0745) had to be obtained from
the National Radio Astronomy Observatory (NRAO) Archive.4
The
NRAO AIPS
5
package was used for (self-)calibration, imaging, and
deconvolution of these data.
1 http://archive.stsci.edu/
2 http://hla.stsci.edu/
3 http://asc.harvard.edu/cda/
4 https://archive.nrao.edu/
5 http://www.aips.nrao.edu/
MNRAS 451, 3768–3800 (2015)
atSpaceTelescopeScienceInstituteonJuly9,2015http://mnras.oxfordjournals.org/Downloadedfrom
FUV morphology of cool core BCGs 3771
Table 2. A summary of physical properties of the BCGs in our sample, including their surrounding ∼100 kpc-scale environment. References for the quantities
presented here can be found below this table. (1) Target name; (2) infrared-estimated star formation rate (SFR), typically from Spitzer or Herschel. SFRs
flagged with a † symbol may suffer from a non-negligible Type II AGN contribution to the IR luminosity, in which case the IR-estimated SFR may be somewhat
overestimated. Note that SFR estimates vary greatly depending on the method, model, and waveband used. We demonstrate this in column (3), which shows an
average of all published SFRs for each source (see Mittal et al. 2015 for the specific values used in these averages); (4) lowest and highest X-ray mass deposition
rates that have been published for the listed source. Most of these come from Chandra upper limits, rather than more reliable XMM–Newton Reflection Grating
Spectrometer data; (5) cold molecular hydrogen gas mass in units of × 109 M⊙; (6) central ICM entropy in units of keV cm2; (7) 1.4 GHz radio luminosity,
based on NVSS or Parkes L-band flux densities; (8) jet mechanical power roughly estimated from (7) using the scaling relation of Cavagnolo et al. (2010); (9)
X-ray cavity power estimated from Chandra observations.
ICM cooling proxies AGN heating proxies
SFR (IR est.) Published SFRs ˙Mcool MH2
K0 P1.4GHz ∼Pjet (C10 scaling) Pcavity (X-ray)
Source name (M⊙ yr−1
) (M⊙ yr−1
) (M⊙ yr−1
) (× 109
M⊙) (keV cm2
) (× 1040
erg s−1
) (× 1044
erg s−1
) (× 1044
erg s−1
)
(1) (2) (3) (4) (5) (6) (7) (8) (9)
Abell 11 35(a)
35 – 1.1 – 9.57 ± 0.23 4.42 –
Abell 1068 188(a)†
80 ± 60 40–150 43 72 1.34 ± 0.03 1.01 –
Abell 1664 15(a)
16 ± 7 – 23 14.4 2.13 ± 0.06 1.43 0.7 ± 0.3
Abell 1795 8(b)
8 ± 8 1–21 6 19 11.73 ± 0.32 5.15 16.0+2.3
−0.5
Abell 1835 138(c)
119 ± 83 – 90 11.4 7.85 ± 0.16 3.81 18.0+19.0
−6.0
Abell 2199 0.6(b)
0.2 ± 0.1 0–3 1.4 13.3 10.45 ± 0.33 4.72 2.7+2.5
−0.6
Abell 2597 5(d)
5 ± 8 20–40 1.8 10.6 42.04 ± 1.11 13.42 1.9+1.0
−0.8
Centaurus 0.2(b)
0.2 ± 0.1 2.6–2.9 <1 2.25 1.16 ± 0.03‡ 0.91 0.08+5.8
−1.8
Hydra A 4(b)
8 ± 7 11–21 3.2 13.3 395.46 ± 11.37 72.08 6.5 ± 0.5
Perseus 24(e)
30 ± 23 12–29 8.5 19.4 21.54 ± 0.63 8.13 1.5+1.0
−0.3
PKS 0745−191 17(a)
70 ± 94 80–260 4.5 12.4 85.53 ± 2.58 22.86 17.0+14.0
−3.0
RX J1504.1−0248 140(f)
237 ± 92 – 10 13.1 11.05 ± 0.34 4.93 –
RX J2129.6+0005 13(a)
9 ± 5 – – 21 5.70 ± 0.19 3.00 –
ZwCl 0348 52(a)
52 – – – 0.44 ± 0.01 0.44 –
ZwCl 3146 67(b)
67 ± 59 420–780 80 11.4 2.60 ± 0.12 1.66 58.0+68.0
−15.0
ZwCl 8193 59(a)
59 – – – 16.75 ± 0.38 6.73 –
References: – (1) IR-estimated SFRs are adopted from: (a) O’Dea et al. (2008); (b) Hoffer et al. (2012); (c) McNamara et al. (2006); (d) Donahue et al. (2007);
(e) Mittal et al. (2012); and (f) Ogrean et al. (2010); (3) Mittal et al. (2015); (4 and 9) X-ray mass deposition rates and cavity powers are collected from Bˆırzan
et al. (2004); Dunn & Fabian (2006); Rafferty et al. (2006); Wise et al. (2007); Tremblay et al. (2012b); Kirkpatrick et al. (2009). (5) Cold molecular gas masses
are adopted from Edge (2001); Edge & Frayer (2003); Salom´e & Combes (2003); Tremblay et al. (2012b). (6) Central ICM entropy K0 is adopted from the
main table of the ACCEPT sample, see, e.g. Cavagnolo et al. (2009); (7) K-corrected 1.4 GHz luminosities are based on flux densities from NVSS (Condon
et al. 1998), except in the case of Centaurus, which uses the 1.4 GHz flux density from the Parkes Radio Telescope. The flux-to-luminosity conversion is given
in Section 2.3; (8) Cavagnolo et al. (2010).
This paper also presents some data sets that have not been rere-
duced for this analysis. Data reduction and continuum-subtraction
details for the HST ACS/SBC Lyα images shown in Fig. 2 can be
found in O’Dea et al. (2010). Reduction of the Maryland-Magellan
Tunable Filter (MMTF) narrow-band Hα maps shown in Fig. 3 is
described in McDonald et al. (2010). The 1.4 Ms Chandra X-ray
map of Perseus (shown in Fig. A10) is discussed at length in Fabian
et al. (2011a). L-band radio luminosities quoted in Table 2 use
flux densities from the NRAO VLA Sky Survey (NVSS; Condon
et al. 1998) assuming the relation P1.4 GHz = 4πD2
LSν0 ν0 (1 + z)α−1
,
where DL is the luminosity distance to the source, Sν0 is the 1.4 GHz
radio flux density integrated over the source area, ν0 = 1.4 GHz is
the frequency of the observation, and α is the radio spectral index
used in the (negligible) K-correction, assumed here to be α = 0.8
if Sν ∝ ν−α
(these luminosities are insensitive to choice of α given
the narrow and low-redshift range of our targets).
All images were spatially aligned using IRAF shifting and regis-
tration tasks. To aid viewing of certain X-ray or optical morpho-
logical features, in many cases we show unsharp masks wherein
the ‘smooth’ X-ray or optical light has been subtracted from
the surface brightness map, highlighting residual edge structures.
X-ray unsharp masks were made in the CIAO environment by Gaus-
sian smoothing exposure-corrected maps with both small and large
kernel sizes. The heavily smoothed map was then subtracted from
the lightly smoothed map, and the residual image was normalized
by the sum of both smoothed maps. Unsharp masks of the FUV and
optical HST data were made using essentially the same technique
in the IRAF environment.
2.4 The SBC red leak and other contaminants
The ACS SBC suffers from a poorly characterized and highly vari-
able red leak (e.g. Ubeda et al. 2012), wherein the FUV long-pass fil-
ters can permit a substantial amount of ‘red’ (i.e. optical) interloper
flux through the bandpass, contaminating what should otherwise be
a pure FUV image. The effect is extremely difficult to correct for in
the absence of multiband UV imaging, as it depends on both time
and detector temperature, varying by as much as 30 per cent across
five consecutive orbits. There is some evidence that the effect has
decreased since 2008, and current estimates suggest that, at worst,
it may artificially boost the FUV count rate by about 10–20 per cent
(STScI ACS team, private communication).
While one must therefore be wary when interpreting SBC FUV
images of otherwise red, luminous elliptical galaxies, solace is
found in the fact that the contributors of red-leak photons are al-
most exclusively solar- and later type stars. This means that the
effect can only significantly contaminate by means of a smooth,
diffuse, and very faint background whose surface brightness tracks
the underlying optical isophotes of the host galaxy’s old stellar com-
ponent. We are therefore able to circumvent the issue in this paper
MNRAS 451, 3768–3800 (2015)
atSpaceTelescopeScienceInstituteonJuly9,2015http://mnras.oxfordjournals.org/Downloadedfrom
3772 G. R. Tremblay et al.
Table 3. A summary of the new and archival observations used in this analysis. Those targets for which new FUV continuum or optical data are presented are
highlighted in boldface. Where applicable, a reference is given to the earliest publication in which the data were first directly analysed.
Source name λ regime Facility Inst./mode
Exp. time/rms
noise Obs./prog. ID Reference/comment
Abell 11 FUV cont. HST ACS/SBC F150LP 1170 s 11230 O’Dea et al. (2010)
Lyα HST ACS/SBC F125LP 1170 s 11230 O’Dea et al. (2010)
Optical HST WFPC2 F606W 800 s 8719 O’Dea et al. (2010)
X-ray ROSAT – – – All Sky Survey
8.46+1.46 GHz radio VLA A, B array 74 µJy AB0878, AL0578 O’Dea et al. (2010)
Abell 1068 FUV cont. HST ACS/SBC F150LP 2766 s 12220 New; Mittal et al. (2015)
Optical HST WFPC2 F606W 600 s 8301 –
X-ray Chandra ACIS-S 26.8 ks 1652 McNamara et al. (2004); Wise
et al. (2004)
8.46 GHz radio VLA A array – AE0117 –
Abell 1664 FUV cont. HST ACS/SBC F150LP 1170 s 11230 O’Dea et al. (2010)
Lyα HST ACS/SBC F125LP 1170 s 11230 O’Dea et al. (2010)
Optical HST WFPC2 F606W 1800 s 11230 O’Dea et al. (2010)
X-ray Chandra ACIS-S 36.6 ks 7901 Kirkpatrick et al. (2009)
4.86 GHz radio VLA C array 100 µJy AE0099 O’Dea et al. (2010)
Abell 1795 FUV cont. HST ACS/SBC F140LP 2394 s 11980 –
Optical HST WFPC2 F555W 1600 s 5212 –
Hα narrow band Baade 6.5m IMACS/MMTF 1200 s – McDonald & Veilleux (2009)
X-ray Chandra ACIS-S 30 ks 10900 etc. –
8.4 GHz radio VLA A, C, A/D arrays 18 hr AG0273 Ge & Owen (1993)
Abell 1835 FUV cont. HST ACS/SBC F165LP 1170 s 11230 O’Dea et al. (2010)
Lyα HST ACS/SBC F140LP 1170 s 11230 O’Dea et al. (2010)
Optical HST WFPC2 F702W 7500 s 8249 –
X-ray Chandra ACIS-I 117.9 ks 6880 –
– – – 36.3 ks 6881 –
– – – 39.5 ks 7370 –
4.76 GHz radio VLA A, C arrays 2 hr/47 µJy AT0211 Govoni et al. (2009)
Abell 2199 FUV cont. HST ACS/SBC F140LP 2767 s 12220 New; Mittal et al. (2015)
Optical HST WFPC2 F555W 5200 s 7265 –
X-ray Chandra ACIS-I 120 ks 10748 etc. Nulsen et al. (2013)
5 GHz radio VLA B, C, D arrays 6 hr AG0269 Ge & Owen (1994)
Abell 2597 FUV cont. HST ACS/SBC F150LP 8141 s 11131 Oonk et al. (2010); Tremblay
et al. (2012b)
Lyα HST STIS F25SRF2 1000 s 8107 O’Dea et al. (2004); Tremblay
et al. (2012b)
Optical and Hα HST WFPC2 F702W 2100 s 6228 Holtzman et al. (1996)
Hα narrow band Baade 6.5 m IMACS/MMTF 1200 s – McDonald et al. (2011a,b)
X-ray Chandra ACIS-S 39.8 ks 922 McNamara et al. (2001);
Tremblay et al. (2012a,b)
– – – 112 ks 6934, 7329 Tremblay et al. (2012a,b)
8.4 GHz radio VLA A array 15 min AR279 Sarazin et al. (1995)
330 MHz radio VLA A array 3 hr AC674 Clarke et al. (2005)
Centaurus FUV cont. HST ACS/SBC F150LP 1780 s 11681 Mittal et al. (2011)
Optical HST ACS/WFC F814W 8060 s 9427 Harris et al. (2006)
– – ACS/WFC F435W 8654 s 9427 Harris et al. (2006)
– – WFC3 F160W 392 s 11219 Baldi et al. (2010)
X-ray Chandra ACIS-S 200 ks 504,5310,4954,4955 Fabian et al. (2005)
1.46 GHz radio VLA A, B/A 1.5 hr AT211 Taylor, Fabian & Allen (2002)
Hydra A FUV cont. HST ACS/SBC F140LP 2709 s 12220 New; Mittal et al. (2015)
Optical HST ACS/WFC F814W 2367 s 12220 New; Mittal et al. (2015)
Hα narrow band Baade 6.5m IMACS/MMTF 1200 s – McDonald et al. (2010, 2011b)
X-ray Chandra ACIS-S 196 ks 4969, 4970 Nulsen et al. (2005)
4.6 GHz radio VLA A, A/B, B, C, D 9 hr AL0032 Taylor et al. (1990)
Perseus FUV cont. HST ACS/SBC F140LP 2552 s 11207 Fabian et al. (2008)
– – STIS F25SRF2 1000 s 8107 Baum et al. (2005)
Optical and Hα HST ACS/WFC F625W 4962 s 10546 Fabian et al. (2008)
Hα narrow band KPNO WIYN 3.5m S2kB CCD/KP1495 3200 s Conselice, Gallagher & Wyse
(2001)
X-ray Chandra ACIS-S and −I 1.4 Ms 11713 etc. Fabian et al. (2011a)
1.4 GHz radio VLA C, D, C/D arrays 3 min AT149A Condon et al. (1996)
PKS 0745-191 FUV cont. HST ACS/SBC F140LP 2715 s 12220 New; Mittal et al. (2015)
Optical HST WFPC2 F814W 1200 s 7337 Sand et al. (2005)
X-ray Chandra ACIS-S 50 ks 508,2427 Fabian (1999)
8.4 GHz radio VLA A array 2 hr BT024 Taylor, Barton & Ge (1994)
MNRAS 451, 3768–3800 (2015)
atSpaceTelescopeScienceInstituteonJuly9,2015http://mnras.oxfordjournals.org/Downloadedfrom
FUV morphology of cool core BCGs 3773
Table 3 – continued
Source name λ regime Facility Inst./mode
Exp. time/rms
noise Obs./prog. ID Reference/comment
RX J1504.1-0248 FUV cont. HST ACS/SBC F165LP 2700 s 12220 New; Mittal et al. (2015)
Optical HST WFC3/UVIS F689M 2637 s 12220 New; Mittal et al. (2015)
X-ray Chandra ACIS-I 40 ks 5793 B¨ohringer et al. (2005); Ogrean
et al. (2010)
8.46 GHz radio VLA A array 3 hr AB1161 –
RX J2129.6+0005 FUV cont. HST ACS/SBC F165LP 1170 s 11230 O’Dea et al. (2010)
Lyα HST ACS/SBC F140LP 1170 s 11230 O’Dea et al. (2010)
Optical HST WFPC2 F606W 1000 sec 8301 Donahue et al. (2007)
X-ray Chandra ACIS-I 30 ks 9370 –
8.46 GHz radio VLA A array 50 µJy AE117 O’Dea et al. (2010)
ZwCl 0348 FUV cont. HST ACS/SBC F165LP 1170 sec 11230 O’Dea et al. (2010)
Lyα HST ACS/SBC F140LP 1170 sec 11230 O’Dea et al. (2010)
Optical HST WFPC2 F606W 700 sec 11312 Smith et al. (2010)
X-ray Chandra ACIS-S 50 ksec 10465 –
4.86 GHz radio VLA A/B array 66 µJy AK359 O’Dea et al. (2010)
ZwCl 3146 FUV cont. HST ACS/SBC F165LP 1170 sec 11230 O’Dea et al. (2010)
Lyα HST ACS/SBC F140LP 1170 sec 11230 O’Dea et al. (2010)
Optical HST WFPC2 F606W 1000 sec 8301 Donahue et al. (2007)
X-ray Chandra ACIS-I 90 ksec 909,9371 Boschin (2002)
4.86 GHz radio VLA A/B array 50 µJy ACTST O’Dea et al. (2010)
ZwCl 8193 FUV cont. HST ACS/SBC F150LP 1170 sec 11230 O’Dea et al. (2010)
Lyα HST ACS/SBC F140LP 1170 sec 11230 O’Dea et al. (2010)
Optical HST WFPC2 F606W 1900 sec 11230 O’Dea et al. (2010)
X-ray ROSAT – – – All Sky Survey
8.46 GHz radio VLA A array 180 µJy AE117 O’Dea et al. (2010)
by quantitatively and qualitatively interpreting only high surface
brightness, spatially anisotropic FUV-bright clumps and filaments,
to which the red leak cannot significantly contribute beyond a slight
increase in count rate that is effectively uniform across such struc-
tures. The same argument applies for highly variable contamination
from the old stellar ‘UV upturn’ population (see e.g. O’Connell
1999, for a review). One can therefore be confident that the clumpy
and filamentary kpc-scale emission ubiquitously seen in our images
(see Fig. 1) is almost entirely due to young ( 10 Myr), massive
( 5 M⊙) stars. We nevertheless caution against overinterpretation
of the smooth, diffuse emission seen in a few of our images (Abell
2199, for example6
), and stress that no quantitative plots or scien-
tific conclusions presented in this paper are based in any way on
this diffuse emission.
3 RESULTS
The FUV continuum images for our full sample are presented in
Fig. 1. The scales over which FUV emission is detected vary from
500 pc (Centaurus) to 67 kpc (A1795). Mean and median largest
angular sizes are 30 and 33 kpc, respectively. Estimated SFRs range
6 Abell 2199 and Centaurus are the only two sources in our sample for
which the SBC red leak may make a dominant contribution to observed
morphology. As a test, we have scaled the V-band optical image of A2199
by a factor consistent with the known range of reasonable FUV/optical
colours (discussed at length in e.g. Oonk et al. 2011), then subtracted this
scaled image from the FUV map. We are unable to rule out the possibility
that all emission seen in the A2199 ‘FUV’ image is a combination of red
leak from the underlying old stellar component, plus a central FUV point
source associated with the AGN. The SFR in this source may therefore be
effectively zero. The same is true for Centaurus, however all other sources
in our sample are dominated by bright FUV clumps and filaments whose
morphology will be unaffected by the red leak.
from effectively zero or ≪0.1 M⊙ yr−1
(Centaurus, RX J2129,
A2199) to ∼150 M⊙ yr−1
(A1068, A1835, RX J1504). These and
other properties such as cold molecular gas mass, X-ray estimated
mass deposition rates, radio source power, and X-ray cavity power
are summarized for all targets in Table 2.
The FUV morphological analyses in the sections below come
with an important caveat: FUV emission is highly sensitive to
extinction by dust. The FUV emission that we do detect likely
stems only from the outermost layers of dense, dusty star-forming
clouds, which are themselves obscured by intervening dust along
the line of sight. As the FUV is particularly sensitive to young
stars less than ∼10 Myr old and more massive than ∼5 M⊙,
our images should be considered instantaneous ‘snapshots’ of
ongoing or very recent unobscured star formation. A detailed
treatment of extinction for a majority subset of our sample is
provided by Mittal et al. (2015), and will not be discussed here
beyond cautioning against overinterpretation of observed FUV
structures. The clumps and filaments we do detect are likely ‘tips of
icebergs’, and smooth, diffuse emission may be significantly con-
taminated by red leak and the UV upturn population (as discussed
in Section 2.4).
It is nevertheless obvious from Fig. 1 that star formation in our
sample is not occurring amid monolithic slabs of gas. The ob-
served FUV morphologies are instead highly clumpy and filamen-
tary, exhibiting a variety of associations (and sometimes interesting
non-associations) with X-ray, optical, and radio features, as well
as galaxy properties such as central X-ray entropy and the rela-
tive strength of AGN feedback signatures. These associations are
discussed in the following sections.
3.1 Comparison of FUV, Lyα, and Hα morphology
In Fig. 2, we compare a subset of our targets with the continuum-
subtracted Lyα data of O’Dea et al. (2010). Although the
MNRAS 451, 3768–3800 (2015)
atSpaceTelescopeScienceInstituteonJuly9,2015http://mnras.oxfordjournals.org/Downloadedfrom
3774 G. R. Tremblay et al.
Figure 1. HST/ACS SBC images of FUV continuum emission associated with young, massive stars in the central ∼50 kpc of the 16 low-redshift CC BCGs in
our sample. It is immediately obvious that the star formation in these systems does not occur in monolithic slabs of gas, but rather in highly complex filamentary
and clumpy distributions. These images are discussed in general in Section 3. The five sources for which we are showing newly obtained FUV data are marked
with an asterisk. All panels are rotated such that east is left and north is up. This paper presents multiwavelength data for each of these sources, which can be
seen by referring to the figures listed in column (7) of Table 1.
morphologies are very similar overall, the Lyα is far more extended
than the underlying FUV continuum. In a simple photon-counting
exercise using the same FUV data for a subset of our sample, O’Dea
et al. (2010) demonstrated that the young stellar component traced
by the FUV continuum can roughly account for the photon budget
required to photoionize the Lyα nebula, although there is unavoid-
ably significant uncertainty in the extinction correction used in this
analysis.
That the Lyα is far more extended than the FUV continuum may
be due to a simple sensitivity issue. Lyα is far brighter than the
local FUV continuum, as the average Lyα/FUV flux density ratio
for our sample is roughly ∼3. There are several examples in our
sample where outer Lyα filaments are detected in a region where this
Lyα/FUV ratio would result in an FUV continuum flux that is below
the sensitivity limit of the observation (the outer Lyα filaments in
Abell 11 are one example). We are therefore unable to rule out the
possibility that all Lyα emission is cospatial with underlying FUV
continuum from young stars. Alternatively, it is still possible that the
Lyα is intrinsically more extended than the FUV continuum. This
would be similarly unsurprising and consistent with many previous
MNRAS 451, 3768–3800 (2015)
atSpaceTelescopeScienceInstituteonJuly9,2015http://mnras.oxfordjournals.org/Downloadedfrom
FUV morphology of cool core BCGs 3775
Figure 2. A comparison of Lyα and FUV continuum morphologies for a subset of our sample. In blue, we show the HST/ACS SBC continuum-subtracted
Lyα images from O’Dea et al. (2010), and in orange we show the FUV continuum images. While the general morphologies are very similar, the Lyα emission
is far more extended than the underlying FUV continuum. This result is unsurprising given the sensitivity of Lyα emission to resonant scattering. O’Dea
et al. (2010) demonstrated that the underlying FUV continuum strength was sufficient to fully account for production of the observed Lyα emission via stellar
photoionization. All image pairs are aligned and shown on a common spatial scale, with east left and north up.
observations, as this is attributable to Lyα’s very high sensitivity
to resonant scattering (e.g. Laursen & Sommer-Larsen 2007). This
can make Lyα morphology difficult to interpret in a physical sense,
though it does serve as an excellent (although ‘tip-of-the-iceberg’)
tracer for neutral hydrogen. We leverage these Lyα data for this
purpose in many of the multiwavelength comparison figures listed
in column (7) of Table 1.
In Fig. 3, we compare a subset of our FUV sample with
the narrow-band Hα maps from McDonald & Veilleux (2009),
McDonald et al. (2010), McDonald et al. (2011a,b), and Conselice
et al. (2001). We have smoothed the FUV maps with a Gaussian in
order to degrade their spatial resolution to (roughly) match that of
the Hα images. Although the FUV and Hα morphologies closely
match one another (see also e.g. McDonald et al. 2011a), the match
MNRAS 451, 3768–3800 (2015)
atSpaceTelescopeScienceInstituteonJuly9,2015http://mnras.oxfordjournals.org/Downloadedfrom
3776 G. R. Tremblay et al.
Figure 3. A comparison of Hα and FUV continuum morphologies for
a subset of our sample. In blue, we show the narrow-band Hα images
from McDonald et al. (2010, 2011a,b); Conselice et al. (2001), and in
orange we show the FUV continuum images after Gaussian smoothing to
(approximately) match the spatial resolution of the Hα maps. All image
pairs are aligned and shown on a common spatial scale, with east left and
north up. The morphologies are very similar overall, though it is important
to note that some Hα filaments lack detected cospatial FUV continuum,
and some FUV filaments lack detected cospatial Hα emission (though non-
detection of course does not necessarily imply absence). Many works have
demonstrated that continuum emission from young stars can account for a
dominant fraction of the ionizing photons needed to power the Hα nebula
(e.g. O’Dea et al. 2010; McDonald et al. 2011a). However, an additional
ionization mechanism (e.g. shocks, cosmic rays, thermal conduction, etc.)
is needed in all cases (see Section 1).
is not nearly one to one. It has been known for many years that
some of the Hα filaments in CC BCGs are devoid of a detectable
FUV counterpart, with Perseus7
being the most obvious example
(e.g. Hatch et al. 2006; Canning et al. 2010). Moreover, some blue
star-forming filaments apparently lack cospatial Hα emission (e.g.
the ‘blue loop’ in Perseus; Fabian et al. 2008; Canning et al. 2010,
2014). Hα traces the contemporary SFR via the instantaneous flux
of ionizing photons from the most massive (M⋆ 15 M⊙) O and
early B-type stars, while the more heavily extincted UV excess as-
sociated with the photospheres of less massive (M⋆ 5 M⊙) young
stars can shine long after those most massive stars powering the
Hα flux are gone. Hα and the FUV therefore sample smaller and
larger temporal slices (∼106–7
versus ∼108
yr) of the star formation
history, respectively. More importantly, many authors have demon-
strated that the Hα nebulae cannot be heated by star formation alone
(see Section 1, although this issue is not the focus of our paper). The
slight morphological mismatch between Hα and FUV is therefore
not necessarily surprising. Fig. 3 only demonstrates that the FUV
and Hα filaments are roughly cospatial in projection, with clear
important exceptions. While some authors have shown that stars
can indeed play a very important role in the ionization states of
the filaments (e.g. O’Dea et al. 2010; McDonald et al. 2011b), we
reiterate that another heat source (acting either alone or in concert
with the young stars) is needed (e.g. Voit & Donahue 1997; Ferland
et al. 2009; Fabian et al. 2011a; Oonk et al. 2011; Johnstone et al.
2012; Mittal et al. 2012; Canning et al. 2015).
3.2 Galaxy-scale position angle alignment of FUV with X-ray,
optical, and IR major axes
In Fig. 4, we plot the position angle (PA measured N through E)
of the projected X-ray, optical, IR (3.6 µm), and radio major axis
versus the projected FUV major axis. The FUV major axis was
taken to be the PA of the isophote at roughly twice the FUV half-
light radius in lightly smoothed maps. We then measured the X-ray,
optical, and IR major axis within the isophote at roughly the same
radius. Sources that are point like or circular in any of these bands
have been excluded from that particular plot.
As is evident in Fig. 4, we observe weak-to-strong projected
alignment between FUV, X-ray, optical, and IR counterparts. Those
sources that are outliers to any of these trends have been labelled in
the respective plot. It is possible that the alignment is a reflection
of the old and young stellar components sharing a common origin
in the ambient hot gas. Another possibility is that the alignment is
merely due to the fact that the various components all reside within
the same gravitational potential, and have had sufficient time to
dynamically relax, torque towards a common axis, etc. We caution
against overinterpretation of these apparent projected alignments:
these are chaotic, messy systems with morphologies that probably
vary strongly with time.
3.3 Kiloparsec-scale offsets between FUV and X-ray surface
brightness peaks
While FUV and X-ray surface brightness peaks are spatially coin-
cident for the majority of our sample, A1664, A1835, Centaurus,
7 One must be wary of confusing star-forming filaments in Perseus with FUV
and blue excess emission from the foreground High Velocity System that
is superimposed along the line of sight. This disrupted galaxy is ∼100 kpc
closer in projection and is unrelated to the BCG; see e.g. Sanders & Fabian
(2007).
MNRAS 451, 3768–3800 (2015)
atSpaceTelescopeScienceInstituteonJuly9,2015http://mnras.oxfordjournals.org/Downloadedfrom
FUV morphology of cool core BCGs 3777
Figure 4. A comparison of projected position angles (PAs) for the FUV, X-ray, optical, IR, and radio isophotal major axes at matching spatial scales. PA has
been measured N through E. If the PA of the X-ray, optical, or IR major axis was found to vary strongly as a function of radius, we measured the PA of the
major axis that matched the largest angular size of the FUV emission. Strong alignment between FUV, X-ray, optical, and IR counterparts is observed. Those
sources that are outliers to any particular trend are labelled in the respective plot. The radio versus FUV major axis comparison (bottom right) shows alignment
only for those sources that exhibit evidence for either jet-triggered star formation or strong dynamical interaction between the radio source and star-forming
gas. The dashed line on the bottom-right plot is the one-to-one line. Spearman-rank and Pearson correlation coefficients for these plots are shown in Table 4.
PKS 0745, R2129, and Zw3146 show projected offsets of 9, 14.8,
1.3, 4.65, 7, and 11 kpc, respectively. The mean and median offsets
are both roughly 8 kpc. Offsets between the X-ray emission and
the optical/IR BCG peak are effectively the same for these targets
(as the FUV and optical peaks are almost always cospatial, at least
within our sample). The offset in A1664 has been previously noted
Table 4. The Spearman-rank and Pearson correlation coefficients be-
tween the FUV position angle (X) and the X-ray, optical, infrared,
and radio position angles (Y). These quantities are plotted against one
another in Fig. 4.
Quantity (Y) Spearman rank Pearson Best-fitting correlation
X-ray 0.81 0.84 Y ∝ X1±0.2
Optical 0.73 0.74 Y ∝ X0.9±0.1
Infrared 0.72 0.76 Y ∝ X1±0.2
Radio 0 0.10 ...
by Kirkpatrick et al. (2009) in their detailed study of the source.
The A1835, R2129, and Zw3146 offsets were noted by O’Dea et al.
(2010).
The X-ray surface brightness maps for all objects with X-
ray/FUV photocentroid offsets show large scale ( 50 kpc) asymme-
tries, suggestive of complex gas dynamics in the hot phase. Photo-
centroid offsets between the BCG and the cluster X-ray emission is
a proxy for how close (or how far) the system is to a state of dynam-
ical equilibrium, such that the offsets should decrease as the cluster
evolves (Katayama et al. 2003). Sloshing motions in the X-ray gas
can nevertheless remain long lived even after the supposed viri-
alization of the cluster (e.g. Markevitch & Vikhlinin 2007). Large
optically selected samples of both CC and non-CC BCGs frequently
show median X-ray/BCG offsets of ∼15 kpc (Bildfell et al. 2008;
Loubser et al. 2009; Sanderson, Edge & Smith 2009). CC BCGs
systematically lie below this median at ∼10 kpc, which is close to
the median for those objects (with observed X-ray offsets) within
MNRAS 451, 3768–3800 (2015)
atSpaceTelescopeScienceInstituteonJuly9,2015http://mnras.oxfordjournals.org/Downloadedfrom
3778 G. R. Tremblay et al.
our sample (∼8 kpc). If we include those galaxies in our sample that
do not show any measurable projected offset (10 out of 16 sources),
the sample-wide median and mean projected offsets are ∼0 and
∼3 kpc, respectively. The sources exhibiting kpc-scale offsets do
not appear to prefer any particular galaxy property – instead they
inhabit the full range of FUV morphology, SFR, radio power, etc.
that is spanned by our whole sample.
3.4 Quantifying morphology by asymmetry
and clumpiness indices
Fig. 1 shows that our sample spans a diverse range of FUV mor-
phologies, including sources that can be described as amorphous
(e.g. Zw3146), clumpy (e.g. A11), point-like (e.g. Centaurus), disc-
like (Hydra A), and filamentary (e.g. A2597, R1504). There is
however significant overlap between these classes. For example,
A2597 could be arbitrarily described as a hybrid of filamentary,
amorphous, and clumpy structures, illustrating the need for a more
objective measure of morphology.
We therefore quantify all projected FUV morphology by means
of scale-invariant structural indices, as is done frequently for galax-
ies in the literature. We adopt the commonly used concentration–
asymmetry–smoothness (CAS) system described by Conselice
(2003), which posits that galaxy morphology can be entirely quan-
tified by measuring the concentration of light (C) around a photo-
centric point, the azimuthal asymmetry of light about this point (A),
and the high spatial frequency smoothness or clumpiness (S) of that
light. The CAS indices are useful in that they (a) are independent of
any assumption about galaxy light distribution and (b) correlate with
galaxy processes such as star formation, mergers, colours, emission
line widths, etc. Galaxies of different Hubble type appropriately
stratify within the optical CAS volume, which has been expanded
to include other wavelength regimes over the years (including for
extragalactic FUV imaging; see e.g. Holwerda, Pirzkal & Heiner
2012).
In our case, there is a risk that any use of a concentration-of-light
parameter C (typically defined by the ratio of curve-of-growth radii
containing 80 and 20 per cent of all light) may be significantly con-
taminated by the SBC red leak, for reasons discussed in Section 2.4.
We therefore make use of only the asymmetry and clumpiness pa-
rameters A and S, which (even without C) are useful in quantifying
spatial anisotropy in FUV surface brightness. Following Conselice
(2003), we compute the asymmetry index A by rotating each FUV
image by 180◦
about a central point (discussed below), subtracting
this from the original unrotated image, and then summing the abso-
lute value intensities from the resulting residual map. The resultant
value is then normalized by two times the original galaxy flux.
Expressing the above more quantitatively, the asymmetry index is
given by
A = k ×
|Iθ=0 − Iθ=180|
2 × |Iθ=0|
, (1)
where Iθ = 0 and Iθ = 180 are the intensity distributions in the original
and 180◦
rotated images, respectively. On both, the rotated and
original images, the sum is taken over all pixels within matching
regions that encompass all galaxy FUV flux (e.g. an ‘all the flux you
see’ circular aperture). The resulting value of A depends strongly
on the pixel about which the image is rotated, as is discussed by
Conselice (2003). For sample-wide consistency, we have chosen to
rotate each FUV image around the pixel that is cospatial with both
the radio core and optical photocentroid of the host galaxy, such
that our computed A values are at least somewhat related to the
Figure 5. The FUV asymmetry index A, as defined by equation (1), versus
the FUV ‘clumpiness index’ S, defined in equation (2). Higher values of
A means that the FUV surface brightness distribution is more azimuthally
asymmetric about the galaxy centre. Higher values of S means that the FUV
emission features more high spatial frequency clumps, and less smooth
emission. The two indices strongly correlate, such that a galaxy with a high
A + S value can be considered more spatially anisotropic (in terms of FUV
emission) than a galaxy with a low A + S value. These indices are discussed
in Section 3.4.
projected reflection asymmetry of young stars around the AGN. In
a few cases, the radio core was not cospatial with the host galaxy
optical photocentroid, but this was typically because of a central
dust lane (Hydra A is one example). Comparison of both A and S
values with those in other papers is beyond the scope of this work,
so in the interests of simplicity we use k as a scalar normalization
to set the range spanned by the A distribution to 0 ≤ A ≤ 1. Sources
with lower values of A are more azimuthally symmetric about the
centre of the galaxy than are sources with higher values of A.
The ‘clumpiness’ parameter S was calculated by summing pixel
intensities in an unsharp mask of the FUV image, made by Gaussian
smoothing the map with both small and large kernel sizes, subtract-
ing the heavily smoothed map from the lightly smoothed one, and
then normalizing the residuals by the flux in the original image.
More specifically, S is given by
S = j ×
(I − Iσ ) − B
I
, (2)
where I and Iσ are the intensity distributions in the lightly and
heavily smoothed images, respectively. All of these sums are taken
within a matching area, and all galaxy apertures are made with a
central hole that intentionally excludes the galaxy nucleus (where
an FUV point source might artificially weight the S value). B is
the background intensity distribution within an off-source ‘sky’
aperture. We again normalize by j to set the range of possible S
values equal to that of A, i.e. 0 ≤ S ≤ 1. A galaxy with S ≈ 1 will
feature many high spatial frequency clumps, whereas an object with
S ≈ 0 is very smooth.
We plot A versus S in Fig. 5. The two indices strongly corre-
late, such that sources that are more asymmetric also tend to be
more clumpy. The trend is strong enough that for the remainder of
MNRAS 451, 3768–3800 (2015)
atSpaceTelescopeScienceInstituteonJuly9,2015http://mnras.oxfordjournals.org/Downloadedfrom
FUV morphology of cool core BCGs 3779
Figure 6. Top left: infrared-estimated star formation rate versus redshift for all targets in our sample. SFRs estimated by other indicators in other wavelength
regimes tend to be lower than the IR-based rate, which can be considered a rough upper-limit. Top right: ‘FUV anisotropy index’ (A + S) based on the CAS
parameters described by Conselice (2003). We define the anisotropy index in Section 3.4. A2199 and Centaurus have been ‘greyed out’ so as not to give the
illusion of correlation where there is likely none. These two sources may be highly contaminated by red leak (so their CAS morphology cannot be trusted), and
their star formation rates are extremely low (perhaps effectively zero).
this paper we will discuss A and S together by means of a single
‘FUV anisotropy index’ A + S, which can inhabit the range from
0 ≤ A + S ≤ 2. Galaxies with higher A + S are more clumpy,
filamentary, and asymmetric, whereas galaxies with lower A + S
values are more symmetrically amorphous or point like.
3.5 Comparison of FUV morphology with redshift, star
formation rate, and ICM central entropy
FUV morphology does not exhibit any obvious redshift depen-
dence, despite the very strong redshift–luminosity bias present in
our sample (which is assembled from flux limited and therefore
Malmquist-biased catalogues). We demonstrate this bias in the top-
left-hand panel of Fig. 6, where we plot the IR-estimated SFR versus
redshift. Despite the expected strong upward trend in SFR with red-
shift associated with the Malmquist bias, the top-right-hand panel
of Fig. 2 – showing FUV anisotropy index (A + S) versus redshift
– is effectively a scatter plot (note that, for each of these plots,
we ‘grey out’ red-leak-contaminated A2199 and Centaurus, so they
do not give the illusion of correlation). Galaxies at higher redshift
marginally tend to have a higher FUV anisotropy value, albeit with
very large scatter. The error bar on this plot reflects the rather large
range that A + S can inhabit given slightly different choices of pixel
about which the image is rotated (in the case of A) or smoothing
lengths used to make the unsharp mask (in the case of S).
We conclude that there is no evidence for any correlation between
redshift and morphology in our sample. This is perhaps somewhat
surprising, because one naturally expects a trend between redshift
and morphology as (1 + z)4
surface brightness dimming and an-
gular size scaling should make objects look increasingly smooth
and symmetric as they approach the resolution limit at higher red-
shifts. To independently test what effect redshift may have on per-
ceived morphology in our sample, we have artificially redshifted
all of our FUV images to one common redshift equal to that for
our most distant target (Zw3146, z = 0.2906). An IRAF script was
used to accomplish this, implementing the technique described by
MNRAS 451, 3768–3800 (2015)
atSpaceTelescopeScienceInstituteonJuly9,2015http://mnras.oxfordjournals.org/Downloadedfrom
3780 G. R. Tremblay et al.
Giavalisco et al. (1996, specifically, see their equations 2–7). While
artificially redshifting our targets had only a small effect on overall
asymmetry A, it is clear from this test that redshift can have a strong
effect on perceived smoothness S. Our lowest redshift targets around
z = 0.01, for example, suffer a factor of ∼20 degradation in spa-
tial resolution, lowering their A value negligibly and their S value
moderately (depending on choice of smoothing scalelengths). It is
therefore possible that our high-redshift targets are intrinsically far
more clumpy than they appear. We therefore note that, while the
top-right-hand panel of Fig. 6 provides no evidence for a correlation
between A + S and redshift, it cannot be used to rule it out.
We plot IR-estimated SFR versus FUV anisotropy index in the
lower left-hand panel of Fig.6, finding no correlation. We do observe
a weak upward trend of central ICM entropy with FUV anisotropy
index, as is evident from the lower right-hand panel of Fig. 6. Here,
entropy S (in units of keV cm2
) is defined as S = kT n−2/3
e , where
k is the Boltzmann constant, T is the gas temperature, and ne the
electron density. Central entropy values have been adopted from
the Archive of Chandra Cluster Entropy Profile Tables (ACCEPT)
sample (Donahue et al. 2006; Cavagnolo et al. 2009). We again
caution against overinterpretation here, particularly because calcu-
lations of ICM central entropy from the X-ray data can be problem-
atic and strongly tied to data quality (Panagoulia, Fabian & Sanders
2014). The plot merely demonstrates that sources with higher cen-
tral entropy may have more spatially anisotropic star formation, at
least within our sample.
3.6 Star-forming filaments aligned with radio jets and lobes
Figs 7–9 shows selected X-ray, FUV, Lyα, and radio overlay figures
for a subset of our sample. The three figures are presented in order
of highest to lowest SFR, respectively. In these panels, one will
find several clear spatial correlations between FUV emission, radio
emission, and/or X-ray emission. We discuss these correlations in
the next two sections.
In Fig. 10, we highlight four examples of strong morphological
alignment between FUV continuum/line emission and radio jets
or lobes (shown in red contours). These include A1795, Hydra A,
and A2597. While A1795 and A2597 are known and well-studied
examples (e.g. O’Dea et al. 2004), such alignment has not previously
been noted for Hydra A. Moreover, Fig. A11 shows some evidence
of alignment in PKS 0745, whose ‘spike-like’ FUV filament is
aligned with the axis about which the radio source appears to kink
or fold over.
There are now too many examples of clumpy/filamentary star
formation aligning with radio jets and lobes for this cospatiality to
credibly be pure coincidence or a projection effect (see e.g. Cen A
– Crockett et al. 2012; Hamer et al. 2015; Santoro et al. 2015;
Minkowski’s Object/NGC 541 – van Breugel et al. 1985; 3C 285
– van Breugel & Dey 1993; 4C 41.47; Bicknell et al. 2000; see
also 3C 305, 3C 321, 3C 171, and 3C 277.3). These filaments may
have been dynamically entrained, uplifted, or swept aside by the
radio source, or may have formed in situ along the working surface
of the radio lobe in an example of positive AGN feedback. It has
long been predicted that star formation may be triggered by shock-
induced cloud collapse as the propagating radio plasma entrains
and displaces cold gas phases (see e.g. the shock-/jet-induced star
formation models by Elmegreen & Elmegreen 1978; Voit 1988;
De Young 1989; McNamara & O’Connell 1993). Jet-induced star
formation has for many years been considered as a plausible ex-
planation for the high-redshift alignment effect (Rees 1989; Daly
1990).
Whatever the case, examples like these demonstrate that, at least
for some time, star formation can survive (and may indeed be trig-
gered by) dynamical interaction with a propagating radio source. If
jet-triggered star formation is indeed a real effect, and is respon-
sible for the alignment seen for the four targets in our sample, we
can roughly estimate whether or not such an effect has a signifi-
cant or negligible impact on the global SFR in the galaxy. If we
take A1795, our most dramatic example, and assume that all FUV
emission associated with the ‘P’-shaped filament cospatial with the
radio lobes is directly induced by propagation of the jet, then up to
50 per cent of all star formation in the galaxy could be jet triggered.
The upper limit percentages for the other sources in our sample are
much lower, such that even if jet-triggered star formation is indeed
real, it probably does not play the dominant role in driving star for-
mation in the galaxy. We estimate that the effect may play a role at
the few per cent level at best. Regardless, the apparently competing
roles of radio mechanical feedback simultaneously quenching and
triggering star formation can be reconciled with one another. Even
if the propagating radio source does not (immediately) inhibit or
truncate star formation directly, it may still work to starve it of gas
for future star formation by excavating cavities and driving sound
waves in the hot gas, preventing it from cooling and forming stars.
3.7 Spatial correlations and anti-correlations of star-forming
filaments with X-ray cavities
As we demonstrate in Fig. 11, six sources in our sample possess
one or more kpc-scale narrow filaments that, in projection, extend
towards, into, or wrap around the edges of kpc-scale X-ray cavities.
These include Perseus, A2597, Hydra A, PKS 0745, Centaurus, and
A1835. Two additional sources (A1664 and A1068) show weaker
evidence (due perhaps to the unavailability of deeper X-ray imaging)
of the same effect. Most of those filaments that extend towards and
into cavities are FUV-bright and forming stars, while Perseus and
Centaurus show only dusty, Hα bright filaments that lack cospatial
FUV continuum.
This may be evidence for buoyant uplift of the filament by the
cavity as it rises amid the ICM, as has been discussed (typically
in the context of Perseus) by many previous authors (e.g. Fabian
2003; Hatch et al. 2006; Canning et al. 2010, 2014; McDonald
et al. 2011b). The spatial associations are certainly compelling, and
filament uplift by cavities may indeed be an important and even
common effect. It is, however, unlikely to be the only effect driving
the morphology of all narrow filaments ubiquitously observed in
CC BCGs, as there are many examples of filaments with no obvi-
ous association with either a cavity (or radio source, for that matter).
Ever-deeper observations of X-ray CCs do however tend to reveal
ever more numerous X-ray cavities, so we cannot necessarily rule
out the unlikely possibility that all filaments in CC BCGs have at
some point been uplifted by a cavity. We find this unlikely, how-
ever, as filament kinematics [at least for the small sample that has
been fully mapped with an Integral Field Unit (IFU)] are generally
inconsistent with expectations if they are indeed dragged outwards
(see, for example, the northern filament in Perseus, which shows
a smooth velocity gradient of a few 100 km s−1
, consistent with
a laminar flow; Hatch et al. 2006). Alternatively, those filaments
that wrap (in projection) around X-ray cavities may have formed in
situ in the cavity’s compressed shell, though it is entirely unknown
whether or not direct cooling from the X-ray to molecular phase is
even possible absent dust (e.g. Fabian et al. 1994b). We expand on
this below, in our discussion of FUV morphology in the context of
ICM cooling and AGN heating.
MNRAS 451, 3768–3800 (2015)
atSpaceTelescopeScienceInstituteonJuly9,2015http://mnras.oxfordjournals.org/Downloadedfrom
FUV morphology of cool core BCGs 3781
Figure 7. The three sources in our sample with the highest star formation rates ( 100 M⊙ yr−1). The left-hand panels show a wide view of X-ray emission
cospatial with the BCG and its outskirts. White boxes are used to indicate the FOV of the right-hand panels, which show FUV continuum emission. Various
contour sets are overlaid, and are labelled appropriately in their respective panels.
MNRAS 451, 3768–3800 (2015)
atSpaceTelescopeScienceInstituteonJuly9,2015http://mnras.oxfordjournals.org/Downloadedfrom
3782 G. R. Tremblay et al.
Figure 8. A selection of sources in our sample that show moderate star formation rates ∼5 < SFR < 15 M⊙ yr−1. The left-hand panels show a wide view
of X-ray emission cospatial with the BCG and its outskirts. White boxes are used to indicate the FOV of the right-hand panels, which show FUV continuum
emission. Various contour sets are overlaid, and are labelled appropriately in their respective panels.
MNRAS 451, 3768–3800 (2015)
atSpaceTelescopeScienceInstituteonJuly9,2015http://mnras.oxfordjournals.org/Downloadedfrom
FUV morphology of cool core BCGs 3783
Figure 9. The two sources in our sample in which there is effectively no ongoing star formation or FUV-bright young stars (or ≪0.1 M⊙yr−1).The left-hand
panels show a wide view of X-ray emission cospatial with the BCG and its outskirts. White boxes are used to indicate the FOV of the right-hand panels. For
Centaurus, we show a B/H-band colour map made with HST data, showing the famous dust lane associated with the source. The (almost non-existent) FUV
emission in the radio core is shown in red contours. For A2199, the rightmost panel shows FUV continuum emission. The diffuse emission seen in A2199 may
be an artefact of the ACS SBC red leak.
4 DISCUSSION
The exquisitely complex and highly diverse range of far-ultraviolet
morphologies presented in this paper reflect the dynamical re-
sponse of low-entropy gas to a highly energetic, chaotic environ-
ment. Besides the gravitational potential of their host galaxies, these
star-forming nebulae reside amid AGN-driven jets, bubbles, sound
waves, bulk ICM motions, and stellar feedback, and few structures
observed in our FUV data set are likely to be long lived. Hydra
A’s rotating, star-forming disc (Hamer et al. 2014) reveals cold gas
that is largely in dynamical equilibrium, though it still features nar-
row filaments that have likely been lifted outward by the radio jet
(Figs 10 and A9), or dynamically stirred by a small companion
galaxy (Fig. 12). A1795 (Fig. A4) not only features radio lobes
frosted with young stars, but a ∼20 kpc southern tail deposited
perhaps by a cooling wake that lags behind the BCG (McDonald
& Veilleux 2009). Centaurus (Fig. A8) features no discernible star
formation whatsoever, but a spectacular winding dust lane whose
shape mirrors that of the larger scale X-ray spiral.
In many ways, conclusions drawn from a small collection of
highly complex individual galaxies are doomed to ambiguity. If
each source is so chaotic and time varying, what can we learn
in a ‘big picture’ context? The answer may be that our data are
snapshots of a prototypical CC BCG at different stages of an
AGN outburst cycle. Throughout the past ∼3 Gyr of cosmic his-
tory that our sample’s redshift range spans, perhaps each galaxy
has spent (or will spend) some time resembling each of the oth-
ers as the tug-of-war between ICM cooling and AGN heating
cycles and varies. Indeed, AGN can vary in power and switch
on and off over a manifold range of time-scales, and the asso-
ciated balance of AGN heating and ICM cooling can vary still
more.
Recent numerical work by Sharma et al. (2012a), McCourt et al.
(2012), and Gaspari et al. (2012) has shown that thermal instabilities
in a cooling flow can produce a multiphase and star-forming ISM
when the ratio of the cooling time tcool to the local gravitational
free-fall time-scale tff is tcool/tff 10 (see also Pizzolato & Soker
2005, 2010). This theoretical framework has since been expanded
in a series of papers by Voit and collaborators, who propose a
precipitation-regulated AGN feedback model applicable not only
to BCGs and giant ellipticals (Voit & Donahue 2015; Voit et al.
MNRAS 451, 3768–3800 (2015)
atSpaceTelescopeScienceInstituteonJuly9,2015http://mnras.oxfordjournals.org/Downloadedfrom
3784 G. R. Tremblay et al.
Figure 10. The strongest examples of FUV/radio morphological correlation and anti-correlation in our sample. This is perhaps evidence for (a) star-forming
filaments that have been uplifted, entrained, or swept aside by the propagating radio source or (b) jet-triggered star formation. Note also that PKS 0745
(Fig. A11) shows weaker evidence for a similar alignment.
2015a,b), but perhaps galaxies in general (Voit et al. 2015c). In the
model, cold clouds precipitate out of the ambient hot medium via
thermal instability wherever tcool 10tff. Cold chaotic accretion
(Gaspari, Ruszkowski & Oh 2013; Gaspari et al. 2014) from the
now ‘raining’ ambient hot atmosphere boosts black hole feeding to
∼100 times the Bondi rate, powering jets that can stimulate further
precipitation by dragging low-entropy gas to higher altitudes, where
the cooling-to-dynamical time ratio will lessen. At the same time,
jet heating works to raise the local cooling time, resulting in the
system’s self-regulation at nearly tcool ≈ 10tff (Voit & Donahue
2015; Voit et al. 2015a,b).
The maximal radius within which FUV emission is detected in
our images can be used in a very rough comparison with this theoret-
ical prediction. Assuming (a) that the star formation in our sources is
indeed powered by a precipitation-based cooling flow and (b) there
is no non-detected star formation beyond the largest measured FUV
radius, this ‘maximal FUV radius’ serves as a rough observable
tracer of the radial threshold for the onset of cooling flow powered
star formation. Models of precipitation-regulated feedback predict
that this radius should coincide with tcool ≈ 10tff. Of course, as-
sumption (b) may be not reasonable, as deeper FUV observations
may reveal larger maximal FUV radii for a significant fraction of
our sample. One must also consider that these filaments may have
been uplifted by jets or buoyant cavities in some cases. The maxi-
mal FUV radius should therefore be treated as a lower limit in this
caveat-laden test.
To derive tff, we adopt the spectrally deprojected X-ray emissiv-
ity, cooling time, and electron density profiles from work on the
ACCEPT sample by Donahue et al. (2006) and Cavagnolo et al.
(2009). To these, we fit third-order polynomials in log space, and
then analytically differentiate to obtain the gravitational free-fall
time tff. The presence of the BCG was accounted for by enforcing
a minimum value of the gravitational acceleration g equal to that
of an isothermal sphere with a velocity dispersion of 250 km s−1
(a
correction that is only important at radii 10 kpc).
The result is shown in Fig. 13, where we compare the maxi-
mal FUV radius with the X-ray entropy and cooling-to-dynamical
time ratios measured at that same cluster-centric radius. Within our
sample, the average maximal radius (and its ±1σ interval) within
which FUV continuum emission is detected is 14.7 ± 10.14 kpc. At
this average radius, the average (and ±1σ) cooling time, entropy,
and cooling-to-dynamical time ratio is 1.09 ± 0.68 Gyr, 28.27 ±
12.12 keV cm2
, and 14.78 ± 8.57, respectively. These average val-
ues and their ±1σ intervals are marked by the black solid and
dashed lines (respectively) on the two panels in Fig. 13. Blue and
red points are used to differentiate between those sources with unre-
solved radio sources (and higher SFRs) and resolved radio sources
(and lower SFRs). As entropy rises with radius, the points on the
MNRAS 451, 3768–3800 (2015)
atSpaceTelescopeScienceInstituteonJuly9,2015http://mnras.oxfordjournals.org/Downloadedfrom
FUV morphology of cool core BCGs 3785
Figure 11. Six sources for which there is some evidence of kpc-scale filaments extending in projection towards and around X-ray cavities. FUV contours are
overlaid in green on X-ray unsharp masks. Centaurus has no discernible star formation, but its dust contours do possess filaments that extend towards cavities.
We show these dust contours in blue. For Hydra A, we show Hα contours as these better show the faint filament that follows the northern cavity. While not
shown, FUV emission at low surface brightness in Hydra A is fully cospatial with the Hα filaments shown above.
Figure 12. The new HST I-band optical image of the Hydra A BCG and its surrounding environment. On the right-hand panel we overlay both the VLA
4.6 GHz radio contours and the MMTF narrow-band Hα contours. The Hα distribution shows evidence for dynamical interaction with both the radio source
(note the apparently uplifted filaments northward and southward of the nucleus) as well as the small companion galaxy ∼10 arcsec to the south-east. While
this companion is unlikely to provide a substantial cold gas mass to the BCG via merger-driven flow, it may be acting to dynamically ‘stir’ the low-entropy gas
already present in the BCG. The companion is cospatial with a bright knot of both Hα and FUV continuum emission.
leftmost panel of course also rise (i.e. larger local entropies will be
found at larger maximal FUV radii).
We find that the observed average ‘star formation onset’ threshold
of S = 28 keV cm2
is very close to the empirical (rough) threshold
of S ≈ 30 keV cm2
from Cavagnolo et al. (2008), which we mark
with the green dashed line on the left-hand panel of Fig. 13. The
average observed tcool/tff ratio of 14.78 is close to the predicted
threshold of tcool/tff 10 by Sharma et al. (2012b), which we
mark with the green dashed line on the rightmost panel of Fig. 13.
Sources with higher SFRs cluster more strongly around tcool ≈ 10tff
than do sources with lower SFRs. Heeding the strong caveats noted
above, this may be roughly consistent (or at least not obviously
MNRAS 451, 3768–3800 (2015)
atSpaceTelescopeScienceInstituteonJuly9,2015http://mnras.oxfordjournals.org/Downloadedfrom
3786 G. R. Tremblay et al.
~
Figure 13. Here, we compare the maximal FUV radius with the X-ray entropy (left) and cooling-to-dynamical time ratios (right) measured at that same
cluster-centric radius. Assuming (a) that the star formation in our sources is indeed powered by a cooling flow and (b) there is no non-detected star formation
beyond the largest measured FUV radius, the maximal radius within which FUV emission is observed serves as a rough observable tracer of the radial threshold
for the onset of cooling flow powered star formation. Within our sample, the average maximal radius (and its ±1σ interval) within which FUV continuum
emission is detected is 14.7 ± 10.14 kpc. At this average radius, the average (and ±1σ) cooling time, entropy, and cooling-to-dynamical time ratio is 1.09 ±
0.68 Gyr, 28.27 ± 12.12 keV cm2, and 14.78 ± 8.57, respectively. These average values and their ±1σ intervals are marked by the black solid and dashed
lines (respectively) on both panels. Blue and red points are used to differentiate between those sources with unresolved radio sources (and higher SFRs) and
resolved radio sources (and lower SFRs). As entropy rises with radius, the points on the leftmost panel of course also rise (i.e. larger local entropies will be
found at larger maximal FUV radii). Both results are found to be roughly consistent (although with large scatter) with the respective predictions by Cavagnolo
et al. (2008) and Sharma et al. (2012a), which are marked by the green dashed line on both plots.
inconsistent) with theoretical predictions by Sharma et al. (2012b),
McCourt et al. (2012), and Voit et al. (2015a).
Li & Bryan (2014a,b) and Li et al. (2015) have published
new adaptive mesh hydrodynamical simulations of BCGs consis-
tent with the precipitation-regulated AGN feedback framework.
In Fig. 14, we show selected snapshots of the cold, star-forming
gas produced by the standard run in Li et al. (2015) for a single
BCG, and compare these with our FUV images. The simulated
cooling flow begins at t ∼ 300 Myr (roughly the central cooling
time of Perseus), which ignites AGN feedback. The jets trigger
more ICM to cool into filamentary structures, causing more cold
gas to rain into the nucleus. This fuels both star formation and
black hole accretion, leading to a major AGN outburst. AGN feed-
back heats up the core, reducing the cooling rate and causing tcool
to increase; star formation gradually consumes the cold gas until
it vanishes, which turns off AGN feedback and allows the ICM
to cool again. The cluster experiences three such cycles within
6.5 Gyr.
Most of the images shown in Fig. 14 are from the second cycle
that starts around t = 1.6 Gyr. Within this cycle, the simulation
produces star-forming structures that are remarkably similar to our
FUV images not only in morphology, axial ratio, and physical ex-
tent, but also in SFR. That is, when the simulated morphology
matches that of one of our FUV images, its associated SFR also
roughly matches. These structures are reproduced by the simula-
tion in the same ∼3 Gyr temporal slice spanned by the redshift
range of our sample. Their simulated multiphase (hot, warm, and
cold) gas morphology is also remarkably similar to the multiwave-
length morphologies we have presented here. This is illustrated in
the topmost panels of Fig. 14, in which the RGB multiwavelength
composite of Hydra A in X-ray, Hα, and FUV is nearly indistin-
guishable from the simulation snapshot at 2.9 Gyr, which comes
complete with a rotating, star-forming disc.
While surely other stochastic events such as mergers play an ad-
ditional role in sculpting the morphology of star-forming filaments
in CC BCGs, the Li et al. simulations show that they need not be
invoked to explain the FUV morphologies we observe (the same
was true for a similar comparison made in Donahue et al. 2015).
Instead, nearly all FUV morphologies shown in this paper appear
in a simulated BCG whose evolution is driven by precipitation-
regulated AGN feedback. The FUV images presented in this paper
may be snapshots at successive stages of an ICM cooling/AGN
heating cycle.
5 SUMMARY AND CONCLUDING REMARKS
We have analysed the far-ultraviolet morphology of star-forming
clouds and filaments in 16 low-redshift (z < 0.29) CC BCGs.
X-ray, Lyα, Hα, broad-band optical/IR, and radio maps were com-
pared with the FUV emission, providing a high spatial resolution
atlas of star formation locales relative to the ambient hot and warm
ionized gas phases, as well as the old stellar population and radio-
bright AGN outflows. The main results of this paper are summarized
as follows.
(i) Nearly half of the sample possesses kpc-scale narrow fila-
ments that, in projection, extend towards, into, and around radio
lobes and/or X-ray cavities. Most (but not all) of these filaments
are FUV-bright and forming stars, and we suggest that they have
either been uplifted by the radio lobe or buoyant X-ray cavity, or
have formed in situ by jet-triggered star formation or rapid cooling
in the cavity’s compressed shell.
MNRAS 451, 3768–3800 (2015)
atSpaceTelescopeScienceInstituteonJuly9,2015http://mnras.oxfordjournals.org/Downloadedfrom
FUV morphology of cool core BCGs 3787
Figure 14. Observations compared with simulations by Y. Li and collaborators (e.g. Li & Bryan 2014a,b; Li et al. 2015). Top panels: a multiwavelength
(X-ray, FUV, and Hα) composite of Hydra A, compared with a single snapshot of the Li et al. (2015) simulation at 2.9 Gyr. The RGB channels are set to
roughly simulate Hα, FUV, and X-ray emmissivities, respectively, though two ‘cheats’ have been used: the green channel shows cold, dense gas where star
formation appears in the simulation – the assumption, then, is that FUV emission from these young stars would roughly show the same morphology. The
red channel does not explicitly show simulated Hα, but rather intermediate temperature gas whose morphology closely matches a rough scaling to simulate
collisionally ionized (but not photoionized) Hα. It should therefore be treated as a very rough approximation. Bottom panels: selected FUV images from our
sample are shown in orange, and projected density-weighted density snapshots from the simulation are shown in blue. The bright knots and filaments show
the high-density low-temperature clouds that are forming stars in the simulation (see Li et al. 2015 for details). Our sample’s redshift range spans ∼3 Gyr of
cosmic history. The simulation is capable of producing star-forming structures similar in axial ratio, physical extent, and star formation rate within the same
∼3 Gyr temporal slice of the simulated cluster’s evolution.
MNRAS 451, 3768–3800 (2015)
atSpaceTelescopeScienceInstituteonJuly9,2015http://mnras.oxfordjournals.org/Downloadedfrom
3788 G. R. Tremblay et al.
(ii) The maximal projected radius to which FUV emission is
observed to extend corresponds to a cooling-to-free-fall time of
tcool/tff ∼ 10 for the majority of the sample. Sources with higher
SFRs cluster more strongly about this ratio than do sources with
lower SFRs. This may be roughly consistent (or at least not in-
consistent) with theoretical predictions by Sharma et al. (2012b),
McCourt et al. (2012), and Voit et al. (2015a). We nevertheless
stress that maximal FUV radius is not the ideal tracer for the on-
set of purported ICM precipitation, as one must consider imaging
depth, extinction, and other morphological drivers such as filament
uplift.
(iii) The diverse range of morphology, axial ratio, spatial extent,
and SFR in our FUV sample is almost entirely recovered in a sin-
gle simulation by Li et al. (2015), demonstrating that galaxy-scale
stochastic events such as mergers need not be invoked to explain
the complex FUV morphologies we observe. Instead, we suggest
that our images represent snapshots of a prototypical CC BCG at
many stages of its evolution.
ACKNOWLEDGEMENTS
The authors thank Drs. Richard Bower, Tim Davis, Bill Forman,
Nina Hatch, Claudia Lagos, Robert Laing, Jason Spyromilio, and
Aurora Simionescu for thoughtful discussions. GRT acknowledges
support from a NASA Einstein Fellowship under award number
PF-150128, as well as a European Southern Observatory (ESO)
Fellowship partially funded by the European Community’s Seventh
Framework Programme (/FP7/2007-2013/) under grant agreement
number 229517. Support for this work was provided by the National
Aeronautics and Space Administration through Einstein Postdoc-
toral Fellowship Award Number PF-150128 issued by the Chandra
X-ray Observatory Center, which is operated by the Smithsonian
Astrophysical Observatory for and on behalf of NASA under con-
tract NAS8-03060. YL acknowledges financial support from NSF
grants AST-0908390, AST-1008134, AST-1210890, AST-1008454,
NASA grants NNX12AH41G, NNX12AC98G, and ATP12-ATP12-
0017, as well as computational resources from NASA, NSF XSEDE
and Columbia University. TEC was partially supported by NASA
through Chandra award G06-7115B issued by the Chandra X-ray
Observatory Center for and on behalf of NASA under contract
NAS8-39073. Basic research into radio astronomy at the Naval Re-
search Laboratory is supported by 6.1 Base funds. This paper is
based on observations made with the NASA/ESA Hubble Space
Telescope, obtained at the Space Telescope Science Institute, which
is operated by the Association of Universities for Research in As-
tronomy, Inc., under NASA contract 5-26555. This research made
use of Astropy, a community-developed core PYTHON package for
Astronomy (Astropy Collaboration et al. 2013). We have also made
extensive use of the NASA Astrophysics Data System bibliographic
services and the NASA/IPAC Extragalactic Database, operated by
the Jet Propulsion Laboratory, California Institute of Technology,
under contract with NASA.
REFERENCES
Astropy Collaboration et al., 2013, A&A, 558, A33
Baldi R. D. et al., 2010, ApJ, 725, 2426
Baum S. A., 1987, PhD thesis, Maryland Univ., College Park
Baum S. A., Laor A., O’Dea C. P., Mack J., Koekemoer A. M., 2005, ApJ,
632, 122
Best P. N., Kaiser C. R., Heckman T. M., Kauffmann G., 2006, MNRAS,
368, L67
Best P. N., von der Linden A., Kauffmann G., Heckman T. M., Kaiser C. R.,
2007, MNRAS, 379, 894
Bicknell G. V., Sutherland R. S., van Breugel W. J. M., Dopita M. A., Dey
A., Miley G. K., 2000, ApJ, 540, 678
Bildfell C., Hoekstra H., Babul A., Mahdavi A., 2008, MNRAS, 389, 1637
Bˆırzan L., Rafferty D. A., McNamara B. R., Wise M. W., Nulsen P. E. J.,
2004, ApJ, 607, 800
Bˆırzan L., McNamara B. R., Nulsen P. E. J., Carilli C. L., Wise M. W., 2008,
ApJ, 686, 859
B¨ohringer H., Burwitz V., Zhang Y.-Y., Schuecker P., Nowak N., 2005, ApJ,
633, 148
Boschin W., 2002, A&A, 396, 397
Bregman J. N., David L. P., 1988, ApJ, 326, 639
Brighenti F., Mathews W. G., Temi P., 2015, ApJ, 802, 118
Burns J. O., 1990, AJ, 99, 14
Canning R. E. A., Fabian A. C., Johnstone R. M., Sanders J. S., Conselice
C. J., Crawford C. S., Gallagher J. S., Zweibel E., 2010, MNRAS, 405,
115
Canning R. E. A. et al., 2014, MNRAS, 444, 336
Canning R. E. A., Ferland G. J., Fabian A. C., Johnstone R. M., van Hoof
P. A. M., Porter R. L., Werner N., Williams R. J. R., 2015, preprint
(arXiv:e-prints)
Cavagnolo K. W., Donahue M., Voit G. M., Sun M., 2008, ApJ, 683, L107
Cavagnolo K. W., Donahue M., Voit G. M., Sun M., 2009, ApJS, 182, 12
Cavagnolo K. W., McNamara B. R., Nulsen P. E. J., Carilli C. L., Jones C.,
Bˆırzan L., 2010, ApJ, 720, 1066
Clampin M. et al., 2004, in Grycewicz T. J., McCreight C. R., eds, Proc. SPIE
Vol. 5167, Focal Plane Arrays for Space Telescopes. SPIE, Bellingham,
p. 235
Clarke T. E., Sarazin C. L., Blanton E. L., Neumann D. M., Kassim N. E.,
2005, ApJ, 625, 748
Condon J. J., Helou G., Sanders D. B., Soifer B. T., 1996, ApJS, 103, 81
Condon J. J., Cotton W. D., Greisen E. W., Yin Q. F., Perley R. A., Taylor
G. B., Broderick J. J., 1998, AJ, 115, 1693
Conselice C. J., 2003, ApJS, 147, 1
Conselice C. J., Gallagher J. S., III, Wyse R. F. G., 2001, AJ, 122, 2281
Crockett R. M. et al., 2012, MNRAS, 421, 1603
Daly R. A., 1990, ApJ, 355, 416
De Young D. S., 1989, ApJ, 342, L59
Donahue M., Mack J., Voit G. M., Sparks W., Elston R., Maloney P. R.,
2000, ApJ, 545, 670
Donahue M., Horner D. J., Cavagnolo K. W., Voit G. M., 2006, ApJ, 643,
730
Donahue M., Sun M., O’Dea C. P., Voit G. M., Cavagnolo K. W., 2007, AJ,
134, 14
Donahue M., de Messi`eres G. E., O’Connell R. W., Voit G. M., Hoffer A.,
McNamara B. R., Nulsen P. E. J., 2011, ApJ, 732, 40
Donahue M. et al., 2015, ApJ, 805, 177
Dong R., Rasmussen J., Mulchaey J. S., 2010, ApJ, 712, 883
Dressel L., 2012, Wide Field Camera 3, HST Instrument Handbook. STScI
Dunn R. J. H., Fabian A. C., 2006, MNRAS, 373, 959
Edge A. C., 2001, MNRAS, 328, 762
Edge A. C., Frayer D. T., 2003, ApJ, 594, L13
Edge A. C. et al., 2010a, A&A, 518, L46
Edge A. C. et al., 2010b, A&A, 518, L47
Edwards L. O. V., Hudson M. J., Balogh M. L., Smith R. J., 2007, MNRAS,
379, 100
Egami E. et al., 2006, ApJ, 647, 922
Elmegreen B. G., Elmegreen D. M., 1978, ApJ, 220, 1051
Fabian A. C., 1999, MNRAS, 308, L39
Fabian A. C., 2003, MNRAS, 344, L27
Fabian A. C., 2012, ARA&A, 50, 455
Fabian A. C., Canizares C. R., Boehringer H., 1994a, ApJ, 425, 40
Fabian A. C., Johnstone R. M., Daines S. J., 1994b, MNRAS, 271, 737
Fabian A. C., Sanders J. S., Taylor G. B., Allen S. W., 2005, MNRAS, 360,
L20
Fabian A. C., Johnstone R. M., Sanders J. S., Conselice C. J., Crawford C.
S., Gallagher J. S., III, Zweibel E., 2008, Nature, 454, 968
MNRAS 451, 3768–3800 (2015)
atSpaceTelescopeScienceInstituteonJuly9,2015http://mnras.oxfordjournals.org/Downloadedfrom
FUV morphology of cool core BCGs 3789
Fabian A. C. et al., 2011a, MNRAS, 418, 2154
Fabian A. C., Sanders J. S., Williams R. J. R., Lazarian A., Ferland G. J.,
Johnstone R. M., 2011b, MNRAS, 417, 172
Fanaroff B. L., Riley J. M., 1974, MNRAS, 167, 31P
Ferland G. J., Fabian A. C., Hatch N. A., Johnstone R. M., Porter R. L., van
Hoof P. A. M., Williams R. J. R., 2009, MNRAS, 392, 1475
Fruscione A. et al., 2006, in Silva D. R., Doxsey R. E., eds, Proc. SPIE
Vol. 6270, Observatory Operations: Strategies, Processes, and Systems.
SPIE, Bellingham, p. 62701V
Gaspari M., Ruszkowski M., Sharma P., 2012, ApJ, 746, 94
Gaspari M., Ruszkowski M., Oh S. P., 2013, MNRAS, 432, 3401
Gaspari M., Ruszkowski M., Oh S. P., Brighenti F., Temi P., 2014, preprint
(arXiv:e-prints)
Ge J. P., Owen F. N., 1993, AJ, 105, 778
Ge J., Owen F. N., 1994, AJ, 108, 1523
Giavalisco M., Livio M., Bohlin R. C., Macchetto F. D., Stecher T. P., 1996,
AJ, 112, 369
Govoni F., Murgia M., Markevitch M., Feretti L., Giovannini G., Taylor G.
B., Carretti E., 2009, A&A, 499, 371
Guo F., Mathews W. G., 2014, ApJ, 780, 126
Hamer S. L. et al., 2014, MNRAS, 437, 862
Hamer S., Salom´e P., Combes F., Salom´e Q., 2015, A&A, 575, L3
Harris W. E., Whitmore B. C., Karakla D., Oko´n W., Baum W. A., Hanes
D. A., Kavelaars J. J., 2006, ApJ, 636, 90
Hatch N. A., Crawford C. S., Johnstone R. M., Fabian A. C., 2006, MNRAS,
367, 433
Heckman T. M., 1981, ApJ, 250, L59
Heckman T. M., Baum S. A., van Breugel W. J. M., McCarthy P., 1989,
ApJ, 338, 48
Hlavacek-Larrondo J., Fabian A. C., Edge A. C., Ebeling H., Sanders J. S.,
Hogan M. T., Taylor G. B., 2012, MNRAS, 421, 1360
Hoffer A. S., Donahue M., Hicks A., Barthelemy R. S., 2012, ApJS, 199,
23
Holtzman J. A. et al., 1996, AJ, 112, 416
Holwerda B. W., Pirzkal N., Heiner J. S., 2012, MNRAS, 427, 3159
Hu E. M., Cowie L. L., Wang Z., 1985, ApJS, 59, 447
Jaffe W., Bremer M. N., 1997, MNRAS, 284, L1
Johnstone R. M., Fabian A. C., Nulsen P. E. J., 1987, MNRAS, 224, 75
Johnstone R. M., Canning R. E. A., Fabian A. C., Ferland G. J., Lykins M.,
Porter R. L., van Hoof P. A. M., Williams R. J. R., 2012, MNRAS, 425,
1421
Katayama H., Hayashida K., Takahara F., Fujita Y., 2003, ApJ, 585, 687
Kirkpatrick C. C. et al., 2009, ApJ, 697, 867
Laursen P., Sommer-Larsen J., 2007, ApJ, 657, L69
Li Y., Bryan G. L., 2014a, ApJ, 789, 54
Li Y., Bryan G. L., 2014b, ApJ, 789, 153
Li Y., Bryan G. L., Ruszkowski M., Voit G. M., O’Shea B. W., Donahue M.,
2015, preprint (arXiv:e-prints)
Lim J., Ao Y., Dinh-V-Trung, 2008, ApJ, 672, 252
Loubser S. I., S´anchez-Bl´azquez P., Sansom A. E., Soechting I. K., 2009,
MNRAS, 398, 133
McCourt M., Sharma P., Quataert E., Parrish I. J., 2012, MNRAS, 419, 3319
McDonald M., Veilleux S., 2009, ApJ, 703, L172
McDonald M., Veilleux S., Rupke D. S. N., Mushotzky R., 2010, ApJ, 721,
1262
McDonald M., Veilleux S., Rupke D. S. N., 2011a, ApJ, 731, 33
McDonald M., Veilleux S., Rupke D. S. N., Mushotzky R., Reynolds C.,
2011b, ApJ, 734, 95
McDonald M. et al., 2012, Nature, 488, 349
McDonald M., Benson B., Veilleux S., Bautz M. W., Reichardt C. L., 2013a,
ApJ, 765, L37
McDonald M. et al., 2013b, ApJ, 774, 23
McDonald M. et al., 2014, ApJ, 784, 18
McNamara B. R., Nulsen P. E. J., 2007, ARA&A, 45, 117
McNamara B. R., Nulsen P. E. J., 2012, New J. Phys., 14, 5023
McNamara B. R., O’Connell R. W., 1993, AJ, 105, 417
McNamara B. R. et al., 2001, ApJ, 562, L149
McNamara B. R., Wise M. W., Murray S. S., 2004, ApJ, 601, 173
McNamara B. R. et al., 2006, ApJ, 648, 164
McNamara B. R. et al., 2014, ApJ, 785, 44
Markevitch M., Vikhlinin A., 2007, Phys. Rep., 443, 1
Mittal R., Hudson D. S., Reiprich T. H., Clarke T., 2009, A&A, 501, 835
Mittal R. et al., 2011, MNRAS, 1558
Mittal R. et al., 2012, MNRAS, 426, 2957
Mittal R., Whelan J. T., Combes F., 2015, MNRAS, 450, 2564
Nulsen P. E. J., McNamara B. R., Wise M. W., David L. P., 2005, ApJ, 628,
629
Nulsen P. E. J. et al., 2013, ApJ, 775, 117
O’Connell R. W., 1999, ARA&A, 37, 603
O’Dea C. P., Baum S. A., Mack J., Koekemoer A. M., Laor A., 2004, ApJ,
612, 131
O’Dea C. P. et al., 2008, ApJ, 681, 1035
O’Dea K. P. et al., 2010, ApJ, 719, 1619
Ogrean G. A., Hatch N. A., Simionescu A., B¨ohringer H., Br¨uggen M.,
Fabian A. C., Werner N., 2010, MNRAS, 406, 354
Oonk J. B. R., Jaffe W., Bremer M. N., van Weeren R. J., 2010, MNRAS,
405, 898
Oonk J. B. R., Hatch N. A., Jaffe W., Bremer M. N., van weeren R. J., 2011,
MNRAS, 414, 2309
Panagoulia E. K., Fabian A. C., Sanders J. S., 2014, MNRAS, 438,
2341
Peterson J. R., Fabian A. C., 2006, Phys. Rep., 427, 1
Pizzolato F., Soker N., 2005, ApJ, 632, 821
Pizzolato F., Soker N., 2010, MNRAS, 408, 961
Quillen A. C. et al., 2008, ApJS, 176, 39
Rafferty D. A., McNamara B. R., Nulsen P. E. J., Wise M. W., 2006, ApJ,
652, 216
Rafferty D. A., McNamara B. R., Nulsen P. E. J., 2008, ApJ, 687, 899
Rawle T. D. et al., 2012, ApJ, 747, 29
Rees M. J., 1989, MNRAS, 239, 1P
Russell H. R. et al., 2014, ApJ, 784, 78
Salom´e P., Combes F., 2003, A&A, 412, 657
Salom´e P. et al., 2006, A&A, 454, 437
Salom´e P., Combes F., Revaz Y., Downes D., Edge A. C., Fabian A. C.,
2011, A&A, 531, A85
Sand D. J., Treu T., Ellis R. S., Smith G. P., 2005, ApJ, 627, 32
Sanders J. S., Fabian A. C., 2007, MNRAS, 381, 1381
Sanderson A. J. R., Edge A. C., Smith G. P., 2009, MNRAS, 398, 1698
Santoro F., Oonk J. B. R., Morganti R., Oosterloo T. A., Tremblay G., 2015,
A&A, 575, L4
Sarazin C. L., 1986, Rev. Mod. Phys., 58, 1
Sarazin C. L., Burns J. O., Roettiger K., McNamara B. R., 1995, ApJ, 447,
559
Sharma P., McCourt M., Quataert E., Parrish I. J., 2012a, MNRAS, 420,
3174
Sharma P., McCourt M., Parrish I. J., Quataert E., 2012b, MNRAS, 427,
1219
Simpson C., Westoby P., Arumugam V., Ivison R., Hartley W., Almaini O.,
2013, MNRAS, 433, 2647
Smith G. P. et al., 2010, MNRAS, 409, 169
Smith B. D., O’Shea B. W., Voit G. M., Ventimiglia D., Skillman S. W.,
2013, ApJ, 778, 152
Soker N., 2003, MNRAS, 342, 463
Sparks W. B., 1992, ApJ, 399, 66
Sparks W. B., 1997, in Soker N., ed., ASP Conf. Ser. Vol. 115, Galactic
Cluster Cooling Flows. Astron. Soc. Pac., San Francisco, p. 192
Sparks W. B., Macchetto F., Golombek D., 1989, ApJ, 345, 153
Sparks W. B., Pringle J. E., Donahue M., Carswell R., Voit M., Cracraft M.,
Martin R. G., 2009, ApJ, 704, L20
Sparks W. B. et al., 2012, ApJ, 750, L5
Sun M., 2012, New J. Phys., 14, 045004
Taylor G. B., Perley R. A., Inoue M., Kato T., Tabara H., Aizu K., 1990,
ApJ, 360, 41
Taylor G. B., Barton E. J., Ge J., 1994, AJ, 107, 1942
Taylor G. B., Fabian A. C., Allen S. W., 2002, MNRAS, 334, 769
Tremblay G., 2011, PhD thesis, RIT
MNRAS 451, 3768–3800 (2015)
atSpaceTelescopeScienceInstituteonJuly9,2015http://mnras.oxfordjournals.org/Downloadedfrom
3790 G. R. Tremblay et al.
Tremblay G. R. et al., 2012a, MNRAS, 424, 1026
Tremblay G. R. et al., 2012b, MNRAS, 424, 1042
Tremblay G. R. et al., 2014, ApJ, 790, L26
Ubeda et al., 2012, Advanced Camera for Surveys HST Instrument Hand-
book. STScI
van Breugel W. J. M., Dey A., 1993, ApJ, 414, 563
van Breugel W., Filippenko A. V., Heckman T., Miley G., 1985, ApJ, 293,
83
Voit G. M., 1988, ApJ, 331, 343
Voit G. M., 2011, ApJ, 740, 28
Voit G. M., Donahue M., 1997, ApJ, 486, 242
Voit G. M., Donahue M., 2005, ApJ, 634, 955
Voit G. M., Donahue M., 2015, ApJ, 799, L1
Voit G. M., Cavagnolo K. W., Donahue M., Rafferty D. A., McNamara B.
R., Nulsen P. E. J., 2008, ApJ, 681, L5
Voit G. M., Donahue M., Bryan G. L., McDonald M., 2015a, Nature, 519,
203
Voit G. M., Donahue M., O’Shea B. W., Bryan G. L., Sun M., Werner N.,
2015b, ApJ, 803, L21
Voit G. M., Bryan G. L., O’Shea B. W., Donahue M., 2015c, preprint
(arXiv:1505.03592)
von der Linden A., Best P. N., Kauffmann G., White S. D. M., 2007,
MNRAS, 379, 867
Wilman R. J., Edge A. C., Swinbank A. M., 2009, MNRAS, 395, 1355
Wise M. W., McNamara B. R., Murray S. S., 2004, ApJ, 601, 184
Wise M. W., McNamara B. R., Nulsen P. E. J., Houck J. C., David L. P.,
2007, ApJ, 659, 1153
APPENDIX A: MULTIWAVELENGTH OVERLAY
FIGURES
Figure A1. The Abell 11 BCG (z = 0.1660). The FUV continuum image and broad-band optical unsharp mask are shown in the left- and right-hand panels,
respectively. Lyα contours are overlaid in green. The radio source is unresolved. The FUV colour bar can be scaled to a flux density by the inverse sensitivity
4.392 × 10⁻¹⁷ erg cm−2 Å−1 electron−1. The centroids of both panels are aligned, with east left and north up.
MNRAS 451, 3768–3800 (2015)
atSpaceTelescopeScienceInstituteonJuly9,2015http://mnras.oxfordjournals.org/Downloadedfrom
FUV morphology of cool core BCGs 3791
Figure A2. A multiwavelength view of the Abell 1068 BCG (z = 0.1375). X-ray, FUV continuum, and broad-band optical images are shown in the top-left,
centre, and right-hand panels, respectively. Contours of constant FUV continuum surface brightness are overlaid in blue on the X-ray panel, and in white on
the optical panel. The white cross on the FUV panel marks the location of the unresolved radio source. The FUV colour bar can be scaled to a flux density by
the inverse sensitivity 4.392 × 10⁻¹⁷ erg cm−2 Å−1 electron−1. The white box on the X-ray panel marks the FOV of the two rightmost panels. The bottom
panel shows the same broad-band optical image in a different colour scale, a wider FOV, and with FUV contours shown in white. The nearby companions
are labelled ‘D’ and ‘E’ to correspond to the notation used by McNamara et al. (2004) in their discussion of these companions as possible gas donors. The
centroids of all panels are aligned, with east left and north up.
MNRAS 451, 3768–3800 (2015)
atSpaceTelescopeScienceInstituteonJuly9,2015http://mnras.oxfordjournals.org/Downloadedfrom
3792 G. R. Tremblay et al.
Figure A3. The Abell 1664 BCG (z = 0.1283). The X-ray, FUV continuum, and broad-band optical unsharp mask images are shown in the left-hand, centre,
and right-hand panels, respectively. Lyα contours are overlaid in black (on the X-ray panel) and green (on the FUV and optical panels). The radio source is
unresolved. The FUV colour bar can be scaled to a flux density by the inverse sensitivity 4.392 × 10⁻¹⁷ erg cm−2 Å−1 electron−1. The centroids of all panels
are aligned, with east left and north up.
Figure A4. The Abell 1795 BCG (z = 0.0625). The X-ray, FUV continuum, and broad-band optical unsharp mask images are shown in the left-hand, centre,
and right-hand panels, respectively. FUV contours are overlaid in blue and green on the X-ray and optical panels, respectively. The radio source is shown in
white and black contours on the X-ray and FUV panels, respectively. Note the remarkable spatial correspondence between the FUV continuum emission and
the radio source. The FUV colour bar can be scaled to a flux density by the inverse sensitivity 2.173 × 10⁻¹⁷ erg cm−2 Å−1 electron−1. The centroids of all
panels are aligned, with east left and north up.
MNRAS 451, 3768–3800 (2015)
atSpaceTelescopeScienceInstituteonJuly9,2015http://mnras.oxfordjournals.org/Downloadedfrom
FUV morphology of cool core BCGs 3793
Figure A5. The Abell 1835 BCG (z = 0.2532). The X-ray unsharp, FUV continuum, and broad-band optical unsharp mask images are shown in the left-hand,
centre, and right-hand panels, respectively. Lyα contours are overlaid in blue on the X-ray panel and in green on the FUV and optical panels. The unresolved
radio source is overlaid in black contours on the FUV panel. The FUV colour bar can be scaled to a flux density by the inverse sensitivity 1.360 × 10⁻¹⁶ erg
cm−2 Å−1 electron−1. The centroids of all panels are aligned, with east left and north up.
MNRAS 451, 3768–3800 (2015)
atSpaceTelescopeScienceInstituteonJuly9,2015http://mnras.oxfordjournals.org/Downloadedfrom
Far ultraviolet morphology_of_star_forming_filaments_in_cool_core_brighest_cluster_galaxies

Weitere ähnliche Inhalte

Was ist angesagt?

T he effect_of_orbital_configuration)_on_the_possible_climates_and_habitabili...
T he effect_of_orbital_configuration)_on_the_possible_climates_and_habitabili...T he effect_of_orbital_configuration)_on_the_possible_climates_and_habitabili...
T he effect_of_orbital_configuration)_on_the_possible_climates_and_habitabili...Sérgio Sacani
 
The three dimensional_structure_of_the_eta_carinae_homunculus
The three dimensional_structure_of_the_eta_carinae_homunculusThe three dimensional_structure_of_the_eta_carinae_homunculus
The three dimensional_structure_of_the_eta_carinae_homunculusSérgio Sacani
 
DISCOVERY OF A GALAXY CLUSTER WITH A VIOLENTLY STARBURSTING CORE AT z = 2:506
DISCOVERY OF A GALAXY CLUSTER WITH A VIOLENTLY STARBURSTING CORE AT z = 2:506DISCOVERY OF A GALAXY CLUSTER WITH A VIOLENTLY STARBURSTING CORE AT z = 2:506
DISCOVERY OF A GALAXY CLUSTER WITH A VIOLENTLY STARBURSTING CORE AT z = 2:506Sérgio Sacani
 
Evidence for a_massive_extended_circumgalactic_medium_around_the_andromeda_ga...
Evidence for a_massive_extended_circumgalactic_medium_around_the_andromeda_ga...Evidence for a_massive_extended_circumgalactic_medium_around_the_andromeda_ga...
Evidence for a_massive_extended_circumgalactic_medium_around_the_andromeda_ga...Sérgio Sacani
 
Exoplanet transit spectroscopy_using_wfc3
Exoplanet transit spectroscopy_using_wfc3Exoplanet transit spectroscopy_using_wfc3
Exoplanet transit spectroscopy_using_wfc3Sérgio Sacani
 
Poster - Simultations of Graphene Growth
Poster - Simultations of Graphene GrowthPoster - Simultations of Graphene Growth
Poster - Simultations of Graphene GrowthGwilym Enstone
 
Submillimeter galaxies as_progenitors_of_compact_quiescent_galaxies
Submillimeter galaxies as_progenitors_of_compact_quiescent_galaxiesSubmillimeter galaxies as_progenitors_of_compact_quiescent_galaxies
Submillimeter galaxies as_progenitors_of_compact_quiescent_galaxiesSérgio Sacani
 
The xmm newton-view_of_the_central_degrees_of_the_milk_way
The xmm newton-view_of_the_central_degrees_of_the_milk_wayThe xmm newton-view_of_the_central_degrees_of_the_milk_way
The xmm newton-view_of_the_central_degrees_of_the_milk_waySérgio Sacani
 
The habitability of Proxima Centauri b - I. Irradiation, rotation and volatil...
The habitability of Proxima Centauri b - I. Irradiation, rotation and volatil...The habitability of Proxima Centauri b - I. Irradiation, rotation and volatil...
The habitability of Proxima Centauri b - I. Irradiation, rotation and volatil...Sérgio Sacani
 
Predictions of the_atmospheric_composition_of_gj_1132_b
Predictions of the_atmospheric_composition_of_gj_1132_bPredictions of the_atmospheric_composition_of_gj_1132_b
Predictions of the_atmospheric_composition_of_gj_1132_bSérgio Sacani
 
One tenth solar_abundances_along_the_body_of-the_stream
One tenth solar_abundances_along_the_body_of-the_streamOne tenth solar_abundances_along_the_body_of-the_stream
One tenth solar_abundances_along_the_body_of-the_streamSérgio Sacani
 
Nuffield Research Report
Nuffield Research ReportNuffield Research Report
Nuffield Research ReportBen Pace
 
Storm in teacup_a_radio_quiet_quasar_with_radio_emitting_bubbles
Storm in teacup_a_radio_quiet_quasar_with_radio_emitting_bubblesStorm in teacup_a_radio_quiet_quasar_with_radio_emitting_bubbles
Storm in teacup_a_radio_quiet_quasar_with_radio_emitting_bubblesSérgio Sacani
 
SPECTROSCOPIC CONFIRMATION OF THE EXISTENCE OF LARGE, DIFFUSE GALAXIES IN THE...
SPECTROSCOPIC CONFIRMATION OF THE EXISTENCE OF LARGE, DIFFUSE GALAXIES IN THE...SPECTROSCOPIC CONFIRMATION OF THE EXISTENCE OF LARGE, DIFFUSE GALAXIES IN THE...
SPECTROSCOPIC CONFIRMATION OF THE EXISTENCE OF LARGE, DIFFUSE GALAXIES IN THE...Sérgio Sacani
 
Evidence for a_complex_enrichment_history_of_the_stream_from_fairall_9_sightline
Evidence for a_complex_enrichment_history_of_the_stream_from_fairall_9_sightlineEvidence for a_complex_enrichment_history_of_the_stream_from_fairall_9_sightline
Evidence for a_complex_enrichment_history_of_the_stream_from_fairall_9_sightlineSérgio Sacani
 
Ecography of young_star_reveals_their_evolution
Ecography of young_star_reveals_their_evolutionEcography of young_star_reveals_their_evolution
Ecography of young_star_reveals_their_evolutionSérgio Sacani
 
Widespread mixing and_burrial_of_earth_hadean_crust_by_asteroid_impacts
Widespread mixing and_burrial_of_earth_hadean_crust_by_asteroid_impactsWidespread mixing and_burrial_of_earth_hadean_crust_by_asteroid_impacts
Widespread mixing and_burrial_of_earth_hadean_crust_by_asteroid_impactsSérgio Sacani
 
On the possibility of through passage of asteroid bodies across the Earth’s a...
On the possibility of through passage of asteroid bodies across the Earth’s a...On the possibility of through passage of asteroid bodies across the Earth’s a...
On the possibility of through passage of asteroid bodies across the Earth’s a...Sérgio Sacani
 
Prebiotic chemicals in_the_coma_of_comet_67_p_churyumov_gerasimenko
Prebiotic chemicals in_the_coma_of_comet_67_p_churyumov_gerasimenkoPrebiotic chemicals in_the_coma_of_comet_67_p_churyumov_gerasimenko
Prebiotic chemicals in_the_coma_of_comet_67_p_churyumov_gerasimenkoSérgio Sacani
 
HL Galaxy Metabolism
HL Galaxy MetabolismHL Galaxy Metabolism
HL Galaxy MetabolismHenry Lee
 

Was ist angesagt? (20)

T he effect_of_orbital_configuration)_on_the_possible_climates_and_habitabili...
T he effect_of_orbital_configuration)_on_the_possible_climates_and_habitabili...T he effect_of_orbital_configuration)_on_the_possible_climates_and_habitabili...
T he effect_of_orbital_configuration)_on_the_possible_climates_and_habitabili...
 
The three dimensional_structure_of_the_eta_carinae_homunculus
The three dimensional_structure_of_the_eta_carinae_homunculusThe three dimensional_structure_of_the_eta_carinae_homunculus
The three dimensional_structure_of_the_eta_carinae_homunculus
 
DISCOVERY OF A GALAXY CLUSTER WITH A VIOLENTLY STARBURSTING CORE AT z = 2:506
DISCOVERY OF A GALAXY CLUSTER WITH A VIOLENTLY STARBURSTING CORE AT z = 2:506DISCOVERY OF A GALAXY CLUSTER WITH A VIOLENTLY STARBURSTING CORE AT z = 2:506
DISCOVERY OF A GALAXY CLUSTER WITH A VIOLENTLY STARBURSTING CORE AT z = 2:506
 
Evidence for a_massive_extended_circumgalactic_medium_around_the_andromeda_ga...
Evidence for a_massive_extended_circumgalactic_medium_around_the_andromeda_ga...Evidence for a_massive_extended_circumgalactic_medium_around_the_andromeda_ga...
Evidence for a_massive_extended_circumgalactic_medium_around_the_andromeda_ga...
 
Exoplanet transit spectroscopy_using_wfc3
Exoplanet transit spectroscopy_using_wfc3Exoplanet transit spectroscopy_using_wfc3
Exoplanet transit spectroscopy_using_wfc3
 
Poster - Simultations of Graphene Growth
Poster - Simultations of Graphene GrowthPoster - Simultations of Graphene Growth
Poster - Simultations of Graphene Growth
 
Submillimeter galaxies as_progenitors_of_compact_quiescent_galaxies
Submillimeter galaxies as_progenitors_of_compact_quiescent_galaxiesSubmillimeter galaxies as_progenitors_of_compact_quiescent_galaxies
Submillimeter galaxies as_progenitors_of_compact_quiescent_galaxies
 
The xmm newton-view_of_the_central_degrees_of_the_milk_way
The xmm newton-view_of_the_central_degrees_of_the_milk_wayThe xmm newton-view_of_the_central_degrees_of_the_milk_way
The xmm newton-view_of_the_central_degrees_of_the_milk_way
 
The habitability of Proxima Centauri b - I. Irradiation, rotation and volatil...
The habitability of Proxima Centauri b - I. Irradiation, rotation and volatil...The habitability of Proxima Centauri b - I. Irradiation, rotation and volatil...
The habitability of Proxima Centauri b - I. Irradiation, rotation and volatil...
 
Predictions of the_atmospheric_composition_of_gj_1132_b
Predictions of the_atmospheric_composition_of_gj_1132_bPredictions of the_atmospheric_composition_of_gj_1132_b
Predictions of the_atmospheric_composition_of_gj_1132_b
 
One tenth solar_abundances_along_the_body_of-the_stream
One tenth solar_abundances_along_the_body_of-the_streamOne tenth solar_abundances_along_the_body_of-the_stream
One tenth solar_abundances_along_the_body_of-the_stream
 
Nuffield Research Report
Nuffield Research ReportNuffield Research Report
Nuffield Research Report
 
Storm in teacup_a_radio_quiet_quasar_with_radio_emitting_bubbles
Storm in teacup_a_radio_quiet_quasar_with_radio_emitting_bubblesStorm in teacup_a_radio_quiet_quasar_with_radio_emitting_bubbles
Storm in teacup_a_radio_quiet_quasar_with_radio_emitting_bubbles
 
SPECTROSCOPIC CONFIRMATION OF THE EXISTENCE OF LARGE, DIFFUSE GALAXIES IN THE...
SPECTROSCOPIC CONFIRMATION OF THE EXISTENCE OF LARGE, DIFFUSE GALAXIES IN THE...SPECTROSCOPIC CONFIRMATION OF THE EXISTENCE OF LARGE, DIFFUSE GALAXIES IN THE...
SPECTROSCOPIC CONFIRMATION OF THE EXISTENCE OF LARGE, DIFFUSE GALAXIES IN THE...
 
Evidence for a_complex_enrichment_history_of_the_stream_from_fairall_9_sightline
Evidence for a_complex_enrichment_history_of_the_stream_from_fairall_9_sightlineEvidence for a_complex_enrichment_history_of_the_stream_from_fairall_9_sightline
Evidence for a_complex_enrichment_history_of_the_stream_from_fairall_9_sightline
 
Ecography of young_star_reveals_their_evolution
Ecography of young_star_reveals_their_evolutionEcography of young_star_reveals_their_evolution
Ecography of young_star_reveals_their_evolution
 
Widespread mixing and_burrial_of_earth_hadean_crust_by_asteroid_impacts
Widespread mixing and_burrial_of_earth_hadean_crust_by_asteroid_impactsWidespread mixing and_burrial_of_earth_hadean_crust_by_asteroid_impacts
Widespread mixing and_burrial_of_earth_hadean_crust_by_asteroid_impacts
 
On the possibility of through passage of asteroid bodies across the Earth’s a...
On the possibility of through passage of asteroid bodies across the Earth’s a...On the possibility of through passage of asteroid bodies across the Earth’s a...
On the possibility of through passage of asteroid bodies across the Earth’s a...
 
Prebiotic chemicals in_the_coma_of_comet_67_p_churyumov_gerasimenko
Prebiotic chemicals in_the_coma_of_comet_67_p_churyumov_gerasimenkoPrebiotic chemicals in_the_coma_of_comet_67_p_churyumov_gerasimenko
Prebiotic chemicals in_the_coma_of_comet_67_p_churyumov_gerasimenko
 
HL Galaxy Metabolism
HL Galaxy MetabolismHL Galaxy Metabolism
HL Galaxy Metabolism
 

Andere mochten auch

Kic 9632895 the_10_kepler_transiting_circumbinary_planet
Kic 9632895 the_10_kepler_transiting_circumbinary_planetKic 9632895 the_10_kepler_transiting_circumbinary_planet
Kic 9632895 the_10_kepler_transiting_circumbinary_planetSérgio Sacani
 
Early optical spectra_of_nova_v1369_cen_show_the_presence_of_lithium
Early optical spectra_of_nova_v1369_cen_show_the_presence_of_lithiumEarly optical spectra_of_nova_v1369_cen_show_the_presence_of_lithium
Early optical spectra_of_nova_v1369_cen_show_the_presence_of_lithiumSérgio Sacani
 
A giant ring_like_structure_at_078_z_086_displayed_by_gr_bs
A giant ring_like_structure_at_078_z_086_displayed_by_gr_bsA giant ring_like_structure_at_078_z_086_displayed_by_gr_bs
A giant ring_like_structure_at_078_z_086_displayed_by_gr_bsSérgio Sacani
 
Confirmation of the_planetary_microlensing_signal_and_star_and_planet_mass_de...
Confirmation of the_planetary_microlensing_signal_and_star_and_planet_mass_de...Confirmation of the_planetary_microlensing_signal_and_star_and_planet_mass_de...
Confirmation of the_planetary_microlensing_signal_and_star_and_planet_mass_de...Sérgio Sacani
 
Discovery and spectroscopy_of_the_young_jovian_planet_51_eri_b_with_the_gemin...
Discovery and spectroscopy_of_the_young_jovian_planet_51_eri_b_with_the_gemin...Discovery and spectroscopy_of_the_young_jovian_planet_51_eri_b_with_the_gemin...
Discovery and spectroscopy_of_the_young_jovian_planet_51_eri_b_with_the_gemin...Sérgio Sacani
 
The harps n-rocky_planet_search_hd219134b_transiting_rocky_planet
The harps n-rocky_planet_search_hd219134b_transiting_rocky_planetThe harps n-rocky_planet_search_hd219134b_transiting_rocky_planet
The harps n-rocky_planet_search_hd219134b_transiting_rocky_planetSérgio Sacani
 
Confirmation of the_ogle_planet_signature_and_its_characteristics_with_lens_s...
Confirmation of the_ogle_planet_signature_and_its_characteristics_with_lens_s...Confirmation of the_ogle_planet_signature_and_its_characteristics_with_lens_s...
Confirmation of the_ogle_planet_signature_and_its_characteristics_with_lens_s...Sérgio Sacani
 
A 50000 solar_mass_black_hole_in_the_nucleous_of_rgg_118
A 50000 solar_mass_black_hole_in_the_nucleous_of_rgg_118A 50000 solar_mass_black_hole_in_the_nucleous_of_rgg_118
A 50000 solar_mass_black_hole_in_the_nucleous_of_rgg_118Sérgio Sacani
 
An over massive_black_hole_in_a_typical_star_forming_galaxy_2_billion_years_a...
An over massive_black_hole_in_a_typical_star_forming_galaxy_2_billion_years_a...An over massive_black_hole_in_a_typical_star_forming_galaxy_2_billion_years_a...
An over massive_black_hole_in_a_typical_star_forming_galaxy_2_billion_years_a...Sérgio Sacani
 
Lyman alpha emission_from_a_luminous_z8_68_galaxy
Lyman alpha emission_from_a_luminous_z8_68_galaxyLyman alpha emission_from_a_luminous_z8_68_galaxy
Lyman alpha emission_from_a_luminous_z8_68_galaxySérgio Sacani
 
Radio imaging obserations_of_psr_j1023_0038_in_an_lmxb_state
Radio imaging obserations_of_psr_j1023_0038_in_an_lmxb_stateRadio imaging obserations_of_psr_j1023_0038_in_an_lmxb_state
Radio imaging obserations_of_psr_j1023_0038_in_an_lmxb_stateSérgio Sacani
 
Galaxy and mass_assembly_gama_panchromatic_data_release_and__the_low_energy_b...
Galaxy and mass_assembly_gama_panchromatic_data_release_and__the_low_energy_b...Galaxy and mass_assembly_gama_panchromatic_data_release_and__the_low_energy_b...
Galaxy and mass_assembly_gama_panchromatic_data_release_and__the_low_energy_b...Sérgio Sacani
 
Chemical cartography with_apogee_metallicity_distribution_functions_and_the_c...
Chemical cartography with_apogee_metallicity_distribution_functions_and_the_c...Chemical cartography with_apogee_metallicity_distribution_functions_and_the_c...
Chemical cartography with_apogee_metallicity_distribution_functions_and_the_c...Sérgio Sacani
 
High resolution alma_observations_of_sdp81_the_innermost_mass_profile_of_the_...
High resolution alma_observations_of_sdp81_the_innermost_mass_profile_of_the_...High resolution alma_observations_of_sdp81_the_innermost_mass_profile_of_the_...
High resolution alma_observations_of_sdp81_the_innermost_mass_profile_of_the_...Sérgio Sacani
 
Kathryn wheel a_spectacular_galaxy_collision_discoverd_in_the_galactic_neighb...
Kathryn wheel a_spectacular_galaxy_collision_discoverd_in_the_galactic_neighb...Kathryn wheel a_spectacular_galaxy_collision_discoverd_in_the_galactic_neighb...
Kathryn wheel a_spectacular_galaxy_collision_discoverd_in_the_galactic_neighb...Sérgio Sacani
 
Direct imaging and_spectroscopy_of_a_young_extrasolar_kuiper_belt_in_the_near...
Direct imaging and_spectroscopy_of_a_young_extrasolar_kuiper_belt_in_the_near...Direct imaging and_spectroscopy_of_a_young_extrasolar_kuiper_belt_in_the_near...
Direct imaging and_spectroscopy_of_a_young_extrasolar_kuiper_belt_in_the_near...Sérgio Sacani
 

Andere mochten auch (16)

Kic 9632895 the_10_kepler_transiting_circumbinary_planet
Kic 9632895 the_10_kepler_transiting_circumbinary_planetKic 9632895 the_10_kepler_transiting_circumbinary_planet
Kic 9632895 the_10_kepler_transiting_circumbinary_planet
 
Early optical spectra_of_nova_v1369_cen_show_the_presence_of_lithium
Early optical spectra_of_nova_v1369_cen_show_the_presence_of_lithiumEarly optical spectra_of_nova_v1369_cen_show_the_presence_of_lithium
Early optical spectra_of_nova_v1369_cen_show_the_presence_of_lithium
 
A giant ring_like_structure_at_078_z_086_displayed_by_gr_bs
A giant ring_like_structure_at_078_z_086_displayed_by_gr_bsA giant ring_like_structure_at_078_z_086_displayed_by_gr_bs
A giant ring_like_structure_at_078_z_086_displayed_by_gr_bs
 
Confirmation of the_planetary_microlensing_signal_and_star_and_planet_mass_de...
Confirmation of the_planetary_microlensing_signal_and_star_and_planet_mass_de...Confirmation of the_planetary_microlensing_signal_and_star_and_planet_mass_de...
Confirmation of the_planetary_microlensing_signal_and_star_and_planet_mass_de...
 
Discovery and spectroscopy_of_the_young_jovian_planet_51_eri_b_with_the_gemin...
Discovery and spectroscopy_of_the_young_jovian_planet_51_eri_b_with_the_gemin...Discovery and spectroscopy_of_the_young_jovian_planet_51_eri_b_with_the_gemin...
Discovery and spectroscopy_of_the_young_jovian_planet_51_eri_b_with_the_gemin...
 
The harps n-rocky_planet_search_hd219134b_transiting_rocky_planet
The harps n-rocky_planet_search_hd219134b_transiting_rocky_planetThe harps n-rocky_planet_search_hd219134b_transiting_rocky_planet
The harps n-rocky_planet_search_hd219134b_transiting_rocky_planet
 
Confirmation of the_ogle_planet_signature_and_its_characteristics_with_lens_s...
Confirmation of the_ogle_planet_signature_and_its_characteristics_with_lens_s...Confirmation of the_ogle_planet_signature_and_its_characteristics_with_lens_s...
Confirmation of the_ogle_planet_signature_and_its_characteristics_with_lens_s...
 
A 50000 solar_mass_black_hole_in_the_nucleous_of_rgg_118
A 50000 solar_mass_black_hole_in_the_nucleous_of_rgg_118A 50000 solar_mass_black_hole_in_the_nucleous_of_rgg_118
A 50000 solar_mass_black_hole_in_the_nucleous_of_rgg_118
 
An over massive_black_hole_in_a_typical_star_forming_galaxy_2_billion_years_a...
An over massive_black_hole_in_a_typical_star_forming_galaxy_2_billion_years_a...An over massive_black_hole_in_a_typical_star_forming_galaxy_2_billion_years_a...
An over massive_black_hole_in_a_typical_star_forming_galaxy_2_billion_years_a...
 
Lyman alpha emission_from_a_luminous_z8_68_galaxy
Lyman alpha emission_from_a_luminous_z8_68_galaxyLyman alpha emission_from_a_luminous_z8_68_galaxy
Lyman alpha emission_from_a_luminous_z8_68_galaxy
 
Radio imaging obserations_of_psr_j1023_0038_in_an_lmxb_state
Radio imaging obserations_of_psr_j1023_0038_in_an_lmxb_stateRadio imaging obserations_of_psr_j1023_0038_in_an_lmxb_state
Radio imaging obserations_of_psr_j1023_0038_in_an_lmxb_state
 
Galaxy and mass_assembly_gama_panchromatic_data_release_and__the_low_energy_b...
Galaxy and mass_assembly_gama_panchromatic_data_release_and__the_low_energy_b...Galaxy and mass_assembly_gama_panchromatic_data_release_and__the_low_energy_b...
Galaxy and mass_assembly_gama_panchromatic_data_release_and__the_low_energy_b...
 
Chemical cartography with_apogee_metallicity_distribution_functions_and_the_c...
Chemical cartography with_apogee_metallicity_distribution_functions_and_the_c...Chemical cartography with_apogee_metallicity_distribution_functions_and_the_c...
Chemical cartography with_apogee_metallicity_distribution_functions_and_the_c...
 
High resolution alma_observations_of_sdp81_the_innermost_mass_profile_of_the_...
High resolution alma_observations_of_sdp81_the_innermost_mass_profile_of_the_...High resolution alma_observations_of_sdp81_the_innermost_mass_profile_of_the_...
High resolution alma_observations_of_sdp81_the_innermost_mass_profile_of_the_...
 
Kathryn wheel a_spectacular_galaxy_collision_discoverd_in_the_galactic_neighb...
Kathryn wheel a_spectacular_galaxy_collision_discoverd_in_the_galactic_neighb...Kathryn wheel a_spectacular_galaxy_collision_discoverd_in_the_galactic_neighb...
Kathryn wheel a_spectacular_galaxy_collision_discoverd_in_the_galactic_neighb...
 
Direct imaging and_spectroscopy_of_a_young_extrasolar_kuiper_belt_in_the_near...
Direct imaging and_spectroscopy_of_a_young_extrasolar_kuiper_belt_in_the_near...Direct imaging and_spectroscopy_of_a_young_extrasolar_kuiper_belt_in_the_near...
Direct imaging and_spectroscopy_of_a_young_extrasolar_kuiper_belt_in_the_near...
 

Ähnlich wie Far ultraviolet morphology_of_star_forming_filaments_in_cool_core_brighest_cluster_galaxies

The pristine nature of SMSS 1605−1443 revealed by ESPRESSO
The pristine nature of SMSS 1605−1443 revealed by ESPRESSOThe pristine nature of SMSS 1605−1443 revealed by ESPRESSO
The pristine nature of SMSS 1605−1443 revealed by ESPRESSOSérgio Sacani
 
First emergence of cold accretion and supermassive star formation in the earl...
First emergence of cold accretion and supermassive star formation in the earl...First emergence of cold accretion and supermassive star formation in the earl...
First emergence of cold accretion and supermassive star formation in the earl...Sérgio Sacani
 
GASP XVII. HI imaging of the jellyfish galaxy JO206: gas stripping and enhanc...
GASP XVII. HI imaging of the jellyfish galaxy JO206: gas stripping and enhanc...GASP XVII. HI imaging of the jellyfish galaxy JO206: gas stripping and enhanc...
GASP XVII. HI imaging of the jellyfish galaxy JO206: gas stripping and enhanc...Sérgio Sacani
 
EUV fine structure and variability associated with coronal rain revealed by S...
EUV fine structure and variability associated with coronal rain revealed by S...EUV fine structure and variability associated with coronal rain revealed by S...
EUV fine structure and variability associated with coronal rain revealed by S...Sérgio Sacani
 
Evidence for the_thermal_sunyaev-zeldovich_effect_associated_with_quasar_feed...
Evidence for the_thermal_sunyaev-zeldovich_effect_associated_with_quasar_feed...Evidence for the_thermal_sunyaev-zeldovich_effect_associated_with_quasar_feed...
Evidence for the_thermal_sunyaev-zeldovich_effect_associated_with_quasar_feed...Sérgio Sacani
 
Is the atmosphere of the ultra-hot Jupiter WASP-121 b variable?
Is the atmosphere of the ultra-hot Jupiter WASP-121 b variable?Is the atmosphere of the ultra-hot Jupiter WASP-121 b variable?
Is the atmosphere of the ultra-hot Jupiter WASP-121 b variable?Sérgio Sacani
 
3D stellar evolution: hydrodynamic simulations of a complete burning phase in...
3D stellar evolution: hydrodynamic simulations of a complete burning phase in...3D stellar evolution: hydrodynamic simulations of a complete burning phase in...
3D stellar evolution: hydrodynamic simulations of a complete burning phase in...Sérgio Sacani
 
Detection of anisotropic satellite quenching in galaxy clusters up to z ∼ 1
Detection of anisotropic satellite quenching in galaxy clusters up to z ∼ 1Detection of anisotropic satellite quenching in galaxy clusters up to z ∼ 1
Detection of anisotropic satellite quenching in galaxy clusters up to z ∼ 1Sérgio Sacani
 
The SAMI Galaxy Sur v ey: galaxy spin is more strongly correlated with stella...
The SAMI Galaxy Sur v ey: galaxy spin is more strongly correlated with stella...The SAMI Galaxy Sur v ey: galaxy spin is more strongly correlated with stella...
The SAMI Galaxy Sur v ey: galaxy spin is more strongly correlated with stella...Sérgio Sacani
 
A rare case of FR I interaction with a hot X-ray bridge in the A2384 galaxy c...
A rare case of FR I interaction with a hot X-ray bridge in the A2384 galaxy c...A rare case of FR I interaction with a hot X-ray bridge in the A2384 galaxy c...
A rare case of FR I interaction with a hot X-ray bridge in the A2384 galaxy c...Sérgio Sacani
 
A Spatially Resolved Analysis of Star Formation Burstiness by Comparing UV an...
A Spatially Resolved Analysis of Star Formation Burstiness by Comparing UV an...A Spatially Resolved Analysis of Star Formation Burstiness by Comparing UV an...
A Spatially Resolved Analysis of Star Formation Burstiness by Comparing UV an...Sérgio Sacani
 
Refining the OJ 287 2022 impact flare arrival epoch
Refining the OJ 287 2022 impact flare arrival epochRefining the OJ 287 2022 impact flare arrival epoch
Refining the OJ 287 2022 impact flare arrival epochSérgio Sacani
 
Eso1426a
Eso1426aEso1426a
Eso1426aGOASA
 
Interior Heating of Rocky Exoplanets from Stellar Flares with Application to ...
Interior Heating of Rocky Exoplanets from Stellar Flares with Application to ...Interior Heating of Rocky Exoplanets from Stellar Flares with Application to ...
Interior Heating of Rocky Exoplanets from Stellar Flares with Application to ...Sérgio Sacani
 
The identification of_93_day_periodic_photometric_variability_for_yso_ylw_16a
The identification of_93_day_periodic_photometric_variability_for_yso_ylw_16aThe identification of_93_day_periodic_photometric_variability_for_yso_ylw_16a
The identification of_93_day_periodic_photometric_variability_for_yso_ylw_16aSérgio Sacani
 
The physical conditions_in_a_pre_super_star_cluster_molecular_cloud_in_the_an...
The physical conditions_in_a_pre_super_star_cluster_molecular_cloud_in_the_an...The physical conditions_in_a_pre_super_star_cluster_molecular_cloud_in_the_an...
The physical conditions_in_a_pre_super_star_cluster_molecular_cloud_in_the_an...Sérgio Sacani
 
Galaxy interactions are the dominant trigger for local type 2 quasars
Galaxy interactions are the dominant trigger for local type 2 quasarsGalaxy interactions are the dominant trigger for local type 2 quasars
Galaxy interactions are the dominant trigger for local type 2 quasarsSérgio Sacani
 
Muscle w49a data_and_mass_structure_of_the_giant_molecular_cloud
Muscle w49a data_and_mass_structure_of_the_giant_molecular_cloudMuscle w49a data_and_mass_structure_of_the_giant_molecular_cloud
Muscle w49a data_and_mass_structure_of_the_giant_molecular_cloudSérgio Sacani
 
GBT/MUSTANG-2 900 resolution imaging of the SZ effect in MS0735.6+7421 Confir...
GBT/MUSTANG-2 900 resolution imaging of the SZ effect in MS0735.6+7421 Confir...GBT/MUSTANG-2 900 resolution imaging of the SZ effect in MS0735.6+7421 Confir...
GBT/MUSTANG-2 900 resolution imaging of the SZ effect in MS0735.6+7421 Confir...Sérgio Sacani
 

Ähnlich wie Far ultraviolet morphology_of_star_forming_filaments_in_cool_core_brighest_cluster_galaxies (20)

The pristine nature of SMSS 1605−1443 revealed by ESPRESSO
The pristine nature of SMSS 1605−1443 revealed by ESPRESSOThe pristine nature of SMSS 1605−1443 revealed by ESPRESSO
The pristine nature of SMSS 1605−1443 revealed by ESPRESSO
 
First emergence of cold accretion and supermassive star formation in the earl...
First emergence of cold accretion and supermassive star formation in the earl...First emergence of cold accretion and supermassive star formation in the earl...
First emergence of cold accretion and supermassive star formation in the earl...
 
GASP XVII. HI imaging of the jellyfish galaxy JO206: gas stripping and enhanc...
GASP XVII. HI imaging of the jellyfish galaxy JO206: gas stripping and enhanc...GASP XVII. HI imaging of the jellyfish galaxy JO206: gas stripping and enhanc...
GASP XVII. HI imaging of the jellyfish galaxy JO206: gas stripping and enhanc...
 
EUV fine structure and variability associated with coronal rain revealed by S...
EUV fine structure and variability associated with coronal rain revealed by S...EUV fine structure and variability associated with coronal rain revealed by S...
EUV fine structure and variability associated with coronal rain revealed by S...
 
Evidence for the_thermal_sunyaev-zeldovich_effect_associated_with_quasar_feed...
Evidence for the_thermal_sunyaev-zeldovich_effect_associated_with_quasar_feed...Evidence for the_thermal_sunyaev-zeldovich_effect_associated_with_quasar_feed...
Evidence for the_thermal_sunyaev-zeldovich_effect_associated_with_quasar_feed...
 
Is the atmosphere of the ultra-hot Jupiter WASP-121 b variable?
Is the atmosphere of the ultra-hot Jupiter WASP-121 b variable?Is the atmosphere of the ultra-hot Jupiter WASP-121 b variable?
Is the atmosphere of the ultra-hot Jupiter WASP-121 b variable?
 
Eso1147a
Eso1147aEso1147a
Eso1147a
 
3D stellar evolution: hydrodynamic simulations of a complete burning phase in...
3D stellar evolution: hydrodynamic simulations of a complete burning phase in...3D stellar evolution: hydrodynamic simulations of a complete burning phase in...
3D stellar evolution: hydrodynamic simulations of a complete burning phase in...
 
Detection of anisotropic satellite quenching in galaxy clusters up to z ∼ 1
Detection of anisotropic satellite quenching in galaxy clusters up to z ∼ 1Detection of anisotropic satellite quenching in galaxy clusters up to z ∼ 1
Detection of anisotropic satellite quenching in galaxy clusters up to z ∼ 1
 
The SAMI Galaxy Sur v ey: galaxy spin is more strongly correlated with stella...
The SAMI Galaxy Sur v ey: galaxy spin is more strongly correlated with stella...The SAMI Galaxy Sur v ey: galaxy spin is more strongly correlated with stella...
The SAMI Galaxy Sur v ey: galaxy spin is more strongly correlated with stella...
 
A rare case of FR I interaction with a hot X-ray bridge in the A2384 galaxy c...
A rare case of FR I interaction with a hot X-ray bridge in the A2384 galaxy c...A rare case of FR I interaction with a hot X-ray bridge in the A2384 galaxy c...
A rare case of FR I interaction with a hot X-ray bridge in the A2384 galaxy c...
 
A Spatially Resolved Analysis of Star Formation Burstiness by Comparing UV an...
A Spatially Resolved Analysis of Star Formation Burstiness by Comparing UV an...A Spatially Resolved Analysis of Star Formation Burstiness by Comparing UV an...
A Spatially Resolved Analysis of Star Formation Burstiness by Comparing UV an...
 
Refining the OJ 287 2022 impact flare arrival epoch
Refining the OJ 287 2022 impact flare arrival epochRefining the OJ 287 2022 impact flare arrival epoch
Refining the OJ 287 2022 impact flare arrival epoch
 
Eso1426a
Eso1426aEso1426a
Eso1426a
 
Interior Heating of Rocky Exoplanets from Stellar Flares with Application to ...
Interior Heating of Rocky Exoplanets from Stellar Flares with Application to ...Interior Heating of Rocky Exoplanets from Stellar Flares with Application to ...
Interior Heating of Rocky Exoplanets from Stellar Flares with Application to ...
 
The identification of_93_day_periodic_photometric_variability_for_yso_ylw_16a
The identification of_93_day_periodic_photometric_variability_for_yso_ylw_16aThe identification of_93_day_periodic_photometric_variability_for_yso_ylw_16a
The identification of_93_day_periodic_photometric_variability_for_yso_ylw_16a
 
The physical conditions_in_a_pre_super_star_cluster_molecular_cloud_in_the_an...
The physical conditions_in_a_pre_super_star_cluster_molecular_cloud_in_the_an...The physical conditions_in_a_pre_super_star_cluster_molecular_cloud_in_the_an...
The physical conditions_in_a_pre_super_star_cluster_molecular_cloud_in_the_an...
 
Galaxy interactions are the dominant trigger for local type 2 quasars
Galaxy interactions are the dominant trigger for local type 2 quasarsGalaxy interactions are the dominant trigger for local type 2 quasars
Galaxy interactions are the dominant trigger for local type 2 quasars
 
Muscle w49a data_and_mass_structure_of_the_giant_molecular_cloud
Muscle w49a data_and_mass_structure_of_the_giant_molecular_cloudMuscle w49a data_and_mass_structure_of_the_giant_molecular_cloud
Muscle w49a data_and_mass_structure_of_the_giant_molecular_cloud
 
GBT/MUSTANG-2 900 resolution imaging of the SZ effect in MS0735.6+7421 Confir...
GBT/MUSTANG-2 900 resolution imaging of the SZ effect in MS0735.6+7421 Confir...GBT/MUSTANG-2 900 resolution imaging of the SZ effect in MS0735.6+7421 Confir...
GBT/MUSTANG-2 900 resolution imaging of the SZ effect in MS0735.6+7421 Confir...
 

Mehr von Sérgio Sacani

X-rays from a Central “Exhaust Vent” of the Galactic Center Chimney
X-rays from a Central “Exhaust Vent” of the Galactic Center ChimneyX-rays from a Central “Exhaust Vent” of the Galactic Center Chimney
X-rays from a Central “Exhaust Vent” of the Galactic Center ChimneySérgio Sacani
 
Efficient spin-up of Earth System Models usingsequence acceleration
Efficient spin-up of Earth System Models usingsequence accelerationEfficient spin-up of Earth System Models usingsequence acceleration
Efficient spin-up of Earth System Models usingsequence accelerationSérgio Sacani
 
TransientOffsetin14CAftertheCarringtonEventRecordedbyPolarTreeRings
TransientOffsetin14CAftertheCarringtonEventRecordedbyPolarTreeRingsTransientOffsetin14CAftertheCarringtonEventRecordedbyPolarTreeRings
TransientOffsetin14CAftertheCarringtonEventRecordedbyPolarTreeRingsSérgio Sacani
 
Biogenic Sulfur Gases as Biosignatures on Temperate Sub-Neptune Waterworlds
Biogenic Sulfur Gases as Biosignatures on Temperate Sub-Neptune WaterworldsBiogenic Sulfur Gases as Biosignatures on Temperate Sub-Neptune Waterworlds
Biogenic Sulfur Gases as Biosignatures on Temperate Sub-Neptune WaterworldsSérgio Sacani
 
Asymmetry in the atmosphere of the ultra-hot Jupiter WASP-76 b
Asymmetry in the atmosphere of the ultra-hot Jupiter WASP-76 bAsymmetry in the atmosphere of the ultra-hot Jupiter WASP-76 b
Asymmetry in the atmosphere of the ultra-hot Jupiter WASP-76 bSérgio Sacani
 
Formation of low mass protostars and their circumstellar disks
Formation of low mass protostars and their circumstellar disksFormation of low mass protostars and their circumstellar disks
Formation of low mass protostars and their circumstellar disksSérgio Sacani
 
Nightside clouds and disequilibrium chemistry on the hot Jupiter WASP-43b
Nightside clouds and disequilibrium chemistry on the hot Jupiter WASP-43bNightside clouds and disequilibrium chemistry on the hot Jupiter WASP-43b
Nightside clouds and disequilibrium chemistry on the hot Jupiter WASP-43bSérgio Sacani
 
Discovery of an Accretion Streamer and a Slow Wide-angle Outflow around FUOri...
Discovery of an Accretion Streamer and a Slow Wide-angle Outflow around FUOri...Discovery of an Accretion Streamer and a Slow Wide-angle Outflow around FUOri...
Discovery of an Accretion Streamer and a Slow Wide-angle Outflow around FUOri...Sérgio Sacani
 
Disentangling the origin of chemical differences using GHOST
Disentangling the origin of chemical differences using GHOSTDisentangling the origin of chemical differences using GHOST
Disentangling the origin of chemical differences using GHOSTSérgio Sacani
 
All-domain Anomaly Resolution Office U.S. Department of Defense (U) Case: “Eg...
All-domain Anomaly Resolution Office U.S. Department of Defense (U) Case: “Eg...All-domain Anomaly Resolution Office U.S. Department of Defense (U) Case: “Eg...
All-domain Anomaly Resolution Office U.S. Department of Defense (U) Case: “Eg...Sérgio Sacani
 
PossibleEoarcheanRecordsoftheGeomagneticFieldPreservedintheIsuaSupracrustalBe...
PossibleEoarcheanRecordsoftheGeomagneticFieldPreservedintheIsuaSupracrustalBe...PossibleEoarcheanRecordsoftheGeomagneticFieldPreservedintheIsuaSupracrustalBe...
PossibleEoarcheanRecordsoftheGeomagneticFieldPreservedintheIsuaSupracrustalBe...Sérgio Sacani
 
Isotopic evidence of long-lived volcanism on Io
Isotopic evidence of long-lived volcanism on IoIsotopic evidence of long-lived volcanism on Io
Isotopic evidence of long-lived volcanism on IoSérgio Sacani
 
Hubble Asteroid Hunter III. Physical properties of newly found asteroids
Hubble Asteroid Hunter III. Physical properties of newly found asteroidsHubble Asteroid Hunter III. Physical properties of newly found asteroids
Hubble Asteroid Hunter III. Physical properties of newly found asteroidsSérgio Sacani
 
Observational constraints on mergers creating magnetism in massive stars
Observational constraints on mergers creating magnetism in massive starsObservational constraints on mergers creating magnetism in massive stars
Observational constraints on mergers creating magnetism in massive starsSérgio Sacani
 
Observation of Gravitational Waves from the Coalescence of a 2.5–4.5 M⊙ Compa...
Observation of Gravitational Waves from the Coalescence of a 2.5–4.5 M⊙ Compa...Observation of Gravitational Waves from the Coalescence of a 2.5–4.5 M⊙ Compa...
Observation of Gravitational Waves from the Coalescence of a 2.5–4.5 M⊙ Compa...Sérgio Sacani
 
Is Betelgeuse Really Rotating? Synthetic ALMA Observations of Large-scale Con...
Is Betelgeuse Really Rotating? Synthetic ALMA Observations of Large-scale Con...Is Betelgeuse Really Rotating? Synthetic ALMA Observations of Large-scale Con...
Is Betelgeuse Really Rotating? Synthetic ALMA Observations of Large-scale Con...Sérgio Sacani
 
First Direct Imaging of a Kelvin–Helmholtz Instability by PSP/WISPR
First Direct Imaging of a Kelvin–Helmholtz Instability by PSP/WISPRFirst Direct Imaging of a Kelvin–Helmholtz Instability by PSP/WISPR
First Direct Imaging of a Kelvin–Helmholtz Instability by PSP/WISPRSérgio Sacani
 
The Sun’s differential rotation is controlled by high- latitude baroclinicall...
The Sun’s differential rotation is controlled by high- latitude baroclinicall...The Sun’s differential rotation is controlled by high- latitude baroclinicall...
The Sun’s differential rotation is controlled by high- latitude baroclinicall...Sérgio Sacani
 
Hydrogen Column Density Variability in a Sample of Local Compton-Thin AGN
Hydrogen Column Density Variability in a Sample of Local Compton-Thin AGNHydrogen Column Density Variability in a Sample of Local Compton-Thin AGN
Hydrogen Column Density Variability in a Sample of Local Compton-Thin AGNSérgio Sacani
 
Huygens - Exploring Titan A Mysterious World
Huygens - Exploring Titan A Mysterious WorldHuygens - Exploring Titan A Mysterious World
Huygens - Exploring Titan A Mysterious WorldSérgio Sacani
 

Mehr von Sérgio Sacani (20)

X-rays from a Central “Exhaust Vent” of the Galactic Center Chimney
X-rays from a Central “Exhaust Vent” of the Galactic Center ChimneyX-rays from a Central “Exhaust Vent” of the Galactic Center Chimney
X-rays from a Central “Exhaust Vent” of the Galactic Center Chimney
 
Efficient spin-up of Earth System Models usingsequence acceleration
Efficient spin-up of Earth System Models usingsequence accelerationEfficient spin-up of Earth System Models usingsequence acceleration
Efficient spin-up of Earth System Models usingsequence acceleration
 
TransientOffsetin14CAftertheCarringtonEventRecordedbyPolarTreeRings
TransientOffsetin14CAftertheCarringtonEventRecordedbyPolarTreeRingsTransientOffsetin14CAftertheCarringtonEventRecordedbyPolarTreeRings
TransientOffsetin14CAftertheCarringtonEventRecordedbyPolarTreeRings
 
Biogenic Sulfur Gases as Biosignatures on Temperate Sub-Neptune Waterworlds
Biogenic Sulfur Gases as Biosignatures on Temperate Sub-Neptune WaterworldsBiogenic Sulfur Gases as Biosignatures on Temperate Sub-Neptune Waterworlds
Biogenic Sulfur Gases as Biosignatures on Temperate Sub-Neptune Waterworlds
 
Asymmetry in the atmosphere of the ultra-hot Jupiter WASP-76 b
Asymmetry in the atmosphere of the ultra-hot Jupiter WASP-76 bAsymmetry in the atmosphere of the ultra-hot Jupiter WASP-76 b
Asymmetry in the atmosphere of the ultra-hot Jupiter WASP-76 b
 
Formation of low mass protostars and their circumstellar disks
Formation of low mass protostars and their circumstellar disksFormation of low mass protostars and their circumstellar disks
Formation of low mass protostars and their circumstellar disks
 
Nightside clouds and disequilibrium chemistry on the hot Jupiter WASP-43b
Nightside clouds and disequilibrium chemistry on the hot Jupiter WASP-43bNightside clouds and disequilibrium chemistry on the hot Jupiter WASP-43b
Nightside clouds and disequilibrium chemistry on the hot Jupiter WASP-43b
 
Discovery of an Accretion Streamer and a Slow Wide-angle Outflow around FUOri...
Discovery of an Accretion Streamer and a Slow Wide-angle Outflow around FUOri...Discovery of an Accretion Streamer and a Slow Wide-angle Outflow around FUOri...
Discovery of an Accretion Streamer and a Slow Wide-angle Outflow around FUOri...
 
Disentangling the origin of chemical differences using GHOST
Disentangling the origin of chemical differences using GHOSTDisentangling the origin of chemical differences using GHOST
Disentangling the origin of chemical differences using GHOST
 
All-domain Anomaly Resolution Office U.S. Department of Defense (U) Case: “Eg...
All-domain Anomaly Resolution Office U.S. Department of Defense (U) Case: “Eg...All-domain Anomaly Resolution Office U.S. Department of Defense (U) Case: “Eg...
All-domain Anomaly Resolution Office U.S. Department of Defense (U) Case: “Eg...
 
PossibleEoarcheanRecordsoftheGeomagneticFieldPreservedintheIsuaSupracrustalBe...
PossibleEoarcheanRecordsoftheGeomagneticFieldPreservedintheIsuaSupracrustalBe...PossibleEoarcheanRecordsoftheGeomagneticFieldPreservedintheIsuaSupracrustalBe...
PossibleEoarcheanRecordsoftheGeomagneticFieldPreservedintheIsuaSupracrustalBe...
 
Isotopic evidence of long-lived volcanism on Io
Isotopic evidence of long-lived volcanism on IoIsotopic evidence of long-lived volcanism on Io
Isotopic evidence of long-lived volcanism on Io
 
Hubble Asteroid Hunter III. Physical properties of newly found asteroids
Hubble Asteroid Hunter III. Physical properties of newly found asteroidsHubble Asteroid Hunter III. Physical properties of newly found asteroids
Hubble Asteroid Hunter III. Physical properties of newly found asteroids
 
Observational constraints on mergers creating magnetism in massive stars
Observational constraints on mergers creating magnetism in massive starsObservational constraints on mergers creating magnetism in massive stars
Observational constraints on mergers creating magnetism in massive stars
 
Observation of Gravitational Waves from the Coalescence of a 2.5–4.5 M⊙ Compa...
Observation of Gravitational Waves from the Coalescence of a 2.5–4.5 M⊙ Compa...Observation of Gravitational Waves from the Coalescence of a 2.5–4.5 M⊙ Compa...
Observation of Gravitational Waves from the Coalescence of a 2.5–4.5 M⊙ Compa...
 
Is Betelgeuse Really Rotating? Synthetic ALMA Observations of Large-scale Con...
Is Betelgeuse Really Rotating? Synthetic ALMA Observations of Large-scale Con...Is Betelgeuse Really Rotating? Synthetic ALMA Observations of Large-scale Con...
Is Betelgeuse Really Rotating? Synthetic ALMA Observations of Large-scale Con...
 
First Direct Imaging of a Kelvin–Helmholtz Instability by PSP/WISPR
First Direct Imaging of a Kelvin–Helmholtz Instability by PSP/WISPRFirst Direct Imaging of a Kelvin–Helmholtz Instability by PSP/WISPR
First Direct Imaging of a Kelvin–Helmholtz Instability by PSP/WISPR
 
The Sun’s differential rotation is controlled by high- latitude baroclinicall...
The Sun’s differential rotation is controlled by high- latitude baroclinicall...The Sun’s differential rotation is controlled by high- latitude baroclinicall...
The Sun’s differential rotation is controlled by high- latitude baroclinicall...
 
Hydrogen Column Density Variability in a Sample of Local Compton-Thin AGN
Hydrogen Column Density Variability in a Sample of Local Compton-Thin AGNHydrogen Column Density Variability in a Sample of Local Compton-Thin AGN
Hydrogen Column Density Variability in a Sample of Local Compton-Thin AGN
 
Huygens - Exploring Titan A Mysterious World
Huygens - Exploring Titan A Mysterious WorldHuygens - Exploring Titan A Mysterious World
Huygens - Exploring Titan A Mysterious World
 

Kürzlich hochgeladen

(May 9, 2024) Enhanced Ultrafast Vector Flow Imaging (VFI) Using Multi-Angle ...
(May 9, 2024) Enhanced Ultrafast Vector Flow Imaging (VFI) Using Multi-Angle ...(May 9, 2024) Enhanced Ultrafast Vector Flow Imaging (VFI) Using Multi-Angle ...
(May 9, 2024) Enhanced Ultrafast Vector Flow Imaging (VFI) Using Multi-Angle ...Scintica Instrumentation
 
module for grade 9 for distance learning
module for grade 9 for distance learningmodule for grade 9 for distance learning
module for grade 9 for distance learninglevieagacer
 
Factory Acceptance Test( FAT).pptx .
Factory Acceptance Test( FAT).pptx       .Factory Acceptance Test( FAT).pptx       .
Factory Acceptance Test( FAT).pptx .Poonam Aher Patil
 
Module for Grade 9 for Asynchronous/Distance learning
Module for Grade 9 for Asynchronous/Distance learningModule for Grade 9 for Asynchronous/Distance learning
Module for Grade 9 for Asynchronous/Distance learninglevieagacer
 
GBSN - Microbiology (Unit 3)Defense Mechanism of the body
GBSN - Microbiology (Unit 3)Defense Mechanism of the body GBSN - Microbiology (Unit 3)Defense Mechanism of the body
GBSN - Microbiology (Unit 3)Defense Mechanism of the body Areesha Ahmad
 
Reboulia: features, anatomy, morphology etc.
Reboulia: features, anatomy, morphology etc.Reboulia: features, anatomy, morphology etc.
Reboulia: features, anatomy, morphology etc.Silpa
 
development of diagnostic enzyme assay to detect leuser virus
development of diagnostic enzyme assay to detect leuser virusdevelopment of diagnostic enzyme assay to detect leuser virus
development of diagnostic enzyme assay to detect leuser virusNazaninKarimi6
 
Human genetics..........................pptx
Human genetics..........................pptxHuman genetics..........................pptx
Human genetics..........................pptxSilpa
 
GBSN - Biochemistry (Unit 2) Basic concept of organic chemistry
GBSN - Biochemistry (Unit 2) Basic concept of organic chemistry GBSN - Biochemistry (Unit 2) Basic concept of organic chemistry
GBSN - Biochemistry (Unit 2) Basic concept of organic chemistry Areesha Ahmad
 
POGONATUM : morphology, anatomy, reproduction etc.
POGONATUM : morphology, anatomy, reproduction etc.POGONATUM : morphology, anatomy, reproduction etc.
POGONATUM : morphology, anatomy, reproduction etc.Silpa
 
Role of AI in seed science Predictive modelling and Beyond.pptx
Role of AI in seed science  Predictive modelling and  Beyond.pptxRole of AI in seed science  Predictive modelling and  Beyond.pptx
Role of AI in seed science Predictive modelling and Beyond.pptxArvind Kumar
 
Call Girls Ahmedabad +917728919243 call me Independent Escort Service
Call Girls Ahmedabad +917728919243 call me Independent Escort ServiceCall Girls Ahmedabad +917728919243 call me Independent Escort Service
Call Girls Ahmedabad +917728919243 call me Independent Escort Serviceshivanisharma5244
 
Dr. E. Muralinath_ Blood indices_clinical aspects
Dr. E. Muralinath_ Blood indices_clinical  aspectsDr. E. Muralinath_ Blood indices_clinical  aspects
Dr. E. Muralinath_ Blood indices_clinical aspectsmuralinath2
 
FAIRSpectra - Enabling the FAIRification of Analytical Science
FAIRSpectra - Enabling the FAIRification of Analytical ScienceFAIRSpectra - Enabling the FAIRification of Analytical Science
FAIRSpectra - Enabling the FAIRification of Analytical ScienceAlex Henderson
 
Bhiwandi Bhiwandi ❤CALL GIRL 7870993772 ❤CALL GIRLS ESCORT SERVICE In Bhiwan...
Bhiwandi Bhiwandi ❤CALL GIRL 7870993772 ❤CALL GIRLS  ESCORT SERVICE In Bhiwan...Bhiwandi Bhiwandi ❤CALL GIRL 7870993772 ❤CALL GIRLS  ESCORT SERVICE In Bhiwan...
Bhiwandi Bhiwandi ❤CALL GIRL 7870993772 ❤CALL GIRLS ESCORT SERVICE In Bhiwan...Monika Rani
 
Zoology 5th semester notes( Sumit_yadav).pdf
Zoology 5th semester notes( Sumit_yadav).pdfZoology 5th semester notes( Sumit_yadav).pdf
Zoology 5th semester notes( Sumit_yadav).pdfSumit Kumar yadav
 
Climate Change Impacts on Terrestrial and Aquatic Ecosystems.pptx
Climate Change Impacts on Terrestrial and Aquatic Ecosystems.pptxClimate Change Impacts on Terrestrial and Aquatic Ecosystems.pptx
Climate Change Impacts on Terrestrial and Aquatic Ecosystems.pptxDiariAli
 
LUNULARIA -features, morphology, anatomy ,reproduction etc.
LUNULARIA -features, morphology, anatomy ,reproduction etc.LUNULARIA -features, morphology, anatomy ,reproduction etc.
LUNULARIA -features, morphology, anatomy ,reproduction etc.Silpa
 
FAIRSpectra - Enabling the FAIRification of Spectroscopy and Spectrometry
FAIRSpectra - Enabling the FAIRification of Spectroscopy and SpectrometryFAIRSpectra - Enabling the FAIRification of Spectroscopy and Spectrometry
FAIRSpectra - Enabling the FAIRification of Spectroscopy and SpectrometryAlex Henderson
 

Kürzlich hochgeladen (20)

(May 9, 2024) Enhanced Ultrafast Vector Flow Imaging (VFI) Using Multi-Angle ...
(May 9, 2024) Enhanced Ultrafast Vector Flow Imaging (VFI) Using Multi-Angle ...(May 9, 2024) Enhanced Ultrafast Vector Flow Imaging (VFI) Using Multi-Angle ...
(May 9, 2024) Enhanced Ultrafast Vector Flow Imaging (VFI) Using Multi-Angle ...
 
module for grade 9 for distance learning
module for grade 9 for distance learningmodule for grade 9 for distance learning
module for grade 9 for distance learning
 
Factory Acceptance Test( FAT).pptx .
Factory Acceptance Test( FAT).pptx       .Factory Acceptance Test( FAT).pptx       .
Factory Acceptance Test( FAT).pptx .
 
Module for Grade 9 for Asynchronous/Distance learning
Module for Grade 9 for Asynchronous/Distance learningModule for Grade 9 for Asynchronous/Distance learning
Module for Grade 9 for Asynchronous/Distance learning
 
GBSN - Microbiology (Unit 3)Defense Mechanism of the body
GBSN - Microbiology (Unit 3)Defense Mechanism of the body GBSN - Microbiology (Unit 3)Defense Mechanism of the body
GBSN - Microbiology (Unit 3)Defense Mechanism of the body
 
Clean In Place(CIP).pptx .
Clean In Place(CIP).pptx                 .Clean In Place(CIP).pptx                 .
Clean In Place(CIP).pptx .
 
Reboulia: features, anatomy, morphology etc.
Reboulia: features, anatomy, morphology etc.Reboulia: features, anatomy, morphology etc.
Reboulia: features, anatomy, morphology etc.
 
development of diagnostic enzyme assay to detect leuser virus
development of diagnostic enzyme assay to detect leuser virusdevelopment of diagnostic enzyme assay to detect leuser virus
development of diagnostic enzyme assay to detect leuser virus
 
Human genetics..........................pptx
Human genetics..........................pptxHuman genetics..........................pptx
Human genetics..........................pptx
 
GBSN - Biochemistry (Unit 2) Basic concept of organic chemistry
GBSN - Biochemistry (Unit 2) Basic concept of organic chemistry GBSN - Biochemistry (Unit 2) Basic concept of organic chemistry
GBSN - Biochemistry (Unit 2) Basic concept of organic chemistry
 
POGONATUM : morphology, anatomy, reproduction etc.
POGONATUM : morphology, anatomy, reproduction etc.POGONATUM : morphology, anatomy, reproduction etc.
POGONATUM : morphology, anatomy, reproduction etc.
 
Role of AI in seed science Predictive modelling and Beyond.pptx
Role of AI in seed science  Predictive modelling and  Beyond.pptxRole of AI in seed science  Predictive modelling and  Beyond.pptx
Role of AI in seed science Predictive modelling and Beyond.pptx
 
Call Girls Ahmedabad +917728919243 call me Independent Escort Service
Call Girls Ahmedabad +917728919243 call me Independent Escort ServiceCall Girls Ahmedabad +917728919243 call me Independent Escort Service
Call Girls Ahmedabad +917728919243 call me Independent Escort Service
 
Dr. E. Muralinath_ Blood indices_clinical aspects
Dr. E. Muralinath_ Blood indices_clinical  aspectsDr. E. Muralinath_ Blood indices_clinical  aspects
Dr. E. Muralinath_ Blood indices_clinical aspects
 
FAIRSpectra - Enabling the FAIRification of Analytical Science
FAIRSpectra - Enabling the FAIRification of Analytical ScienceFAIRSpectra - Enabling the FAIRification of Analytical Science
FAIRSpectra - Enabling the FAIRification of Analytical Science
 
Bhiwandi Bhiwandi ❤CALL GIRL 7870993772 ❤CALL GIRLS ESCORT SERVICE In Bhiwan...
Bhiwandi Bhiwandi ❤CALL GIRL 7870993772 ❤CALL GIRLS  ESCORT SERVICE In Bhiwan...Bhiwandi Bhiwandi ❤CALL GIRL 7870993772 ❤CALL GIRLS  ESCORT SERVICE In Bhiwan...
Bhiwandi Bhiwandi ❤CALL GIRL 7870993772 ❤CALL GIRLS ESCORT SERVICE In Bhiwan...
 
Zoology 5th semester notes( Sumit_yadav).pdf
Zoology 5th semester notes( Sumit_yadav).pdfZoology 5th semester notes( Sumit_yadav).pdf
Zoology 5th semester notes( Sumit_yadav).pdf
 
Climate Change Impacts on Terrestrial and Aquatic Ecosystems.pptx
Climate Change Impacts on Terrestrial and Aquatic Ecosystems.pptxClimate Change Impacts on Terrestrial and Aquatic Ecosystems.pptx
Climate Change Impacts on Terrestrial and Aquatic Ecosystems.pptx
 
LUNULARIA -features, morphology, anatomy ,reproduction etc.
LUNULARIA -features, morphology, anatomy ,reproduction etc.LUNULARIA -features, morphology, anatomy ,reproduction etc.
LUNULARIA -features, morphology, anatomy ,reproduction etc.
 
FAIRSpectra - Enabling the FAIRification of Spectroscopy and Spectrometry
FAIRSpectra - Enabling the FAIRification of Spectroscopy and SpectrometryFAIRSpectra - Enabling the FAIRification of Spectroscopy and Spectrometry
FAIRSpectra - Enabling the FAIRification of Spectroscopy and Spectrometry
 

Far ultraviolet morphology_of_star_forming_filaments_in_cool_core_brighest_cluster_galaxies

  • 1. MNRAS 451, 3768–3800 (2015) doi:10.1093/mnras/stv1151 Far-ultraviolet morphology of star-forming filaments in cool core brightest cluster galaxies G. R. Tremblay,1,2‹ † C. P. O’Dea,3,4 S. A. Baum,3,4,5,6 R. Mittal,6,7 M. A. McDonald,8‡ F. Combes,9 Y. Li,10 B. R. McNamara,11,12 M. N. Bremer,13 T. E. Clarke,14 M. Donahue,15 A. C. Edge,16 A. C. Fabian,17 S. L. Hamer,9 M. T. Hogan,11 J. B. R. Oonk,18 A. C. Quillen,19 J. S. Sanders,20 P. Salom´e9 and G. M. Voit15 Affiliations are listed at the end of the paper Accepted 2015 May 18. Received 2015 May 14; in original form 2015 April 20 ABSTRACT We present a multiwavelength morphological analysis of star-forming clouds and filaments in the central ( 50 kpc) regions of 16 low-redshift (z < 0.3) cool core brightest cluster galaxies. New Hubble Space Telescope imaging of far-ultraviolet continuum emission from young ( 10 Myr), massive ( 5 M⊙) stars reveals filamentary and clumpy morphologies, which we quantify by means of structural indices. The FUV data are compared with X-ray, Lyα, narrow- band Hα, broad-band optical/IR, and radio maps, providing a high spatial resolution atlas of star formation locales relative to the ambient hot (∼107–8 K) and warm ionized (∼104 K) gas phases, as well as the old stellar population and radio-bright active galactic nucleus (AGN) outflows. Nearly half of the sample possesses kpc-scale filaments that, in projection, extend towards and around radio lobes and/or X-ray cavities. These filaments may have been uplifted by the propagating jet or buoyant X-ray bubble, or may have formed in situ by cloud collapse at the interface of a radio lobe or rapid cooling in a cavity’s compressed shell. The morphological diversity of nearly the entire FUV sample is reproduced by recent hydrodynamical simulations in which the AGN powers a self-regulating rain of thermally unstable star-forming clouds that precipitate from the hot atmosphere. In this model, precipitation triggers where the cooling- to-free-fall time ratio is tcool/tff ∼ 10. This condition is roughly met at the maximal projected FUV radius for more than half of our sample, and clustering about this ratio is stronger for sources with higher star formation rates. Key words: galaxies: active – galaxies: clusters: general – galaxies: clusters: intracluster medium – galaxies: star formation. 1 INTRODUCTION Many giant elliptical, groups, and clusters of galaxies inhabit an X-ray bright halo of 107 K plasma whose core radiative lifetime is much shorter than its age. Absent a heating mechanism, simple models predict that the rapid cooling of gas within this ∼100 kpc ‘cool core’ (CC) should result in a long-lived cascade of multiphase clouds collapsing into the galaxy at its centre, fuelling extreme star formation rates (SFRs; 102 –103 M⊙ yr−1 ) amid massive reservoirs (∼1012 M⊙) of cold molecular gas (e.g. review by Fabian, John- ⋆E-mail: grant.tremblay@yale.edu † Einstein Fellow. ‡ Hubble Fellow. stone & Daines 1994b). Although brightest cluster galaxies (BCGs) embedded in CC clusters do preferentially harbour these supposed cooling flow mass sinks, the observed SFRs and cold gas masses are often orders of magnitude below predictions, and high-resolution X-ray spectroscopy of the intracluster medium (ICM; e.g. Sarazin 1986) is only consistent with reduced cooling at ∼10 per cent of the expected classical rates (e.g. review by Peterson & Fabian 2006). The mechanical dissipation of active galactic nucleus (AGN) power is now routinely invoked by theorists and observers as a solution to the problem, as the average associated energy budget for groups and clusters is large enough to inhibit or replenish cooling flow radiative losses not only at late epochs (e.g. Bˆırzan et al. 2004, 2008; Best et al. 2006, 2007; Dunn & Fabian 2006; Rafferty et al. 2006; Mittal et al. 2009; Dong, Rasmussen & Mulchaey 2010), but perhaps over a significant fraction of cosmic C⃝ 2015 The Authors Published by Oxford University Press on behalf of the Royal Astronomical Society atSpaceTelescopeScienceInstituteonJuly9,2015http://mnras.oxfordjournals.org/Downloadedfrom
  • 2. FUV morphology of cool core BCGs 3769 time (e.g. Hlavacek-Larrondo et al. 2012; Simpson et al. 2013; McDonald et al. 2013b). The paradigm is motivated by strong cir- cumstantial evidence, including nearly ubiquitous observations of radio-bright AGN outflows driving shocks and excavating kpc-scale buoyant cavities in the ambient X-ray gas, acting as lower limit calorimeters to the often extreme ( 1046 erg s−1 ) AGN kinetic energy input (e.g. reviews by McNamara & Nulsen 2007, 2012; Sun 2012). Yet amid panoramic supporting evidence (reviewed by Fabian 2012), the physics that governs the spatial distribution and thermal coupling of AGN mechanical energy to the multiphase (10–107 K) gaseous environment remains poorly understood, and cooling flow alternatives invoking (e.g.) wet mergers, thermal con- duction, and evaporation have been a persistent matter of debate (e.g. Bregman & David 1988; Sparks, Macchetto & Golombek 1989; Sparks 1992, 1997; Fabian, Canizares & Boehringer 1994a; Soker 2003; Voit et al. 2008; Sparks et al. 2009, 2012; Voit 2011; Smith et al. 2013; Canning et al. 2015; Voit & Donahue 2015). Although often invoked exclusively as a star formation quench- ing mechanism, observations have long demonstrated that AGN mechanical feedback does not completely offset radiative losses or establish an impermeable ‘entropy floor’, instead permitting resid- ual cooling either at constant low (∼10 per cent) rates (e.g. Trem- blay et al. 2012a,b), or in elevated episodes as the AGN varies in power (e.g. O’Dea et al. 2010; Tremblay 2011). Relative to field galaxies or those in non-CC clusters, BCGs in CCs prefer- entially harbour radio sources and kpc-scale filamentary forbidden and Balmer emission line nebulae amid 109 –1011 M⊙ repositories of vibrationally excited and cold molecular gas (Heckman 1981; Hu, Cowie & Wang 1985; Baum 1987; Heckman et al. 1989; Burns 1990; Jaffe & Bremer 1997; Donahue et al. 2000; Edge 2001; Edge & Frayer 2003; Salom´e & Combes 2003; McNamara, Wise & Murray 2004; Egami et al. 2006; Salom´e et al. 2006; Edwards et al. 2007; von der Linden et al. 2007; Wilman, Edge & Swinbank 2009; Edge et al. 2010a,b; Salom´e et al. 2011; McNamara et al. 2014; Russell et al. 2014). Low to moderate levels (∼1 to 10 M⊙ yr−1 ) of star formation appear to be ongoing amid these mysteriously dusty (O’Dea et al. 2008; Quillen et al. 2008; Edge et al. 2010a,b; Mittal et al. 2011; Rawle et al. 2012; Tremblay et al. 2012b), poly- cyclic aromatic hydrocarbon (PAH)-rich (Donahue et al. 2011) cold reservoirs on 50 kpc scales in clumpy and filamentary distribu- tions (e.g. Johnstone, Fabian & Nulsen 1987; McNamara et al. 2004; O’Dea et al. 2004, 2008, 2010; Rafferty et al. 2006; Rafferty, McNamara & Nulsen 2008; McDonald et al. 2011b; Tremblay et al. 2014). The ionization states of the nebulae have been a mystery for three decades, and debate continues over the roles played by stellar photoionization, shocks, thermal conduction, mixing, and cosmic ray heating (e.g. Voit & Donahue 1997; Ferland et al. 2009; Sparks et al. 2009, 2012; McDonald et al. 2010; O’Dea et al. 2010; Fabian et al. 2011b; McDonald, Veilleux & Rupke 2011a; Mittal et al. 2011; Oonk et al. 2011; Tremblay 2011; Johnstone et al. 2012). Whatever the case, there is strong evidence that young stars might play an important (although not exclusive) role in dictating the physics of both the warm (∼104 K) and cold (∼100 K) phases of the filaments (Voit & Donahue 1997; Canning et al. 2010, 2014; McDonald et al. 2010, 2011a; O’Dea et al. 2010). Recent work on star formation in CC BCGs has demonstrated its efficacy as an observable tracer for otherwise unobservable phys- ical processes regulating the heating and cooling balance in hot atmospheres. While low in general and effectively zero in some cases, the observed SFRs in CC BCGs are sometimes high enough ( 100 M⊙ yr−1 ) to match condensation rates from the X-ray halo (O’Dea et al. 2008). Emergent work at higher redshift has shown that the long-ago-predicted classical cooling flows may exist after all, forming stars at many hundreds of solar masses per year (i.e. the Phoenix cluster; McDonald et al. 2012, 2013a, 2014; see also work on Abell 1068 by McNamara, Wise & Murray 2004; Wise, McNa- mara & Murray 2004). Cooling flows may begin to form stars when the central entropy or cooling time drops below a critical threshold (e.g. Voit & Donahue 2005; Cavagnolo et al. 2008; Rafferty et al. 2008; Voit et al. 2008, 2015a; Guo & Mathews 2014), or when the ratio of cooling-to-dynamical times permits a self-regulating ‘rain’ of thermally unstable, spatially inhomogeneous clouds condensing from the hot atmosphere (Gaspari, Ruszkowski & Sharma 2012; McCourt et al. 2012; Sharma et al. 2012a; Li & Bryan 2014a,b; Brighenti, Mathews & Temi 2015; Li et al. 2015; Voit & Donahue 2015; Voit et al. 2015a). There is also some observational evi- dence for enhanced cooling in spatially confined ‘cooling channels’ where AGN heating may be locally inefficient (see e.g. evidence for enhanced cooling in regions perpendicular to the projected cav- ity/radio ‘heating axis’ in Perseus and Abell 2597; Lim, Ao & Dinh-V-Trung 2008; Tremblay et al. 2012b). Direct observations of young stars in BCGs can test predictions of these various models. To that end, this paper presents a morpho- logical analysis of new and archival Hubble Space Telescope (HST) far-ultraviolet (FUV) continuum images of young, massive stars in 16 low-redshift (z < 0.29) CC BCGs. X-ray, Lyα, Hα, broad- band optical, and radio data are also leveraged to create an ‘atlas’ of star formation locales relative to the ambient hot ( 107 K) and warm ionized (∼104 K) gas phases, as well as the old stellar popu- lation and radio-bright AGN outflows. In Section 2, we discuss the sample selection, observations, and data reduction. Our results are presented in Section 3, discussed in Section 4, and summarized in Section 5. An appendix contains additional multiwavelength over- lay figures (see Figs A1–A16) for all sources in our sample. We will frequently abbreviate target names in an obvious manner (i.e. Abell 2597 is written as A2597, etc.). Unless otherwise noted, we use the names of the parent clusters to refer to their central BCGs (i.e. ‘Perseus’ refers to its BCG, NGC 1275). Cosmology-dependent physical quantities quoted in this paper assume a flat cold dark matter model wherein H0 = 70 km s−1 Mpc−1 , M = 0.3, and = 0.7. Errors are quoted at the 1σ level, unless otherwise noted. 2 SAMPLE, OBSERVATIONS, AND DATA REDUCTION 2.1 Sample selection The 16 low-redshift (z < 0.3) CC BCGs that make up our sample are listed in Table 1. All are well studied in the literature, and enjoy nearly complete cross-spectrum (radio through X-ray) data coverage from many ground- and space-based facilities, including the Chandra X-ray Observatory, HST, Spitzer Space Telescope, and Herschel Space Observatory. Eleven of these targets constitute the Herschel CC clusters Open Time Key Project sample of A. Edge and collaborators (Edge et al. 2010a,b; Mittal et al. 2011, 2012; Rawle et al. 2012; Tremblay et al. 2012a,b; Hamer et al. 2014), selected to span a wide range of both cooling flow and BCG physical properties. The remaining five targets are from the non-overlapping sample of O’Dea et al. (2010), selected from the Quillen et al. (2008) sample on the basis of elevated infrared-estimated SFRs. Although biased, our sample spans decade-wide ranges of X-ray mass deposition and SFRs, Balmer and forbidden line luminosi- ties, as well as AGN, radio source, and X-ray cavity power (in- cluding sources that lack detected cavities). Its constituent galaxies MNRAS 451, 3768–3800 (2015) atSpaceTelescopeScienceInstituteonJuly9,2015http://mnras.oxfordjournals.org/Downloadedfrom
  • 3. 3770 G. R. Tremblay et al. Table 1. Basic information on the 16 low-redshift cool core brightest cluster galaxies that make up our sample. (1) Source name (note that while we list the most commonly used name for the cluster, the actual target studied in this paper is the central brightest cluster galaxy of the named cluster); (2) non-exhaustive list of other commonly used names for the cluster, central brightest cluster galaxy, or central radio source; (3) right ascension and (4) declination for the J2000.0 epoch; (5) redshift (z) as listed in the NASA/IPAC Extragalactic data base (NED); (6) the number of kiloparsecs (kpc) that correspond to 1 arcsec at the given redshift in our assumed cosmology (H0 = 70 km s−1 Mpc−1); (7) the associated figure number(s) where the multiwavelength data for the listed BCG can be viewed. The FUV continuum images for the entire sample can be viewed at a glance in Fig. 1. RA Dec. Redshift Shown in Source name Associated name(s) (J2000) (J2000) (z) kpc arcsec−1 Figure # (1) (2) (3) (4) (5) (6) (7) Abell 11 – 00h12m44.s8 −16◦26′19′′ 0.1660 2.81 1, 2, A1 Abell 1068 ZwCl 1037.6+4013 10h40m47.s1 +39◦57′19′′ 0.1375 2.40 1, 7, A2 Abell 1664 RX J1303.7−2414 13h03m41.s8 −24◦13′06′′ 0.1283 2.27 1, 2, 8, A3 Abell 1795 ZwCl 1346.9+2655 13h49m00.s5 +26◦35′07′′ 0.0625 1.19 1, 3, 10, A4 Abell 1835 ZwCl 1358.5+0305 14h01m02.s0 +02◦51′32′′ 0.2532 3.91 1, 2, 7, 11, A5 Abell 2199 NGC 6166, 3C 338 16h28m38.s5 +39◦33′06′′ 0.0302 0.60 1, 9, A6 Abell 2597 PKS 2322−122 23h25m18.s0 −12◦06′30′′ 0.0821 1.53 1, 3, 8, 2, 10, 11, A7 Centaurus NGC 4696, Abell 3526, PKS 1245-41 12h48m49.s2 +41◦18′39′′ 0.0099 0.20 1, 9, 11, A8 Hydra A Abell 780, 3C 218 09h18m05.s7 −12◦05′44′′ 0.0549 1.05 1, 3, 8, 10, 11, 12, A9 Perseus NGC 1275, Abell 426, 3C 84 03h19m48.s1 +41◦30′42′′ 0.0176 0.35 1, 3, 11, A10 PKS 0745−191 – 07h47m31.s3 −19◦17′40′′ 0.1028 1.89 1, 11, A11 RX J1504.1−0248 – 15h04m07.s5 −02◦48′16′′ 0.2153 3.46 1, 7, A12 RX J2129.6+0005 – 21h29m37.s9 +00◦05′39′′ 0.2350 3.70 1, 2, A13 ZwCl 0348 ZwCl 0104.4+0048 01h06m58.s0 +01◦04′01′′ 0.2545 3.93 1, 2, A14 ZwCl 3146 ZwCl 1021.0+0426 10h23m39.s6 +04◦11′10′′ 0.2906 4.32 1, 2, A15 ZwCl 8193 ZwCl 1715.5+4229 17h17m19.s0 +42◦26′57′′ 0.1829 3.04 1, 2, A16 therefore occupy unique milestones in the supposed ICM cooling and AGN heating feedback cycle over the last ∼3 Gyr of cosmic history (redshifts 0.0099 ≤ z ≤ 0.2906), including sources with high and low SFRs, strong and weak AGN feedback signatures, as well as many intermediate locales between these extremes. A non-exhaustive summary of these various properties can be found in Table 2. 2.2 New observations Along with more than 50 multiwavelength archival observations, this paper presents five new FUV continuum and two new broad- band optical HST observations, all of which are summarized in Table 3. Although much of these data have been rereduced in a homogeneous way for this analysis (see Section 2.3), we refer the reader to the references listed in the rightmost column of Table 3 for more observational details pertaining to the archival data. The new HST FUV and optical images we present were obtained in Cycle 19 as part of General Observer program 12220 (PI: R. Mittal). The line-free FUV continuum data were obtained with the Solar Blind Channel (SBC) Multi-Anode Microchannel Array (MAMA) detector of the Advanced Camera for Surveys (ACS; Clampin et al. 2004). Total exposure times for each target were roughly ∼2700 s (roughly one HST orbit minus overheads), and the observations were carried out with a standard three-point dither pattern. Depending on target redshift, we used the F140LP, F150LP, and F165LP long-pass filters with pivot wavelengths of 1527, 1611, and 1758 Å, respectively. These filter choices ensured that Lyα emission did not fall within their bandpasses, which have similar red cutoff wavelengths of ∼2000 Å, but different blue cutoff (or minimum) wavelengths of 1370, 1470, and 1650 Å, respectively. The plate scale for the SBC is 0.034 × 0.030 arcsec2 pixel−1 , and the detector field of view is 346 × 308 arcsec2 . Although we will not discuss the archival FUV observations for all other sources, we note that the observing strategy employed for those data sets was very similar (if not identical) to that used for our new FUV observations. To fill a data coverage gap, we also obtained two new line-free optical images of Hydra A and RX J1504.1−0248 (hereafter R1504) using the UVIS channel of HST’s Wide Field Camera 3 (WFC3; Dressel 2012). As for the FUV images, a three-point dither pattern was used over a ∼2500 s total exposure time for each target. The F814W and F689M filters with pivot wavelengths of 8024 and 6876 Å were used for Hydra A and R1504, respectively. The widths of these passbands (1536 and 683 Å) forbid optical line contamination (though note that some archival optical images we use for other sources do contain optical line emission like Hα+[N II]). More details on these new HST observations can be found in Mittal, Whelan & Combes (2015). 2.3 Data reduction All new or archival HST FUV and optical data used in this anal- ysis were retrieved from either the Mikulski Archive for Space Telescopes (MAST1 ) or the Hubble Legacy Archive2 , and MAST products were reduced using the standard on-the-fly recalibration pipelines. Chandra X-ray observations were obtained as level one products from the Chandra Data Archive.3 Exposures were re- duced, reprojected, exposure-corrected, and merged using the stan- dard CIAO (Fruscione et al. 2006) v4.5 scripts (chandra_repro, reproject_obs, flux_obs) with v4.5.5.1 of the calibration data base. Finally, while many high-resolution Very Large Array (VLA) radio maps were kindly provided by colleagues, some raw data sets (for A1068, RX J1504, and PKS 0745) had to be obtained from the National Radio Astronomy Observatory (NRAO) Archive.4 The NRAO AIPS 5 package was used for (self-)calibration, imaging, and deconvolution of these data. 1 http://archive.stsci.edu/ 2 http://hla.stsci.edu/ 3 http://asc.harvard.edu/cda/ 4 https://archive.nrao.edu/ 5 http://www.aips.nrao.edu/ MNRAS 451, 3768–3800 (2015) atSpaceTelescopeScienceInstituteonJuly9,2015http://mnras.oxfordjournals.org/Downloadedfrom
  • 4. FUV morphology of cool core BCGs 3771 Table 2. A summary of physical properties of the BCGs in our sample, including their surrounding ∼100 kpc-scale environment. References for the quantities presented here can be found below this table. (1) Target name; (2) infrared-estimated star formation rate (SFR), typically from Spitzer or Herschel. SFRs flagged with a † symbol may suffer from a non-negligible Type II AGN contribution to the IR luminosity, in which case the IR-estimated SFR may be somewhat overestimated. Note that SFR estimates vary greatly depending on the method, model, and waveband used. We demonstrate this in column (3), which shows an average of all published SFRs for each source (see Mittal et al. 2015 for the specific values used in these averages); (4) lowest and highest X-ray mass deposition rates that have been published for the listed source. Most of these come from Chandra upper limits, rather than more reliable XMM–Newton Reflection Grating Spectrometer data; (5) cold molecular hydrogen gas mass in units of × 109 M⊙; (6) central ICM entropy in units of keV cm2; (7) 1.4 GHz radio luminosity, based on NVSS or Parkes L-band flux densities; (8) jet mechanical power roughly estimated from (7) using the scaling relation of Cavagnolo et al. (2010); (9) X-ray cavity power estimated from Chandra observations. ICM cooling proxies AGN heating proxies SFR (IR est.) Published SFRs ˙Mcool MH2 K0 P1.4GHz ∼Pjet (C10 scaling) Pcavity (X-ray) Source name (M⊙ yr−1 ) (M⊙ yr−1 ) (M⊙ yr−1 ) (× 109 M⊙) (keV cm2 ) (× 1040 erg s−1 ) (× 1044 erg s−1 ) (× 1044 erg s−1 ) (1) (2) (3) (4) (5) (6) (7) (8) (9) Abell 11 35(a) 35 – 1.1 – 9.57 ± 0.23 4.42 – Abell 1068 188(a)† 80 ± 60 40–150 43 72 1.34 ± 0.03 1.01 – Abell 1664 15(a) 16 ± 7 – 23 14.4 2.13 ± 0.06 1.43 0.7 ± 0.3 Abell 1795 8(b) 8 ± 8 1–21 6 19 11.73 ± 0.32 5.15 16.0+2.3 −0.5 Abell 1835 138(c) 119 ± 83 – 90 11.4 7.85 ± 0.16 3.81 18.0+19.0 −6.0 Abell 2199 0.6(b) 0.2 ± 0.1 0–3 1.4 13.3 10.45 ± 0.33 4.72 2.7+2.5 −0.6 Abell 2597 5(d) 5 ± 8 20–40 1.8 10.6 42.04 ± 1.11 13.42 1.9+1.0 −0.8 Centaurus 0.2(b) 0.2 ± 0.1 2.6–2.9 <1 2.25 1.16 ± 0.03‡ 0.91 0.08+5.8 −1.8 Hydra A 4(b) 8 ± 7 11–21 3.2 13.3 395.46 ± 11.37 72.08 6.5 ± 0.5 Perseus 24(e) 30 ± 23 12–29 8.5 19.4 21.54 ± 0.63 8.13 1.5+1.0 −0.3 PKS 0745−191 17(a) 70 ± 94 80–260 4.5 12.4 85.53 ± 2.58 22.86 17.0+14.0 −3.0 RX J1504.1−0248 140(f) 237 ± 92 – 10 13.1 11.05 ± 0.34 4.93 – RX J2129.6+0005 13(a) 9 ± 5 – – 21 5.70 ± 0.19 3.00 – ZwCl 0348 52(a) 52 – – – 0.44 ± 0.01 0.44 – ZwCl 3146 67(b) 67 ± 59 420–780 80 11.4 2.60 ± 0.12 1.66 58.0+68.0 −15.0 ZwCl 8193 59(a) 59 – – – 16.75 ± 0.38 6.73 – References: – (1) IR-estimated SFRs are adopted from: (a) O’Dea et al. (2008); (b) Hoffer et al. (2012); (c) McNamara et al. (2006); (d) Donahue et al. (2007); (e) Mittal et al. (2012); and (f) Ogrean et al. (2010); (3) Mittal et al. (2015); (4 and 9) X-ray mass deposition rates and cavity powers are collected from Bˆırzan et al. (2004); Dunn & Fabian (2006); Rafferty et al. (2006); Wise et al. (2007); Tremblay et al. (2012b); Kirkpatrick et al. (2009). (5) Cold molecular gas masses are adopted from Edge (2001); Edge & Frayer (2003); Salom´e & Combes (2003); Tremblay et al. (2012b). (6) Central ICM entropy K0 is adopted from the main table of the ACCEPT sample, see, e.g. Cavagnolo et al. (2009); (7) K-corrected 1.4 GHz luminosities are based on flux densities from NVSS (Condon et al. 1998), except in the case of Centaurus, which uses the 1.4 GHz flux density from the Parkes Radio Telescope. The flux-to-luminosity conversion is given in Section 2.3; (8) Cavagnolo et al. (2010). This paper also presents some data sets that have not been rere- duced for this analysis. Data reduction and continuum-subtraction details for the HST ACS/SBC Lyα images shown in Fig. 2 can be found in O’Dea et al. (2010). Reduction of the Maryland-Magellan Tunable Filter (MMTF) narrow-band Hα maps shown in Fig. 3 is described in McDonald et al. (2010). The 1.4 Ms Chandra X-ray map of Perseus (shown in Fig. A10) is discussed at length in Fabian et al. (2011a). L-band radio luminosities quoted in Table 2 use flux densities from the NRAO VLA Sky Survey (NVSS; Condon et al. 1998) assuming the relation P1.4 GHz = 4πD2 LSν0 ν0 (1 + z)α−1 , where DL is the luminosity distance to the source, Sν0 is the 1.4 GHz radio flux density integrated over the source area, ν0 = 1.4 GHz is the frequency of the observation, and α is the radio spectral index used in the (negligible) K-correction, assumed here to be α = 0.8 if Sν ∝ ν−α (these luminosities are insensitive to choice of α given the narrow and low-redshift range of our targets). All images were spatially aligned using IRAF shifting and regis- tration tasks. To aid viewing of certain X-ray or optical morpho- logical features, in many cases we show unsharp masks wherein the ‘smooth’ X-ray or optical light has been subtracted from the surface brightness map, highlighting residual edge structures. X-ray unsharp masks were made in the CIAO environment by Gaus- sian smoothing exposure-corrected maps with both small and large kernel sizes. The heavily smoothed map was then subtracted from the lightly smoothed map, and the residual image was normalized by the sum of both smoothed maps. Unsharp masks of the FUV and optical HST data were made using essentially the same technique in the IRAF environment. 2.4 The SBC red leak and other contaminants The ACS SBC suffers from a poorly characterized and highly vari- able red leak (e.g. Ubeda et al. 2012), wherein the FUV long-pass fil- ters can permit a substantial amount of ‘red’ (i.e. optical) interloper flux through the bandpass, contaminating what should otherwise be a pure FUV image. The effect is extremely difficult to correct for in the absence of multiband UV imaging, as it depends on both time and detector temperature, varying by as much as 30 per cent across five consecutive orbits. There is some evidence that the effect has decreased since 2008, and current estimates suggest that, at worst, it may artificially boost the FUV count rate by about 10–20 per cent (STScI ACS team, private communication). While one must therefore be wary when interpreting SBC FUV images of otherwise red, luminous elliptical galaxies, solace is found in the fact that the contributors of red-leak photons are al- most exclusively solar- and later type stars. This means that the effect can only significantly contaminate by means of a smooth, diffuse, and very faint background whose surface brightness tracks the underlying optical isophotes of the host galaxy’s old stellar com- ponent. We are therefore able to circumvent the issue in this paper MNRAS 451, 3768–3800 (2015) atSpaceTelescopeScienceInstituteonJuly9,2015http://mnras.oxfordjournals.org/Downloadedfrom
  • 5. 3772 G. R. Tremblay et al. Table 3. A summary of the new and archival observations used in this analysis. Those targets for which new FUV continuum or optical data are presented are highlighted in boldface. Where applicable, a reference is given to the earliest publication in which the data were first directly analysed. Source name λ regime Facility Inst./mode Exp. time/rms noise Obs./prog. ID Reference/comment Abell 11 FUV cont. HST ACS/SBC F150LP 1170 s 11230 O’Dea et al. (2010) Lyα HST ACS/SBC F125LP 1170 s 11230 O’Dea et al. (2010) Optical HST WFPC2 F606W 800 s 8719 O’Dea et al. (2010) X-ray ROSAT – – – All Sky Survey 8.46+1.46 GHz radio VLA A, B array 74 µJy AB0878, AL0578 O’Dea et al. (2010) Abell 1068 FUV cont. HST ACS/SBC F150LP 2766 s 12220 New; Mittal et al. (2015) Optical HST WFPC2 F606W 600 s 8301 – X-ray Chandra ACIS-S 26.8 ks 1652 McNamara et al. (2004); Wise et al. (2004) 8.46 GHz radio VLA A array – AE0117 – Abell 1664 FUV cont. HST ACS/SBC F150LP 1170 s 11230 O’Dea et al. (2010) Lyα HST ACS/SBC F125LP 1170 s 11230 O’Dea et al. (2010) Optical HST WFPC2 F606W 1800 s 11230 O’Dea et al. (2010) X-ray Chandra ACIS-S 36.6 ks 7901 Kirkpatrick et al. (2009) 4.86 GHz radio VLA C array 100 µJy AE0099 O’Dea et al. (2010) Abell 1795 FUV cont. HST ACS/SBC F140LP 2394 s 11980 – Optical HST WFPC2 F555W 1600 s 5212 – Hα narrow band Baade 6.5m IMACS/MMTF 1200 s – McDonald & Veilleux (2009) X-ray Chandra ACIS-S 30 ks 10900 etc. – 8.4 GHz radio VLA A, C, A/D arrays 18 hr AG0273 Ge & Owen (1993) Abell 1835 FUV cont. HST ACS/SBC F165LP 1170 s 11230 O’Dea et al. (2010) Lyα HST ACS/SBC F140LP 1170 s 11230 O’Dea et al. (2010) Optical HST WFPC2 F702W 7500 s 8249 – X-ray Chandra ACIS-I 117.9 ks 6880 – – – – 36.3 ks 6881 – – – – 39.5 ks 7370 – 4.76 GHz radio VLA A, C arrays 2 hr/47 µJy AT0211 Govoni et al. (2009) Abell 2199 FUV cont. HST ACS/SBC F140LP 2767 s 12220 New; Mittal et al. (2015) Optical HST WFPC2 F555W 5200 s 7265 – X-ray Chandra ACIS-I 120 ks 10748 etc. Nulsen et al. (2013) 5 GHz radio VLA B, C, D arrays 6 hr AG0269 Ge & Owen (1994) Abell 2597 FUV cont. HST ACS/SBC F150LP 8141 s 11131 Oonk et al. (2010); Tremblay et al. (2012b) Lyα HST STIS F25SRF2 1000 s 8107 O’Dea et al. (2004); Tremblay et al. (2012b) Optical and Hα HST WFPC2 F702W 2100 s 6228 Holtzman et al. (1996) Hα narrow band Baade 6.5 m IMACS/MMTF 1200 s – McDonald et al. (2011a,b) X-ray Chandra ACIS-S 39.8 ks 922 McNamara et al. (2001); Tremblay et al. (2012a,b) – – – 112 ks 6934, 7329 Tremblay et al. (2012a,b) 8.4 GHz radio VLA A array 15 min AR279 Sarazin et al. (1995) 330 MHz radio VLA A array 3 hr AC674 Clarke et al. (2005) Centaurus FUV cont. HST ACS/SBC F150LP 1780 s 11681 Mittal et al. (2011) Optical HST ACS/WFC F814W 8060 s 9427 Harris et al. (2006) – – ACS/WFC F435W 8654 s 9427 Harris et al. (2006) – – WFC3 F160W 392 s 11219 Baldi et al. (2010) X-ray Chandra ACIS-S 200 ks 504,5310,4954,4955 Fabian et al. (2005) 1.46 GHz radio VLA A, B/A 1.5 hr AT211 Taylor, Fabian & Allen (2002) Hydra A FUV cont. HST ACS/SBC F140LP 2709 s 12220 New; Mittal et al. (2015) Optical HST ACS/WFC F814W 2367 s 12220 New; Mittal et al. (2015) Hα narrow band Baade 6.5m IMACS/MMTF 1200 s – McDonald et al. (2010, 2011b) X-ray Chandra ACIS-S 196 ks 4969, 4970 Nulsen et al. (2005) 4.6 GHz radio VLA A, A/B, B, C, D 9 hr AL0032 Taylor et al. (1990) Perseus FUV cont. HST ACS/SBC F140LP 2552 s 11207 Fabian et al. (2008) – – STIS F25SRF2 1000 s 8107 Baum et al. (2005) Optical and Hα HST ACS/WFC F625W 4962 s 10546 Fabian et al. (2008) Hα narrow band KPNO WIYN 3.5m S2kB CCD/KP1495 3200 s Conselice, Gallagher & Wyse (2001) X-ray Chandra ACIS-S and −I 1.4 Ms 11713 etc. Fabian et al. (2011a) 1.4 GHz radio VLA C, D, C/D arrays 3 min AT149A Condon et al. (1996) PKS 0745-191 FUV cont. HST ACS/SBC F140LP 2715 s 12220 New; Mittal et al. (2015) Optical HST WFPC2 F814W 1200 s 7337 Sand et al. (2005) X-ray Chandra ACIS-S 50 ks 508,2427 Fabian (1999) 8.4 GHz radio VLA A array 2 hr BT024 Taylor, Barton & Ge (1994) MNRAS 451, 3768–3800 (2015) atSpaceTelescopeScienceInstituteonJuly9,2015http://mnras.oxfordjournals.org/Downloadedfrom
  • 6. FUV morphology of cool core BCGs 3773 Table 3 – continued Source name λ regime Facility Inst./mode Exp. time/rms noise Obs./prog. ID Reference/comment RX J1504.1-0248 FUV cont. HST ACS/SBC F165LP 2700 s 12220 New; Mittal et al. (2015) Optical HST WFC3/UVIS F689M 2637 s 12220 New; Mittal et al. (2015) X-ray Chandra ACIS-I 40 ks 5793 B¨ohringer et al. (2005); Ogrean et al. (2010) 8.46 GHz radio VLA A array 3 hr AB1161 – RX J2129.6+0005 FUV cont. HST ACS/SBC F165LP 1170 s 11230 O’Dea et al. (2010) Lyα HST ACS/SBC F140LP 1170 s 11230 O’Dea et al. (2010) Optical HST WFPC2 F606W 1000 sec 8301 Donahue et al. (2007) X-ray Chandra ACIS-I 30 ks 9370 – 8.46 GHz radio VLA A array 50 µJy AE117 O’Dea et al. (2010) ZwCl 0348 FUV cont. HST ACS/SBC F165LP 1170 sec 11230 O’Dea et al. (2010) Lyα HST ACS/SBC F140LP 1170 sec 11230 O’Dea et al. (2010) Optical HST WFPC2 F606W 700 sec 11312 Smith et al. (2010) X-ray Chandra ACIS-S 50 ksec 10465 – 4.86 GHz radio VLA A/B array 66 µJy AK359 O’Dea et al. (2010) ZwCl 3146 FUV cont. HST ACS/SBC F165LP 1170 sec 11230 O’Dea et al. (2010) Lyα HST ACS/SBC F140LP 1170 sec 11230 O’Dea et al. (2010) Optical HST WFPC2 F606W 1000 sec 8301 Donahue et al. (2007) X-ray Chandra ACIS-I 90 ksec 909,9371 Boschin (2002) 4.86 GHz radio VLA A/B array 50 µJy ACTST O’Dea et al. (2010) ZwCl 8193 FUV cont. HST ACS/SBC F150LP 1170 sec 11230 O’Dea et al. (2010) Lyα HST ACS/SBC F140LP 1170 sec 11230 O’Dea et al. (2010) Optical HST WFPC2 F606W 1900 sec 11230 O’Dea et al. (2010) X-ray ROSAT – – – All Sky Survey 8.46 GHz radio VLA A array 180 µJy AE117 O’Dea et al. (2010) by quantitatively and qualitatively interpreting only high surface brightness, spatially anisotropic FUV-bright clumps and filaments, to which the red leak cannot significantly contribute beyond a slight increase in count rate that is effectively uniform across such struc- tures. The same argument applies for highly variable contamination from the old stellar ‘UV upturn’ population (see e.g. O’Connell 1999, for a review). One can therefore be confident that the clumpy and filamentary kpc-scale emission ubiquitously seen in our images (see Fig. 1) is almost entirely due to young ( 10 Myr), massive ( 5 M⊙) stars. We nevertheless caution against overinterpretation of the smooth, diffuse emission seen in a few of our images (Abell 2199, for example6 ), and stress that no quantitative plots or scien- tific conclusions presented in this paper are based in any way on this diffuse emission. 3 RESULTS The FUV continuum images for our full sample are presented in Fig. 1. The scales over which FUV emission is detected vary from 500 pc (Centaurus) to 67 kpc (A1795). Mean and median largest angular sizes are 30 and 33 kpc, respectively. Estimated SFRs range 6 Abell 2199 and Centaurus are the only two sources in our sample for which the SBC red leak may make a dominant contribution to observed morphology. As a test, we have scaled the V-band optical image of A2199 by a factor consistent with the known range of reasonable FUV/optical colours (discussed at length in e.g. Oonk et al. 2011), then subtracted this scaled image from the FUV map. We are unable to rule out the possibility that all emission seen in the A2199 ‘FUV’ image is a combination of red leak from the underlying old stellar component, plus a central FUV point source associated with the AGN. The SFR in this source may therefore be effectively zero. The same is true for Centaurus, however all other sources in our sample are dominated by bright FUV clumps and filaments whose morphology will be unaffected by the red leak. from effectively zero or ≪0.1 M⊙ yr−1 (Centaurus, RX J2129, A2199) to ∼150 M⊙ yr−1 (A1068, A1835, RX J1504). These and other properties such as cold molecular gas mass, X-ray estimated mass deposition rates, radio source power, and X-ray cavity power are summarized for all targets in Table 2. The FUV morphological analyses in the sections below come with an important caveat: FUV emission is highly sensitive to extinction by dust. The FUV emission that we do detect likely stems only from the outermost layers of dense, dusty star-forming clouds, which are themselves obscured by intervening dust along the line of sight. As the FUV is particularly sensitive to young stars less than ∼10 Myr old and more massive than ∼5 M⊙, our images should be considered instantaneous ‘snapshots’ of ongoing or very recent unobscured star formation. A detailed treatment of extinction for a majority subset of our sample is provided by Mittal et al. (2015), and will not be discussed here beyond cautioning against overinterpretation of observed FUV structures. The clumps and filaments we do detect are likely ‘tips of icebergs’, and smooth, diffuse emission may be significantly con- taminated by red leak and the UV upturn population (as discussed in Section 2.4). It is nevertheless obvious from Fig. 1 that star formation in our sample is not occurring amid monolithic slabs of gas. The ob- served FUV morphologies are instead highly clumpy and filamen- tary, exhibiting a variety of associations (and sometimes interesting non-associations) with X-ray, optical, and radio features, as well as galaxy properties such as central X-ray entropy and the rela- tive strength of AGN feedback signatures. These associations are discussed in the following sections. 3.1 Comparison of FUV, Lyα, and Hα morphology In Fig. 2, we compare a subset of our targets with the continuum- subtracted Lyα data of O’Dea et al. (2010). Although the MNRAS 451, 3768–3800 (2015) atSpaceTelescopeScienceInstituteonJuly9,2015http://mnras.oxfordjournals.org/Downloadedfrom
  • 7. 3774 G. R. Tremblay et al. Figure 1. HST/ACS SBC images of FUV continuum emission associated with young, massive stars in the central ∼50 kpc of the 16 low-redshift CC BCGs in our sample. It is immediately obvious that the star formation in these systems does not occur in monolithic slabs of gas, but rather in highly complex filamentary and clumpy distributions. These images are discussed in general in Section 3. The five sources for which we are showing newly obtained FUV data are marked with an asterisk. All panels are rotated such that east is left and north is up. This paper presents multiwavelength data for each of these sources, which can be seen by referring to the figures listed in column (7) of Table 1. morphologies are very similar overall, the Lyα is far more extended than the underlying FUV continuum. In a simple photon-counting exercise using the same FUV data for a subset of our sample, O’Dea et al. (2010) demonstrated that the young stellar component traced by the FUV continuum can roughly account for the photon budget required to photoionize the Lyα nebula, although there is unavoid- ably significant uncertainty in the extinction correction used in this analysis. That the Lyα is far more extended than the FUV continuum may be due to a simple sensitivity issue. Lyα is far brighter than the local FUV continuum, as the average Lyα/FUV flux density ratio for our sample is roughly ∼3. There are several examples in our sample where outer Lyα filaments are detected in a region where this Lyα/FUV ratio would result in an FUV continuum flux that is below the sensitivity limit of the observation (the outer Lyα filaments in Abell 11 are one example). We are therefore unable to rule out the possibility that all Lyα emission is cospatial with underlying FUV continuum from young stars. Alternatively, it is still possible that the Lyα is intrinsically more extended than the FUV continuum. This would be similarly unsurprising and consistent with many previous MNRAS 451, 3768–3800 (2015) atSpaceTelescopeScienceInstituteonJuly9,2015http://mnras.oxfordjournals.org/Downloadedfrom
  • 8. FUV morphology of cool core BCGs 3775 Figure 2. A comparison of Lyα and FUV continuum morphologies for a subset of our sample. In blue, we show the HST/ACS SBC continuum-subtracted Lyα images from O’Dea et al. (2010), and in orange we show the FUV continuum images. While the general morphologies are very similar, the Lyα emission is far more extended than the underlying FUV continuum. This result is unsurprising given the sensitivity of Lyα emission to resonant scattering. O’Dea et al. (2010) demonstrated that the underlying FUV continuum strength was sufficient to fully account for production of the observed Lyα emission via stellar photoionization. All image pairs are aligned and shown on a common spatial scale, with east left and north up. observations, as this is attributable to Lyα’s very high sensitivity to resonant scattering (e.g. Laursen & Sommer-Larsen 2007). This can make Lyα morphology difficult to interpret in a physical sense, though it does serve as an excellent (although ‘tip-of-the-iceberg’) tracer for neutral hydrogen. We leverage these Lyα data for this purpose in many of the multiwavelength comparison figures listed in column (7) of Table 1. In Fig. 3, we compare a subset of our FUV sample with the narrow-band Hα maps from McDonald & Veilleux (2009), McDonald et al. (2010), McDonald et al. (2011a,b), and Conselice et al. (2001). We have smoothed the FUV maps with a Gaussian in order to degrade their spatial resolution to (roughly) match that of the Hα images. Although the FUV and Hα morphologies closely match one another (see also e.g. McDonald et al. 2011a), the match MNRAS 451, 3768–3800 (2015) atSpaceTelescopeScienceInstituteonJuly9,2015http://mnras.oxfordjournals.org/Downloadedfrom
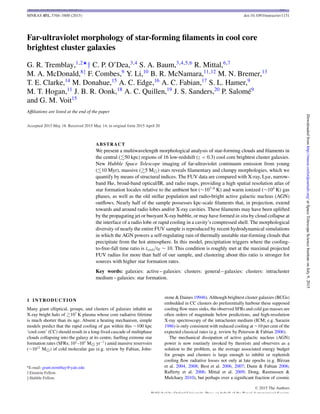
  • 9. 3776 G. R. Tremblay et al. Figure 3. A comparison of Hα and FUV continuum morphologies for a subset of our sample. In blue, we show the narrow-band Hα images from McDonald et al. (2010, 2011a,b); Conselice et al. (2001), and in orange we show the FUV continuum images after Gaussian smoothing to (approximately) match the spatial resolution of the Hα maps. All image pairs are aligned and shown on a common spatial scale, with east left and north up. The morphologies are very similar overall, though it is important to note that some Hα filaments lack detected cospatial FUV continuum, and some FUV filaments lack detected cospatial Hα emission (though non- detection of course does not necessarily imply absence). Many works have demonstrated that continuum emission from young stars can account for a dominant fraction of the ionizing photons needed to power the Hα nebula (e.g. O’Dea et al. 2010; McDonald et al. 2011a). However, an additional ionization mechanism (e.g. shocks, cosmic rays, thermal conduction, etc.) is needed in all cases (see Section 1). is not nearly one to one. It has been known for many years that some of the Hα filaments in CC BCGs are devoid of a detectable FUV counterpart, with Perseus7 being the most obvious example (e.g. Hatch et al. 2006; Canning et al. 2010). Moreover, some blue star-forming filaments apparently lack cospatial Hα emission (e.g. the ‘blue loop’ in Perseus; Fabian et al. 2008; Canning et al. 2010, 2014). Hα traces the contemporary SFR via the instantaneous flux of ionizing photons from the most massive (M⋆ 15 M⊙) O and early B-type stars, while the more heavily extincted UV excess as- sociated with the photospheres of less massive (M⋆ 5 M⊙) young stars can shine long after those most massive stars powering the Hα flux are gone. Hα and the FUV therefore sample smaller and larger temporal slices (∼106–7 versus ∼108 yr) of the star formation history, respectively. More importantly, many authors have demon- strated that the Hα nebulae cannot be heated by star formation alone (see Section 1, although this issue is not the focus of our paper). The slight morphological mismatch between Hα and FUV is therefore not necessarily surprising. Fig. 3 only demonstrates that the FUV and Hα filaments are roughly cospatial in projection, with clear important exceptions. While some authors have shown that stars can indeed play a very important role in the ionization states of the filaments (e.g. O’Dea et al. 2010; McDonald et al. 2011b), we reiterate that another heat source (acting either alone or in concert with the young stars) is needed (e.g. Voit & Donahue 1997; Ferland et al. 2009; Fabian et al. 2011a; Oonk et al. 2011; Johnstone et al. 2012; Mittal et al. 2012; Canning et al. 2015). 3.2 Galaxy-scale position angle alignment of FUV with X-ray, optical, and IR major axes In Fig. 4, we plot the position angle (PA measured N through E) of the projected X-ray, optical, IR (3.6 µm), and radio major axis versus the projected FUV major axis. The FUV major axis was taken to be the PA of the isophote at roughly twice the FUV half- light radius in lightly smoothed maps. We then measured the X-ray, optical, and IR major axis within the isophote at roughly the same radius. Sources that are point like or circular in any of these bands have been excluded from that particular plot. As is evident in Fig. 4, we observe weak-to-strong projected alignment between FUV, X-ray, optical, and IR counterparts. Those sources that are outliers to any of these trends have been labelled in the respective plot. It is possible that the alignment is a reflection of the old and young stellar components sharing a common origin in the ambient hot gas. Another possibility is that the alignment is merely due to the fact that the various components all reside within the same gravitational potential, and have had sufficient time to dynamically relax, torque towards a common axis, etc. We caution against overinterpretation of these apparent projected alignments: these are chaotic, messy systems with morphologies that probably vary strongly with time. 3.3 Kiloparsec-scale offsets between FUV and X-ray surface brightness peaks While FUV and X-ray surface brightness peaks are spatially coin- cident for the majority of our sample, A1664, A1835, Centaurus, 7 One must be wary of confusing star-forming filaments in Perseus with FUV and blue excess emission from the foreground High Velocity System that is superimposed along the line of sight. This disrupted galaxy is ∼100 kpc closer in projection and is unrelated to the BCG; see e.g. Sanders & Fabian (2007). MNRAS 451, 3768–3800 (2015) atSpaceTelescopeScienceInstituteonJuly9,2015http://mnras.oxfordjournals.org/Downloadedfrom
  • 10. FUV morphology of cool core BCGs 3777 Figure 4. A comparison of projected position angles (PAs) for the FUV, X-ray, optical, IR, and radio isophotal major axes at matching spatial scales. PA has been measured N through E. If the PA of the X-ray, optical, or IR major axis was found to vary strongly as a function of radius, we measured the PA of the major axis that matched the largest angular size of the FUV emission. Strong alignment between FUV, X-ray, optical, and IR counterparts is observed. Those sources that are outliers to any particular trend are labelled in the respective plot. The radio versus FUV major axis comparison (bottom right) shows alignment only for those sources that exhibit evidence for either jet-triggered star formation or strong dynamical interaction between the radio source and star-forming gas. The dashed line on the bottom-right plot is the one-to-one line. Spearman-rank and Pearson correlation coefficients for these plots are shown in Table 4. PKS 0745, R2129, and Zw3146 show projected offsets of 9, 14.8, 1.3, 4.65, 7, and 11 kpc, respectively. The mean and median offsets are both roughly 8 kpc. Offsets between the X-ray emission and the optical/IR BCG peak are effectively the same for these targets (as the FUV and optical peaks are almost always cospatial, at least within our sample). The offset in A1664 has been previously noted Table 4. The Spearman-rank and Pearson correlation coefficients be- tween the FUV position angle (X) and the X-ray, optical, infrared, and radio position angles (Y). These quantities are plotted against one another in Fig. 4. Quantity (Y) Spearman rank Pearson Best-fitting correlation X-ray 0.81 0.84 Y ∝ X1±0.2 Optical 0.73 0.74 Y ∝ X0.9±0.1 Infrared 0.72 0.76 Y ∝ X1±0.2 Radio 0 0.10 ... by Kirkpatrick et al. (2009) in their detailed study of the source. The A1835, R2129, and Zw3146 offsets were noted by O’Dea et al. (2010). The X-ray surface brightness maps for all objects with X- ray/FUV photocentroid offsets show large scale ( 50 kpc) asymme- tries, suggestive of complex gas dynamics in the hot phase. Photo- centroid offsets between the BCG and the cluster X-ray emission is a proxy for how close (or how far) the system is to a state of dynam- ical equilibrium, such that the offsets should decrease as the cluster evolves (Katayama et al. 2003). Sloshing motions in the X-ray gas can nevertheless remain long lived even after the supposed viri- alization of the cluster (e.g. Markevitch & Vikhlinin 2007). Large optically selected samples of both CC and non-CC BCGs frequently show median X-ray/BCG offsets of ∼15 kpc (Bildfell et al. 2008; Loubser et al. 2009; Sanderson, Edge & Smith 2009). CC BCGs systematically lie below this median at ∼10 kpc, which is close to the median for those objects (with observed X-ray offsets) within MNRAS 451, 3768–3800 (2015) atSpaceTelescopeScienceInstituteonJuly9,2015http://mnras.oxfordjournals.org/Downloadedfrom
  • 11. 3778 G. R. Tremblay et al. our sample (∼8 kpc). If we include those galaxies in our sample that do not show any measurable projected offset (10 out of 16 sources), the sample-wide median and mean projected offsets are ∼0 and ∼3 kpc, respectively. The sources exhibiting kpc-scale offsets do not appear to prefer any particular galaxy property – instead they inhabit the full range of FUV morphology, SFR, radio power, etc. that is spanned by our whole sample. 3.4 Quantifying morphology by asymmetry and clumpiness indices Fig. 1 shows that our sample spans a diverse range of FUV mor- phologies, including sources that can be described as amorphous (e.g. Zw3146), clumpy (e.g. A11), point-like (e.g. Centaurus), disc- like (Hydra A), and filamentary (e.g. A2597, R1504). There is however significant overlap between these classes. For example, A2597 could be arbitrarily described as a hybrid of filamentary, amorphous, and clumpy structures, illustrating the need for a more objective measure of morphology. We therefore quantify all projected FUV morphology by means of scale-invariant structural indices, as is done frequently for galax- ies in the literature. We adopt the commonly used concentration– asymmetry–smoothness (CAS) system described by Conselice (2003), which posits that galaxy morphology can be entirely quan- tified by measuring the concentration of light (C) around a photo- centric point, the azimuthal asymmetry of light about this point (A), and the high spatial frequency smoothness or clumpiness (S) of that light. The CAS indices are useful in that they (a) are independent of any assumption about galaxy light distribution and (b) correlate with galaxy processes such as star formation, mergers, colours, emission line widths, etc. Galaxies of different Hubble type appropriately stratify within the optical CAS volume, which has been expanded to include other wavelength regimes over the years (including for extragalactic FUV imaging; see e.g. Holwerda, Pirzkal & Heiner 2012). In our case, there is a risk that any use of a concentration-of-light parameter C (typically defined by the ratio of curve-of-growth radii containing 80 and 20 per cent of all light) may be significantly con- taminated by the SBC red leak, for reasons discussed in Section 2.4. We therefore make use of only the asymmetry and clumpiness pa- rameters A and S, which (even without C) are useful in quantifying spatial anisotropy in FUV surface brightness. Following Conselice (2003), we compute the asymmetry index A by rotating each FUV image by 180◦ about a central point (discussed below), subtracting this from the original unrotated image, and then summing the abso- lute value intensities from the resulting residual map. The resultant value is then normalized by two times the original galaxy flux. Expressing the above more quantitatively, the asymmetry index is given by A = k × |Iθ=0 − Iθ=180| 2 × |Iθ=0| , (1) where Iθ = 0 and Iθ = 180 are the intensity distributions in the original and 180◦ rotated images, respectively. On both, the rotated and original images, the sum is taken over all pixels within matching regions that encompass all galaxy FUV flux (e.g. an ‘all the flux you see’ circular aperture). The resulting value of A depends strongly on the pixel about which the image is rotated, as is discussed by Conselice (2003). For sample-wide consistency, we have chosen to rotate each FUV image around the pixel that is cospatial with both the radio core and optical photocentroid of the host galaxy, such that our computed A values are at least somewhat related to the Figure 5. The FUV asymmetry index A, as defined by equation (1), versus the FUV ‘clumpiness index’ S, defined in equation (2). Higher values of A means that the FUV surface brightness distribution is more azimuthally asymmetric about the galaxy centre. Higher values of S means that the FUV emission features more high spatial frequency clumps, and less smooth emission. The two indices strongly correlate, such that a galaxy with a high A + S value can be considered more spatially anisotropic (in terms of FUV emission) than a galaxy with a low A + S value. These indices are discussed in Section 3.4. projected reflection asymmetry of young stars around the AGN. In a few cases, the radio core was not cospatial with the host galaxy optical photocentroid, but this was typically because of a central dust lane (Hydra A is one example). Comparison of both A and S values with those in other papers is beyond the scope of this work, so in the interests of simplicity we use k as a scalar normalization to set the range spanned by the A distribution to 0 ≤ A ≤ 1. Sources with lower values of A are more azimuthally symmetric about the centre of the galaxy than are sources with higher values of A. The ‘clumpiness’ parameter S was calculated by summing pixel intensities in an unsharp mask of the FUV image, made by Gaussian smoothing the map with both small and large kernel sizes, subtract- ing the heavily smoothed map from the lightly smoothed one, and then normalizing the residuals by the flux in the original image. More specifically, S is given by S = j × (I − Iσ ) − B I , (2) where I and Iσ are the intensity distributions in the lightly and heavily smoothed images, respectively. All of these sums are taken within a matching area, and all galaxy apertures are made with a central hole that intentionally excludes the galaxy nucleus (where an FUV point source might artificially weight the S value). B is the background intensity distribution within an off-source ‘sky’ aperture. We again normalize by j to set the range of possible S values equal to that of A, i.e. 0 ≤ S ≤ 1. A galaxy with S ≈ 1 will feature many high spatial frequency clumps, whereas an object with S ≈ 0 is very smooth. We plot A versus S in Fig. 5. The two indices strongly corre- late, such that sources that are more asymmetric also tend to be more clumpy. The trend is strong enough that for the remainder of MNRAS 451, 3768–3800 (2015) atSpaceTelescopeScienceInstituteonJuly9,2015http://mnras.oxfordjournals.org/Downloadedfrom
  • 12. FUV morphology of cool core BCGs 3779 Figure 6. Top left: infrared-estimated star formation rate versus redshift for all targets in our sample. SFRs estimated by other indicators in other wavelength regimes tend to be lower than the IR-based rate, which can be considered a rough upper-limit. Top right: ‘FUV anisotropy index’ (A + S) based on the CAS parameters described by Conselice (2003). We define the anisotropy index in Section 3.4. A2199 and Centaurus have been ‘greyed out’ so as not to give the illusion of correlation where there is likely none. These two sources may be highly contaminated by red leak (so their CAS morphology cannot be trusted), and their star formation rates are extremely low (perhaps effectively zero). this paper we will discuss A and S together by means of a single ‘FUV anisotropy index’ A + S, which can inhabit the range from 0 ≤ A + S ≤ 2. Galaxies with higher A + S are more clumpy, filamentary, and asymmetric, whereas galaxies with lower A + S values are more symmetrically amorphous or point like. 3.5 Comparison of FUV morphology with redshift, star formation rate, and ICM central entropy FUV morphology does not exhibit any obvious redshift depen- dence, despite the very strong redshift–luminosity bias present in our sample (which is assembled from flux limited and therefore Malmquist-biased catalogues). We demonstrate this bias in the top- left-hand panel of Fig. 6, where we plot the IR-estimated SFR versus redshift. Despite the expected strong upward trend in SFR with red- shift associated with the Malmquist bias, the top-right-hand panel of Fig. 2 – showing FUV anisotropy index (A + S) versus redshift – is effectively a scatter plot (note that, for each of these plots, we ‘grey out’ red-leak-contaminated A2199 and Centaurus, so they do not give the illusion of correlation). Galaxies at higher redshift marginally tend to have a higher FUV anisotropy value, albeit with very large scatter. The error bar on this plot reflects the rather large range that A + S can inhabit given slightly different choices of pixel about which the image is rotated (in the case of A) or smoothing lengths used to make the unsharp mask (in the case of S). We conclude that there is no evidence for any correlation between redshift and morphology in our sample. This is perhaps somewhat surprising, because one naturally expects a trend between redshift and morphology as (1 + z)4 surface brightness dimming and an- gular size scaling should make objects look increasingly smooth and symmetric as they approach the resolution limit at higher red- shifts. To independently test what effect redshift may have on per- ceived morphology in our sample, we have artificially redshifted all of our FUV images to one common redshift equal to that for our most distant target (Zw3146, z = 0.2906). An IRAF script was used to accomplish this, implementing the technique described by MNRAS 451, 3768–3800 (2015) atSpaceTelescopeScienceInstituteonJuly9,2015http://mnras.oxfordjournals.org/Downloadedfrom
  • 13. 3780 G. R. Tremblay et al. Giavalisco et al. (1996, specifically, see their equations 2–7). While artificially redshifting our targets had only a small effect on overall asymmetry A, it is clear from this test that redshift can have a strong effect on perceived smoothness S. Our lowest redshift targets around z = 0.01, for example, suffer a factor of ∼20 degradation in spa- tial resolution, lowering their A value negligibly and their S value moderately (depending on choice of smoothing scalelengths). It is therefore possible that our high-redshift targets are intrinsically far more clumpy than they appear. We therefore note that, while the top-right-hand panel of Fig. 6 provides no evidence for a correlation between A + S and redshift, it cannot be used to rule it out. We plot IR-estimated SFR versus FUV anisotropy index in the lower left-hand panel of Fig.6, finding no correlation. We do observe a weak upward trend of central ICM entropy with FUV anisotropy index, as is evident from the lower right-hand panel of Fig. 6. Here, entropy S (in units of keV cm2 ) is defined as S = kT n−2/3 e , where k is the Boltzmann constant, T is the gas temperature, and ne the electron density. Central entropy values have been adopted from the Archive of Chandra Cluster Entropy Profile Tables (ACCEPT) sample (Donahue et al. 2006; Cavagnolo et al. 2009). We again caution against overinterpretation here, particularly because calcu- lations of ICM central entropy from the X-ray data can be problem- atic and strongly tied to data quality (Panagoulia, Fabian & Sanders 2014). The plot merely demonstrates that sources with higher cen- tral entropy may have more spatially anisotropic star formation, at least within our sample. 3.6 Star-forming filaments aligned with radio jets and lobes Figs 7–9 shows selected X-ray, FUV, Lyα, and radio overlay figures for a subset of our sample. The three figures are presented in order of highest to lowest SFR, respectively. In these panels, one will find several clear spatial correlations between FUV emission, radio emission, and/or X-ray emission. We discuss these correlations in the next two sections. In Fig. 10, we highlight four examples of strong morphological alignment between FUV continuum/line emission and radio jets or lobes (shown in red contours). These include A1795, Hydra A, and A2597. While A1795 and A2597 are known and well-studied examples (e.g. O’Dea et al. 2004), such alignment has not previously been noted for Hydra A. Moreover, Fig. A11 shows some evidence of alignment in PKS 0745, whose ‘spike-like’ FUV filament is aligned with the axis about which the radio source appears to kink or fold over. There are now too many examples of clumpy/filamentary star formation aligning with radio jets and lobes for this cospatiality to credibly be pure coincidence or a projection effect (see e.g. Cen A – Crockett et al. 2012; Hamer et al. 2015; Santoro et al. 2015; Minkowski’s Object/NGC 541 – van Breugel et al. 1985; 3C 285 – van Breugel & Dey 1993; 4C 41.47; Bicknell et al. 2000; see also 3C 305, 3C 321, 3C 171, and 3C 277.3). These filaments may have been dynamically entrained, uplifted, or swept aside by the radio source, or may have formed in situ along the working surface of the radio lobe in an example of positive AGN feedback. It has long been predicted that star formation may be triggered by shock- induced cloud collapse as the propagating radio plasma entrains and displaces cold gas phases (see e.g. the shock-/jet-induced star formation models by Elmegreen & Elmegreen 1978; Voit 1988; De Young 1989; McNamara & O’Connell 1993). Jet-induced star formation has for many years been considered as a plausible ex- planation for the high-redshift alignment effect (Rees 1989; Daly 1990). Whatever the case, examples like these demonstrate that, at least for some time, star formation can survive (and may indeed be trig- gered by) dynamical interaction with a propagating radio source. If jet-triggered star formation is indeed a real effect, and is respon- sible for the alignment seen for the four targets in our sample, we can roughly estimate whether or not such an effect has a signifi- cant or negligible impact on the global SFR in the galaxy. If we take A1795, our most dramatic example, and assume that all FUV emission associated with the ‘P’-shaped filament cospatial with the radio lobes is directly induced by propagation of the jet, then up to 50 per cent of all star formation in the galaxy could be jet triggered. The upper limit percentages for the other sources in our sample are much lower, such that even if jet-triggered star formation is indeed real, it probably does not play the dominant role in driving star for- mation in the galaxy. We estimate that the effect may play a role at the few per cent level at best. Regardless, the apparently competing roles of radio mechanical feedback simultaneously quenching and triggering star formation can be reconciled with one another. Even if the propagating radio source does not (immediately) inhibit or truncate star formation directly, it may still work to starve it of gas for future star formation by excavating cavities and driving sound waves in the hot gas, preventing it from cooling and forming stars. 3.7 Spatial correlations and anti-correlations of star-forming filaments with X-ray cavities As we demonstrate in Fig. 11, six sources in our sample possess one or more kpc-scale narrow filaments that, in projection, extend towards, into, or wrap around the edges of kpc-scale X-ray cavities. These include Perseus, A2597, Hydra A, PKS 0745, Centaurus, and A1835. Two additional sources (A1664 and A1068) show weaker evidence (due perhaps to the unavailability of deeper X-ray imaging) of the same effect. Most of those filaments that extend towards and into cavities are FUV-bright and forming stars, while Perseus and Centaurus show only dusty, Hα bright filaments that lack cospatial FUV continuum. This may be evidence for buoyant uplift of the filament by the cavity as it rises amid the ICM, as has been discussed (typically in the context of Perseus) by many previous authors (e.g. Fabian 2003; Hatch et al. 2006; Canning et al. 2010, 2014; McDonald et al. 2011b). The spatial associations are certainly compelling, and filament uplift by cavities may indeed be an important and even common effect. It is, however, unlikely to be the only effect driving the morphology of all narrow filaments ubiquitously observed in CC BCGs, as there are many examples of filaments with no obvi- ous association with either a cavity (or radio source, for that matter). Ever-deeper observations of X-ray CCs do however tend to reveal ever more numerous X-ray cavities, so we cannot necessarily rule out the unlikely possibility that all filaments in CC BCGs have at some point been uplifted by a cavity. We find this unlikely, how- ever, as filament kinematics [at least for the small sample that has been fully mapped with an Integral Field Unit (IFU)] are generally inconsistent with expectations if they are indeed dragged outwards (see, for example, the northern filament in Perseus, which shows a smooth velocity gradient of a few 100 km s−1 , consistent with a laminar flow; Hatch et al. 2006). Alternatively, those filaments that wrap (in projection) around X-ray cavities may have formed in situ in the cavity’s compressed shell, though it is entirely unknown whether or not direct cooling from the X-ray to molecular phase is even possible absent dust (e.g. Fabian et al. 1994b). We expand on this below, in our discussion of FUV morphology in the context of ICM cooling and AGN heating. MNRAS 451, 3768–3800 (2015) atSpaceTelescopeScienceInstituteonJuly9,2015http://mnras.oxfordjournals.org/Downloadedfrom
  • 14. FUV morphology of cool core BCGs 3781 Figure 7. The three sources in our sample with the highest star formation rates ( 100 M⊙ yr−1). The left-hand panels show a wide view of X-ray emission cospatial with the BCG and its outskirts. White boxes are used to indicate the FOV of the right-hand panels, which show FUV continuum emission. Various contour sets are overlaid, and are labelled appropriately in their respective panels. MNRAS 451, 3768–3800 (2015) atSpaceTelescopeScienceInstituteonJuly9,2015http://mnras.oxfordjournals.org/Downloadedfrom
  • 15. 3782 G. R. Tremblay et al. Figure 8. A selection of sources in our sample that show moderate star formation rates ∼5 < SFR < 15 M⊙ yr−1. The left-hand panels show a wide view of X-ray emission cospatial with the BCG and its outskirts. White boxes are used to indicate the FOV of the right-hand panels, which show FUV continuum emission. Various contour sets are overlaid, and are labelled appropriately in their respective panels. MNRAS 451, 3768–3800 (2015) atSpaceTelescopeScienceInstituteonJuly9,2015http://mnras.oxfordjournals.org/Downloadedfrom
  • 16. FUV morphology of cool core BCGs 3783 Figure 9. The two sources in our sample in which there is effectively no ongoing star formation or FUV-bright young stars (or ≪0.1 M⊙yr−1).The left-hand panels show a wide view of X-ray emission cospatial with the BCG and its outskirts. White boxes are used to indicate the FOV of the right-hand panels. For Centaurus, we show a B/H-band colour map made with HST data, showing the famous dust lane associated with the source. The (almost non-existent) FUV emission in the radio core is shown in red contours. For A2199, the rightmost panel shows FUV continuum emission. The diffuse emission seen in A2199 may be an artefact of the ACS SBC red leak. 4 DISCUSSION The exquisitely complex and highly diverse range of far-ultraviolet morphologies presented in this paper reflect the dynamical re- sponse of low-entropy gas to a highly energetic, chaotic environ- ment. Besides the gravitational potential of their host galaxies, these star-forming nebulae reside amid AGN-driven jets, bubbles, sound waves, bulk ICM motions, and stellar feedback, and few structures observed in our FUV data set are likely to be long lived. Hydra A’s rotating, star-forming disc (Hamer et al. 2014) reveals cold gas that is largely in dynamical equilibrium, though it still features nar- row filaments that have likely been lifted outward by the radio jet (Figs 10 and A9), or dynamically stirred by a small companion galaxy (Fig. 12). A1795 (Fig. A4) not only features radio lobes frosted with young stars, but a ∼20 kpc southern tail deposited perhaps by a cooling wake that lags behind the BCG (McDonald & Veilleux 2009). Centaurus (Fig. A8) features no discernible star formation whatsoever, but a spectacular winding dust lane whose shape mirrors that of the larger scale X-ray spiral. In many ways, conclusions drawn from a small collection of highly complex individual galaxies are doomed to ambiguity. If each source is so chaotic and time varying, what can we learn in a ‘big picture’ context? The answer may be that our data are snapshots of a prototypical CC BCG at different stages of an AGN outburst cycle. Throughout the past ∼3 Gyr of cosmic his- tory that our sample’s redshift range spans, perhaps each galaxy has spent (or will spend) some time resembling each of the oth- ers as the tug-of-war between ICM cooling and AGN heating cycles and varies. Indeed, AGN can vary in power and switch on and off over a manifold range of time-scales, and the asso- ciated balance of AGN heating and ICM cooling can vary still more. Recent numerical work by Sharma et al. (2012a), McCourt et al. (2012), and Gaspari et al. (2012) has shown that thermal instabilities in a cooling flow can produce a multiphase and star-forming ISM when the ratio of the cooling time tcool to the local gravitational free-fall time-scale tff is tcool/tff 10 (see also Pizzolato & Soker 2005, 2010). This theoretical framework has since been expanded in a series of papers by Voit and collaborators, who propose a precipitation-regulated AGN feedback model applicable not only to BCGs and giant ellipticals (Voit & Donahue 2015; Voit et al. MNRAS 451, 3768–3800 (2015) atSpaceTelescopeScienceInstituteonJuly9,2015http://mnras.oxfordjournals.org/Downloadedfrom
  • 17. 3784 G. R. Tremblay et al. Figure 10. The strongest examples of FUV/radio morphological correlation and anti-correlation in our sample. This is perhaps evidence for (a) star-forming filaments that have been uplifted, entrained, or swept aside by the propagating radio source or (b) jet-triggered star formation. Note also that PKS 0745 (Fig. A11) shows weaker evidence for a similar alignment. 2015a,b), but perhaps galaxies in general (Voit et al. 2015c). In the model, cold clouds precipitate out of the ambient hot medium via thermal instability wherever tcool 10tff. Cold chaotic accretion (Gaspari, Ruszkowski & Oh 2013; Gaspari et al. 2014) from the now ‘raining’ ambient hot atmosphere boosts black hole feeding to ∼100 times the Bondi rate, powering jets that can stimulate further precipitation by dragging low-entropy gas to higher altitudes, where the cooling-to-dynamical time ratio will lessen. At the same time, jet heating works to raise the local cooling time, resulting in the system’s self-regulation at nearly tcool ≈ 10tff (Voit & Donahue 2015; Voit et al. 2015a,b). The maximal radius within which FUV emission is detected in our images can be used in a very rough comparison with this theoret- ical prediction. Assuming (a) that the star formation in our sources is indeed powered by a precipitation-based cooling flow and (b) there is no non-detected star formation beyond the largest measured FUV radius, this ‘maximal FUV radius’ serves as a rough observable tracer of the radial threshold for the onset of cooling flow powered star formation. Models of precipitation-regulated feedback predict that this radius should coincide with tcool ≈ 10tff. Of course, as- sumption (b) may be not reasonable, as deeper FUV observations may reveal larger maximal FUV radii for a significant fraction of our sample. One must also consider that these filaments may have been uplifted by jets or buoyant cavities in some cases. The maxi- mal FUV radius should therefore be treated as a lower limit in this caveat-laden test. To derive tff, we adopt the spectrally deprojected X-ray emissiv- ity, cooling time, and electron density profiles from work on the ACCEPT sample by Donahue et al. (2006) and Cavagnolo et al. (2009). To these, we fit third-order polynomials in log space, and then analytically differentiate to obtain the gravitational free-fall time tff. The presence of the BCG was accounted for by enforcing a minimum value of the gravitational acceleration g equal to that of an isothermal sphere with a velocity dispersion of 250 km s−1 (a correction that is only important at radii 10 kpc). The result is shown in Fig. 13, where we compare the maxi- mal FUV radius with the X-ray entropy and cooling-to-dynamical time ratios measured at that same cluster-centric radius. Within our sample, the average maximal radius (and its ±1σ interval) within which FUV continuum emission is detected is 14.7 ± 10.14 kpc. At this average radius, the average (and ±1σ) cooling time, entropy, and cooling-to-dynamical time ratio is 1.09 ± 0.68 Gyr, 28.27 ± 12.12 keV cm2 , and 14.78 ± 8.57, respectively. These average val- ues and their ±1σ intervals are marked by the black solid and dashed lines (respectively) on the two panels in Fig. 13. Blue and red points are used to differentiate between those sources with unre- solved radio sources (and higher SFRs) and resolved radio sources (and lower SFRs). As entropy rises with radius, the points on the MNRAS 451, 3768–3800 (2015) atSpaceTelescopeScienceInstituteonJuly9,2015http://mnras.oxfordjournals.org/Downloadedfrom
  • 18. FUV morphology of cool core BCGs 3785 Figure 11. Six sources for which there is some evidence of kpc-scale filaments extending in projection towards and around X-ray cavities. FUV contours are overlaid in green on X-ray unsharp masks. Centaurus has no discernible star formation, but its dust contours do possess filaments that extend towards cavities. We show these dust contours in blue. For Hydra A, we show Hα contours as these better show the faint filament that follows the northern cavity. While not shown, FUV emission at low surface brightness in Hydra A is fully cospatial with the Hα filaments shown above. Figure 12. The new HST I-band optical image of the Hydra A BCG and its surrounding environment. On the right-hand panel we overlay both the VLA 4.6 GHz radio contours and the MMTF narrow-band Hα contours. The Hα distribution shows evidence for dynamical interaction with both the radio source (note the apparently uplifted filaments northward and southward of the nucleus) as well as the small companion galaxy ∼10 arcsec to the south-east. While this companion is unlikely to provide a substantial cold gas mass to the BCG via merger-driven flow, it may be acting to dynamically ‘stir’ the low-entropy gas already present in the BCG. The companion is cospatial with a bright knot of both Hα and FUV continuum emission. leftmost panel of course also rise (i.e. larger local entropies will be found at larger maximal FUV radii). We find that the observed average ‘star formation onset’ threshold of S = 28 keV cm2 is very close to the empirical (rough) threshold of S ≈ 30 keV cm2 from Cavagnolo et al. (2008), which we mark with the green dashed line on the left-hand panel of Fig. 13. The average observed tcool/tff ratio of 14.78 is close to the predicted threshold of tcool/tff 10 by Sharma et al. (2012b), which we mark with the green dashed line on the rightmost panel of Fig. 13. Sources with higher SFRs cluster more strongly around tcool ≈ 10tff than do sources with lower SFRs. Heeding the strong caveats noted above, this may be roughly consistent (or at least not obviously MNRAS 451, 3768–3800 (2015) atSpaceTelescopeScienceInstituteonJuly9,2015http://mnras.oxfordjournals.org/Downloadedfrom
  • 19. 3786 G. R. Tremblay et al. ~ Figure 13. Here, we compare the maximal FUV radius with the X-ray entropy (left) and cooling-to-dynamical time ratios (right) measured at that same cluster-centric radius. Assuming (a) that the star formation in our sources is indeed powered by a cooling flow and (b) there is no non-detected star formation beyond the largest measured FUV radius, the maximal radius within which FUV emission is observed serves as a rough observable tracer of the radial threshold for the onset of cooling flow powered star formation. Within our sample, the average maximal radius (and its ±1σ interval) within which FUV continuum emission is detected is 14.7 ± 10.14 kpc. At this average radius, the average (and ±1σ) cooling time, entropy, and cooling-to-dynamical time ratio is 1.09 ± 0.68 Gyr, 28.27 ± 12.12 keV cm2, and 14.78 ± 8.57, respectively. These average values and their ±1σ intervals are marked by the black solid and dashed lines (respectively) on both panels. Blue and red points are used to differentiate between those sources with unresolved radio sources (and higher SFRs) and resolved radio sources (and lower SFRs). As entropy rises with radius, the points on the leftmost panel of course also rise (i.e. larger local entropies will be found at larger maximal FUV radii). Both results are found to be roughly consistent (although with large scatter) with the respective predictions by Cavagnolo et al. (2008) and Sharma et al. (2012a), which are marked by the green dashed line on both plots. inconsistent) with theoretical predictions by Sharma et al. (2012b), McCourt et al. (2012), and Voit et al. (2015a). Li & Bryan (2014a,b) and Li et al. (2015) have published new adaptive mesh hydrodynamical simulations of BCGs consis- tent with the precipitation-regulated AGN feedback framework. In Fig. 14, we show selected snapshots of the cold, star-forming gas produced by the standard run in Li et al. (2015) for a single BCG, and compare these with our FUV images. The simulated cooling flow begins at t ∼ 300 Myr (roughly the central cooling time of Perseus), which ignites AGN feedback. The jets trigger more ICM to cool into filamentary structures, causing more cold gas to rain into the nucleus. This fuels both star formation and black hole accretion, leading to a major AGN outburst. AGN feed- back heats up the core, reducing the cooling rate and causing tcool to increase; star formation gradually consumes the cold gas until it vanishes, which turns off AGN feedback and allows the ICM to cool again. The cluster experiences three such cycles within 6.5 Gyr. Most of the images shown in Fig. 14 are from the second cycle that starts around t = 1.6 Gyr. Within this cycle, the simulation produces star-forming structures that are remarkably similar to our FUV images not only in morphology, axial ratio, and physical ex- tent, but also in SFR. That is, when the simulated morphology matches that of one of our FUV images, its associated SFR also roughly matches. These structures are reproduced by the simula- tion in the same ∼3 Gyr temporal slice spanned by the redshift range of our sample. Their simulated multiphase (hot, warm, and cold) gas morphology is also remarkably similar to the multiwave- length morphologies we have presented here. This is illustrated in the topmost panels of Fig. 14, in which the RGB multiwavelength composite of Hydra A in X-ray, Hα, and FUV is nearly indistin- guishable from the simulation snapshot at 2.9 Gyr, which comes complete with a rotating, star-forming disc. While surely other stochastic events such as mergers play an ad- ditional role in sculpting the morphology of star-forming filaments in CC BCGs, the Li et al. simulations show that they need not be invoked to explain the FUV morphologies we observe (the same was true for a similar comparison made in Donahue et al. 2015). Instead, nearly all FUV morphologies shown in this paper appear in a simulated BCG whose evolution is driven by precipitation- regulated AGN feedback. The FUV images presented in this paper may be snapshots at successive stages of an ICM cooling/AGN heating cycle. 5 SUMMARY AND CONCLUDING REMARKS We have analysed the far-ultraviolet morphology of star-forming clouds and filaments in 16 low-redshift (z < 0.29) CC BCGs. X-ray, Lyα, Hα, broad-band optical/IR, and radio maps were com- pared with the FUV emission, providing a high spatial resolution atlas of star formation locales relative to the ambient hot and warm ionized gas phases, as well as the old stellar population and radio- bright AGN outflows. The main results of this paper are summarized as follows. (i) Nearly half of the sample possesses kpc-scale narrow fila- ments that, in projection, extend towards, into, and around radio lobes and/or X-ray cavities. Most (but not all) of these filaments are FUV-bright and forming stars, and we suggest that they have either been uplifted by the radio lobe or buoyant X-ray cavity, or have formed in situ by jet-triggered star formation or rapid cooling in the cavity’s compressed shell. MNRAS 451, 3768–3800 (2015) atSpaceTelescopeScienceInstituteonJuly9,2015http://mnras.oxfordjournals.org/Downloadedfrom
  • 20. FUV morphology of cool core BCGs 3787 Figure 14. Observations compared with simulations by Y. Li and collaborators (e.g. Li & Bryan 2014a,b; Li et al. 2015). Top panels: a multiwavelength (X-ray, FUV, and Hα) composite of Hydra A, compared with a single snapshot of the Li et al. (2015) simulation at 2.9 Gyr. The RGB channels are set to roughly simulate Hα, FUV, and X-ray emmissivities, respectively, though two ‘cheats’ have been used: the green channel shows cold, dense gas where star formation appears in the simulation – the assumption, then, is that FUV emission from these young stars would roughly show the same morphology. The red channel does not explicitly show simulated Hα, but rather intermediate temperature gas whose morphology closely matches a rough scaling to simulate collisionally ionized (but not photoionized) Hα. It should therefore be treated as a very rough approximation. Bottom panels: selected FUV images from our sample are shown in orange, and projected density-weighted density snapshots from the simulation are shown in blue. The bright knots and filaments show the high-density low-temperature clouds that are forming stars in the simulation (see Li et al. 2015 for details). Our sample’s redshift range spans ∼3 Gyr of cosmic history. The simulation is capable of producing star-forming structures similar in axial ratio, physical extent, and star formation rate within the same ∼3 Gyr temporal slice of the simulated cluster’s evolution. MNRAS 451, 3768–3800 (2015) atSpaceTelescopeScienceInstituteonJuly9,2015http://mnras.oxfordjournals.org/Downloadedfrom
  • 21. 3788 G. R. Tremblay et al. (ii) The maximal projected radius to which FUV emission is observed to extend corresponds to a cooling-to-free-fall time of tcool/tff ∼ 10 for the majority of the sample. Sources with higher SFRs cluster more strongly about this ratio than do sources with lower SFRs. This may be roughly consistent (or at least not in- consistent) with theoretical predictions by Sharma et al. (2012b), McCourt et al. (2012), and Voit et al. (2015a). We nevertheless stress that maximal FUV radius is not the ideal tracer for the on- set of purported ICM precipitation, as one must consider imaging depth, extinction, and other morphological drivers such as filament uplift. (iii) The diverse range of morphology, axial ratio, spatial extent, and SFR in our FUV sample is almost entirely recovered in a sin- gle simulation by Li et al. (2015), demonstrating that galaxy-scale stochastic events such as mergers need not be invoked to explain the complex FUV morphologies we observe. Instead, we suggest that our images represent snapshots of a prototypical CC BCG at many stages of its evolution. ACKNOWLEDGEMENTS The authors thank Drs. Richard Bower, Tim Davis, Bill Forman, Nina Hatch, Claudia Lagos, Robert Laing, Jason Spyromilio, and Aurora Simionescu for thoughtful discussions. GRT acknowledges support from a NASA Einstein Fellowship under award number PF-150128, as well as a European Southern Observatory (ESO) Fellowship partially funded by the European Community’s Seventh Framework Programme (/FP7/2007-2013/) under grant agreement number 229517. Support for this work was provided by the National Aeronautics and Space Administration through Einstein Postdoc- toral Fellowship Award Number PF-150128 issued by the Chandra X-ray Observatory Center, which is operated by the Smithsonian Astrophysical Observatory for and on behalf of NASA under con- tract NAS8-03060. YL acknowledges financial support from NSF grants AST-0908390, AST-1008134, AST-1210890, AST-1008454, NASA grants NNX12AH41G, NNX12AC98G, and ATP12-ATP12- 0017, as well as computational resources from NASA, NSF XSEDE and Columbia University. TEC was partially supported by NASA through Chandra award G06-7115B issued by the Chandra X-ray Observatory Center for and on behalf of NASA under contract NAS8-39073. Basic research into radio astronomy at the Naval Re- search Laboratory is supported by 6.1 Base funds. This paper is based on observations made with the NASA/ESA Hubble Space Telescope, obtained at the Space Telescope Science Institute, which is operated by the Association of Universities for Research in As- tronomy, Inc., under NASA contract 5-26555. This research made use of Astropy, a community-developed core PYTHON package for Astronomy (Astropy Collaboration et al. 2013). We have also made extensive use of the NASA Astrophysics Data System bibliographic services and the NASA/IPAC Extragalactic Database, operated by the Jet Propulsion Laboratory, California Institute of Technology, under contract with NASA. REFERENCES Astropy Collaboration et al., 2013, A&A, 558, A33 Baldi R. D. et al., 2010, ApJ, 725, 2426 Baum S. A., 1987, PhD thesis, Maryland Univ., College Park Baum S. A., Laor A., O’Dea C. P., Mack J., Koekemoer A. M., 2005, ApJ, 632, 122 Best P. N., Kaiser C. R., Heckman T. M., Kauffmann G., 2006, MNRAS, 368, L67 Best P. N., von der Linden A., Kauffmann G., Heckman T. M., Kaiser C. R., 2007, MNRAS, 379, 894 Bicknell G. V., Sutherland R. S., van Breugel W. J. M., Dopita M. A., Dey A., Miley G. K., 2000, ApJ, 540, 678 Bildfell C., Hoekstra H., Babul A., Mahdavi A., 2008, MNRAS, 389, 1637 Bˆırzan L., Rafferty D. A., McNamara B. R., Wise M. W., Nulsen P. E. J., 2004, ApJ, 607, 800 Bˆırzan L., McNamara B. R., Nulsen P. E. J., Carilli C. L., Wise M. W., 2008, ApJ, 686, 859 B¨ohringer H., Burwitz V., Zhang Y.-Y., Schuecker P., Nowak N., 2005, ApJ, 633, 148 Boschin W., 2002, A&A, 396, 397 Bregman J. N., David L. P., 1988, ApJ, 326, 639 Brighenti F., Mathews W. G., Temi P., 2015, ApJ, 802, 118 Burns J. O., 1990, AJ, 99, 14 Canning R. E. A., Fabian A. C., Johnstone R. M., Sanders J. S., Conselice C. J., Crawford C. S., Gallagher J. S., Zweibel E., 2010, MNRAS, 405, 115 Canning R. E. A. et al., 2014, MNRAS, 444, 336 Canning R. E. A., Ferland G. J., Fabian A. C., Johnstone R. M., van Hoof P. A. M., Porter R. L., Werner N., Williams R. J. R., 2015, preprint (arXiv:e-prints) Cavagnolo K. W., Donahue M., Voit G. M., Sun M., 2008, ApJ, 683, L107 Cavagnolo K. W., Donahue M., Voit G. M., Sun M., 2009, ApJS, 182, 12 Cavagnolo K. W., McNamara B. R., Nulsen P. E. J., Carilli C. L., Jones C., Bˆırzan L., 2010, ApJ, 720, 1066 Clampin M. et al., 2004, in Grycewicz T. J., McCreight C. R., eds, Proc. SPIE Vol. 5167, Focal Plane Arrays for Space Telescopes. SPIE, Bellingham, p. 235 Clarke T. E., Sarazin C. L., Blanton E. L., Neumann D. M., Kassim N. E., 2005, ApJ, 625, 748 Condon J. J., Helou G., Sanders D. B., Soifer B. T., 1996, ApJS, 103, 81 Condon J. J., Cotton W. D., Greisen E. W., Yin Q. F., Perley R. A., Taylor G. B., Broderick J. J., 1998, AJ, 115, 1693 Conselice C. J., 2003, ApJS, 147, 1 Conselice C. J., Gallagher J. S., III, Wyse R. F. G., 2001, AJ, 122, 2281 Crockett R. M. et al., 2012, MNRAS, 421, 1603 Daly R. A., 1990, ApJ, 355, 416 De Young D. S., 1989, ApJ, 342, L59 Donahue M., Mack J., Voit G. M., Sparks W., Elston R., Maloney P. R., 2000, ApJ, 545, 670 Donahue M., Horner D. J., Cavagnolo K. W., Voit G. M., 2006, ApJ, 643, 730 Donahue M., Sun M., O’Dea C. P., Voit G. M., Cavagnolo K. W., 2007, AJ, 134, 14 Donahue M., de Messi`eres G. E., O’Connell R. W., Voit G. M., Hoffer A., McNamara B. R., Nulsen P. E. J., 2011, ApJ, 732, 40 Donahue M. et al., 2015, ApJ, 805, 177 Dong R., Rasmussen J., Mulchaey J. S., 2010, ApJ, 712, 883 Dressel L., 2012, Wide Field Camera 3, HST Instrument Handbook. STScI Dunn R. J. H., Fabian A. C., 2006, MNRAS, 373, 959 Edge A. C., 2001, MNRAS, 328, 762 Edge A. C., Frayer D. T., 2003, ApJ, 594, L13 Edge A. C. et al., 2010a, A&A, 518, L46 Edge A. C. et al., 2010b, A&A, 518, L47 Edwards L. O. V., Hudson M. J., Balogh M. L., Smith R. J., 2007, MNRAS, 379, 100 Egami E. et al., 2006, ApJ, 647, 922 Elmegreen B. G., Elmegreen D. M., 1978, ApJ, 220, 1051 Fabian A. C., 1999, MNRAS, 308, L39 Fabian A. C., 2003, MNRAS, 344, L27 Fabian A. C., 2012, ARA&A, 50, 455 Fabian A. C., Canizares C. R., Boehringer H., 1994a, ApJ, 425, 40 Fabian A. C., Johnstone R. M., Daines S. J., 1994b, MNRAS, 271, 737 Fabian A. C., Sanders J. S., Taylor G. B., Allen S. W., 2005, MNRAS, 360, L20 Fabian A. C., Johnstone R. M., Sanders J. S., Conselice C. J., Crawford C. S., Gallagher J. S., III, Zweibel E., 2008, Nature, 454, 968 MNRAS 451, 3768–3800 (2015) atSpaceTelescopeScienceInstituteonJuly9,2015http://mnras.oxfordjournals.org/Downloadedfrom
  • 22. FUV morphology of cool core BCGs 3789 Fabian A. C. et al., 2011a, MNRAS, 418, 2154 Fabian A. C., Sanders J. S., Williams R. J. R., Lazarian A., Ferland G. J., Johnstone R. M., 2011b, MNRAS, 417, 172 Fanaroff B. L., Riley J. M., 1974, MNRAS, 167, 31P Ferland G. J., Fabian A. C., Hatch N. A., Johnstone R. M., Porter R. L., van Hoof P. A. M., Williams R. J. R., 2009, MNRAS, 392, 1475 Fruscione A. et al., 2006, in Silva D. R., Doxsey R. E., eds, Proc. SPIE Vol. 6270, Observatory Operations: Strategies, Processes, and Systems. SPIE, Bellingham, p. 62701V Gaspari M., Ruszkowski M., Sharma P., 2012, ApJ, 746, 94 Gaspari M., Ruszkowski M., Oh S. P., 2013, MNRAS, 432, 3401 Gaspari M., Ruszkowski M., Oh S. P., Brighenti F., Temi P., 2014, preprint (arXiv:e-prints) Ge J. P., Owen F. N., 1993, AJ, 105, 778 Ge J., Owen F. N., 1994, AJ, 108, 1523 Giavalisco M., Livio M., Bohlin R. C., Macchetto F. D., Stecher T. P., 1996, AJ, 112, 369 Govoni F., Murgia M., Markevitch M., Feretti L., Giovannini G., Taylor G. B., Carretti E., 2009, A&A, 499, 371 Guo F., Mathews W. G., 2014, ApJ, 780, 126 Hamer S. L. et al., 2014, MNRAS, 437, 862 Hamer S., Salom´e P., Combes F., Salom´e Q., 2015, A&A, 575, L3 Harris W. E., Whitmore B. C., Karakla D., Oko´n W., Baum W. A., Hanes D. A., Kavelaars J. J., 2006, ApJ, 636, 90 Hatch N. A., Crawford C. S., Johnstone R. M., Fabian A. C., 2006, MNRAS, 367, 433 Heckman T. M., 1981, ApJ, 250, L59 Heckman T. M., Baum S. A., van Breugel W. J. M., McCarthy P., 1989, ApJ, 338, 48 Hlavacek-Larrondo J., Fabian A. C., Edge A. C., Ebeling H., Sanders J. S., Hogan M. T., Taylor G. B., 2012, MNRAS, 421, 1360 Hoffer A. S., Donahue M., Hicks A., Barthelemy R. S., 2012, ApJS, 199, 23 Holtzman J. A. et al., 1996, AJ, 112, 416 Holwerda B. W., Pirzkal N., Heiner J. S., 2012, MNRAS, 427, 3159 Hu E. M., Cowie L. L., Wang Z., 1985, ApJS, 59, 447 Jaffe W., Bremer M. N., 1997, MNRAS, 284, L1 Johnstone R. M., Fabian A. C., Nulsen P. E. J., 1987, MNRAS, 224, 75 Johnstone R. M., Canning R. E. A., Fabian A. C., Ferland G. J., Lykins M., Porter R. L., van Hoof P. A. M., Williams R. J. R., 2012, MNRAS, 425, 1421 Katayama H., Hayashida K., Takahara F., Fujita Y., 2003, ApJ, 585, 687 Kirkpatrick C. C. et al., 2009, ApJ, 697, 867 Laursen P., Sommer-Larsen J., 2007, ApJ, 657, L69 Li Y., Bryan G. L., 2014a, ApJ, 789, 54 Li Y., Bryan G. L., 2014b, ApJ, 789, 153 Li Y., Bryan G. L., Ruszkowski M., Voit G. M., O’Shea B. W., Donahue M., 2015, preprint (arXiv:e-prints) Lim J., Ao Y., Dinh-V-Trung, 2008, ApJ, 672, 252 Loubser S. I., S´anchez-Bl´azquez P., Sansom A. E., Soechting I. K., 2009, MNRAS, 398, 133 McCourt M., Sharma P., Quataert E., Parrish I. J., 2012, MNRAS, 419, 3319 McDonald M., Veilleux S., 2009, ApJ, 703, L172 McDonald M., Veilleux S., Rupke D. S. N., Mushotzky R., 2010, ApJ, 721, 1262 McDonald M., Veilleux S., Rupke D. S. N., 2011a, ApJ, 731, 33 McDonald M., Veilleux S., Rupke D. S. N., Mushotzky R., Reynolds C., 2011b, ApJ, 734, 95 McDonald M. et al., 2012, Nature, 488, 349 McDonald M., Benson B., Veilleux S., Bautz M. W., Reichardt C. L., 2013a, ApJ, 765, L37 McDonald M. et al., 2013b, ApJ, 774, 23 McDonald M. et al., 2014, ApJ, 784, 18 McNamara B. R., Nulsen P. E. J., 2007, ARA&A, 45, 117 McNamara B. R., Nulsen P. E. J., 2012, New J. Phys., 14, 5023 McNamara B. R., O’Connell R. W., 1993, AJ, 105, 417 McNamara B. R. et al., 2001, ApJ, 562, L149 McNamara B. R., Wise M. W., Murray S. S., 2004, ApJ, 601, 173 McNamara B. R. et al., 2006, ApJ, 648, 164 McNamara B. R. et al., 2014, ApJ, 785, 44 Markevitch M., Vikhlinin A., 2007, Phys. Rep., 443, 1 Mittal R., Hudson D. S., Reiprich T. H., Clarke T., 2009, A&A, 501, 835 Mittal R. et al., 2011, MNRAS, 1558 Mittal R. et al., 2012, MNRAS, 426, 2957 Mittal R., Whelan J. T., Combes F., 2015, MNRAS, 450, 2564 Nulsen P. E. J., McNamara B. R., Wise M. W., David L. P., 2005, ApJ, 628, 629 Nulsen P. E. J. et al., 2013, ApJ, 775, 117 O’Connell R. W., 1999, ARA&A, 37, 603 O’Dea C. P., Baum S. A., Mack J., Koekemoer A. M., Laor A., 2004, ApJ, 612, 131 O’Dea C. P. et al., 2008, ApJ, 681, 1035 O’Dea K. P. et al., 2010, ApJ, 719, 1619 Ogrean G. A., Hatch N. A., Simionescu A., B¨ohringer H., Br¨uggen M., Fabian A. C., Werner N., 2010, MNRAS, 406, 354 Oonk J. B. R., Jaffe W., Bremer M. N., van Weeren R. J., 2010, MNRAS, 405, 898 Oonk J. B. R., Hatch N. A., Jaffe W., Bremer M. N., van weeren R. J., 2011, MNRAS, 414, 2309 Panagoulia E. K., Fabian A. C., Sanders J. S., 2014, MNRAS, 438, 2341 Peterson J. R., Fabian A. C., 2006, Phys. Rep., 427, 1 Pizzolato F., Soker N., 2005, ApJ, 632, 821 Pizzolato F., Soker N., 2010, MNRAS, 408, 961 Quillen A. C. et al., 2008, ApJS, 176, 39 Rafferty D. A., McNamara B. R., Nulsen P. E. J., Wise M. W., 2006, ApJ, 652, 216 Rafferty D. A., McNamara B. R., Nulsen P. E. J., 2008, ApJ, 687, 899 Rawle T. D. et al., 2012, ApJ, 747, 29 Rees M. J., 1989, MNRAS, 239, 1P Russell H. R. et al., 2014, ApJ, 784, 78 Salom´e P., Combes F., 2003, A&A, 412, 657 Salom´e P. et al., 2006, A&A, 454, 437 Salom´e P., Combes F., Revaz Y., Downes D., Edge A. C., Fabian A. C., 2011, A&A, 531, A85 Sand D. J., Treu T., Ellis R. S., Smith G. P., 2005, ApJ, 627, 32 Sanders J. S., Fabian A. C., 2007, MNRAS, 381, 1381 Sanderson A. J. R., Edge A. C., Smith G. P., 2009, MNRAS, 398, 1698 Santoro F., Oonk J. B. R., Morganti R., Oosterloo T. A., Tremblay G., 2015, A&A, 575, L4 Sarazin C. L., 1986, Rev. Mod. Phys., 58, 1 Sarazin C. L., Burns J. O., Roettiger K., McNamara B. R., 1995, ApJ, 447, 559 Sharma P., McCourt M., Quataert E., Parrish I. J., 2012a, MNRAS, 420, 3174 Sharma P., McCourt M., Parrish I. J., Quataert E., 2012b, MNRAS, 427, 1219 Simpson C., Westoby P., Arumugam V., Ivison R., Hartley W., Almaini O., 2013, MNRAS, 433, 2647 Smith G. P. et al., 2010, MNRAS, 409, 169 Smith B. D., O’Shea B. W., Voit G. M., Ventimiglia D., Skillman S. W., 2013, ApJ, 778, 152 Soker N., 2003, MNRAS, 342, 463 Sparks W. B., 1992, ApJ, 399, 66 Sparks W. B., 1997, in Soker N., ed., ASP Conf. Ser. Vol. 115, Galactic Cluster Cooling Flows. Astron. Soc. Pac., San Francisco, p. 192 Sparks W. B., Macchetto F., Golombek D., 1989, ApJ, 345, 153 Sparks W. B., Pringle J. E., Donahue M., Carswell R., Voit M., Cracraft M., Martin R. G., 2009, ApJ, 704, L20 Sparks W. B. et al., 2012, ApJ, 750, L5 Sun M., 2012, New J. Phys., 14, 045004 Taylor G. B., Perley R. A., Inoue M., Kato T., Tabara H., Aizu K., 1990, ApJ, 360, 41 Taylor G. B., Barton E. J., Ge J., 1994, AJ, 107, 1942 Taylor G. B., Fabian A. C., Allen S. W., 2002, MNRAS, 334, 769 Tremblay G., 2011, PhD thesis, RIT MNRAS 451, 3768–3800 (2015) atSpaceTelescopeScienceInstituteonJuly9,2015http://mnras.oxfordjournals.org/Downloadedfrom
  • 23. 3790 G. R. Tremblay et al. Tremblay G. R. et al., 2012a, MNRAS, 424, 1026 Tremblay G. R. et al., 2012b, MNRAS, 424, 1042 Tremblay G. R. et al., 2014, ApJ, 790, L26 Ubeda et al., 2012, Advanced Camera for Surveys HST Instrument Hand- book. STScI van Breugel W. J. M., Dey A., 1993, ApJ, 414, 563 van Breugel W., Filippenko A. V., Heckman T., Miley G., 1985, ApJ, 293, 83 Voit G. M., 1988, ApJ, 331, 343 Voit G. M., 2011, ApJ, 740, 28 Voit G. M., Donahue M., 1997, ApJ, 486, 242 Voit G. M., Donahue M., 2005, ApJ, 634, 955 Voit G. M., Donahue M., 2015, ApJ, 799, L1 Voit G. M., Cavagnolo K. W., Donahue M., Rafferty D. A., McNamara B. R., Nulsen P. E. J., 2008, ApJ, 681, L5 Voit G. M., Donahue M., Bryan G. L., McDonald M., 2015a, Nature, 519, 203 Voit G. M., Donahue M., O’Shea B. W., Bryan G. L., Sun M., Werner N., 2015b, ApJ, 803, L21 Voit G. M., Bryan G. L., O’Shea B. W., Donahue M., 2015c, preprint (arXiv:1505.03592) von der Linden A., Best P. N., Kauffmann G., White S. D. M., 2007, MNRAS, 379, 867 Wilman R. J., Edge A. C., Swinbank A. M., 2009, MNRAS, 395, 1355 Wise M. W., McNamara B. R., Murray S. S., 2004, ApJ, 601, 184 Wise M. W., McNamara B. R., Nulsen P. E. J., Houck J. C., David L. P., 2007, ApJ, 659, 1153 APPENDIX A: MULTIWAVELENGTH OVERLAY FIGURES Figure A1. The Abell 11 BCG (z = 0.1660). The FUV continuum image and broad-band optical unsharp mask are shown in the left- and right-hand panels, respectively. Lyα contours are overlaid in green. The radio source is unresolved. The FUV colour bar can be scaled to a flux density by the inverse sensitivity 4.392 × 10⁻¹⁷ erg cm−2 Å−1 electron−1. The centroids of both panels are aligned, with east left and north up. MNRAS 451, 3768–3800 (2015) atSpaceTelescopeScienceInstituteonJuly9,2015http://mnras.oxfordjournals.org/Downloadedfrom
  • 24. FUV morphology of cool core BCGs 3791 Figure A2. A multiwavelength view of the Abell 1068 BCG (z = 0.1375). X-ray, FUV continuum, and broad-band optical images are shown in the top-left, centre, and right-hand panels, respectively. Contours of constant FUV continuum surface brightness are overlaid in blue on the X-ray panel, and in white on the optical panel. The white cross on the FUV panel marks the location of the unresolved radio source. The FUV colour bar can be scaled to a flux density by the inverse sensitivity 4.392 × 10⁻¹⁷ erg cm−2 Å−1 electron−1. The white box on the X-ray panel marks the FOV of the two rightmost panels. The bottom panel shows the same broad-band optical image in a different colour scale, a wider FOV, and with FUV contours shown in white. The nearby companions are labelled ‘D’ and ‘E’ to correspond to the notation used by McNamara et al. (2004) in their discussion of these companions as possible gas donors. The centroids of all panels are aligned, with east left and north up. MNRAS 451, 3768–3800 (2015) atSpaceTelescopeScienceInstituteonJuly9,2015http://mnras.oxfordjournals.org/Downloadedfrom
  • 25. 3792 G. R. Tremblay et al. Figure A3. The Abell 1664 BCG (z = 0.1283). The X-ray, FUV continuum, and broad-band optical unsharp mask images are shown in the left-hand, centre, and right-hand panels, respectively. Lyα contours are overlaid in black (on the X-ray panel) and green (on the FUV and optical panels). The radio source is unresolved. The FUV colour bar can be scaled to a flux density by the inverse sensitivity 4.392 × 10⁻¹⁷ erg cm−2 Å−1 electron−1. The centroids of all panels are aligned, with east left and north up. Figure A4. The Abell 1795 BCG (z = 0.0625). The X-ray, FUV continuum, and broad-band optical unsharp mask images are shown in the left-hand, centre, and right-hand panels, respectively. FUV contours are overlaid in blue and green on the X-ray and optical panels, respectively. The radio source is shown in white and black contours on the X-ray and FUV panels, respectively. Note the remarkable spatial correspondence between the FUV continuum emission and the radio source. The FUV colour bar can be scaled to a flux density by the inverse sensitivity 2.173 × 10⁻¹⁷ erg cm−2 Å−1 electron−1. The centroids of all panels are aligned, with east left and north up. MNRAS 451, 3768–3800 (2015) atSpaceTelescopeScienceInstituteonJuly9,2015http://mnras.oxfordjournals.org/Downloadedfrom
  • 26. FUV morphology of cool core BCGs 3793 Figure A5. The Abell 1835 BCG (z = 0.2532). The X-ray unsharp, FUV continuum, and broad-band optical unsharp mask images are shown in the left-hand, centre, and right-hand panels, respectively. Lyα contours are overlaid in blue on the X-ray panel and in green on the FUV and optical panels. The unresolved radio source is overlaid in black contours on the FUV panel. The FUV colour bar can be scaled to a flux density by the inverse sensitivity 1.360 × 10⁻¹⁶ erg cm−2 Å−1 electron−1. The centroids of all panels are aligned, with east left and north up. MNRAS 451, 3768–3800 (2015) atSpaceTelescopeScienceInstituteonJuly9,2015http://mnras.oxfordjournals.org/Downloadedfrom