SONEUK Conference on the Innovative Technologies and Practices for the development of Nepal 21st April 2018
•Als PPTX, PDF herunterladen•
0 gefällt mir•220 views

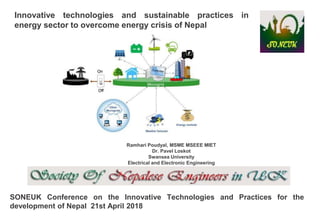
Innovative technologies and sustainable practices in the energy sector to overcome energy crisis of Nepal

Empfohlen
Empfohlen
Weitere ähnliche Inhalte
Was ist angesagt?
Was ist angesagt? (20)
Ähnlich wie SONEUK Conference on the Innovative Technologies and Practices for the development of Nepal 21st April 2018
Ähnlich wie SONEUK Conference on the Innovative Technologies and Practices for the development of Nepal 21st April 2018 (20)
Mehr von Dr Ramhari Poudyal
Mehr von Dr Ramhari Poudyal (12)
Kürzlich hochgeladen
Kürzlich hochgeladen (20)
SONEUK Conference on the Innovative Technologies and Practices for the development of Nepal 21st April 2018
- 1. SONEUK Conference on Infrastructure Development in Nepal, London, 18th Feb 2017 Innovative technologies and sustainable practices in energy sector to overcome energy crisis of Nepal Ramhari Poudyal, MSME MSEEE MIET Dr. Pavel Loskot Swansea University Electrical and Electronic Engineering SONEUK Conference on the Innovative Technologies and Practices for the development of Nepal 21st April 2018
- 2. The world is facing an enormous challenge to provide sufficient quantity of clean energy Over 1.1 billion people lack access to electricity according to IEA, 2017 2.8 billion people still cook with solid fuel IEA, 2017 More than 70% of global energy is consumed by a few developed nations and accounts for approximately 80% of greenhouse gas emissions Double the global rate of improvement in energy efficiency, and double the share of renewable energy in energy in the global energy mix by 2030. UN Secretary General’s initiation by 2030, grid extension will be 30% and 70 % will be mini grids or off grid system. Introduction
- 3. Nepal has been suffering from the chaotic energy crisis for about a decade. Hydropower projects have been delayed and cost / time overrun ½ year - 12 years About 6.6 million people of Nepal have no electricity However Nepal has huge potential for generating • 45,000 MW of hydro-electricity • 2,100 MW of solar power and • 3,000 MW of wind power Introduction
- 4. The electricity scenario of Nepal 2011-2017 Description FY 2011/12 FY 2012/13 FY 2013/14 FY 2014/15 FY 2015/16 FY 2015/16* FY 2016/17 Production (MW) 705.57 746 746 829.2 855.9 829.2 961.2 Transmission line (KM) 1,987.4 1,987.4 1,987.4 2,848.9 3,006 2,848.9 3,204 Customer numbers 2,053,259 2,599,152 2,713,804 2,872,015 2,969,576 2,922,041 3,121,902 Distribution line (KM) 958,156 114,160.4 116,066.6 123,827.8 124,115 123,827.8 124,976 Available energy (GWh) 3,858.4 4,260.5 3,092.5 4,966.7 5,077.2 4,966.7 3,964.2 Peak demand in (MW) 1,026 1,094 1,201 1,291.1 1,385 1,291.1 1,444.1 Demand supply Gap (MW) 320.4 348 455 461.9 529.1 461.9 482.9 India imports (GWh) 746.07 790.14 1,318.75 1,369.89 1,782.86 1,777.68 2,177.24 Source: Government of Nepal Ministry of Finance Nepal, Economic Survey, 2017.
- 5. The average daily and monthly imports of petroleum products, 2016) Energy sources FY 2014 – 2015 FY 2015 – 2016 Product (KL) Daily Avg. Monthly Avg. Daily Avg. Monthly Avg. Petrol 794.09 23,822.22 410.08 12,302.50 Diesel 2,553.00 76,590.08 1,270.80 38,124.00 Kerosene 55.01 1,650.42 23.75 712.58 Aviation fuel 394.82 11,644.67 131.94 3,958.17 Total excl. LPG 3,796.92 113,708.00 1,836.57 55,097.25 LPG MT 717.42 21,522.63 365.63 10,960.58 Source: Government of Nepal, Nepal Portfolio Performance Review (NPPR) 2015. According to NOC, last FY Import of Petroleum Product costs NPRs 150 billion , 20 billion in LPG, and 28 billion in Electricity Trade deficit with India was 491 billion NPR in 2016
- 6. Energy overview & Electricity Consumption Source: Government of Nepal Economic Survey 2015 The electricity consumption in different sectors Energy overview
- 7. Communication Spectrum of Nepal Source: Nepal Telecom 2015
- 8. Energy Crisis “An energy crisis is any great bottleneck (or price rise) in the supply of energy resources to an economy.” Wastage of energy Over Consumption Lack of proper storage system Major accidents & Natural calamities Poor distribution system Delay in commissioning power plants Political barrier obstruction on supply Poor Infrastructure Over Population Causes of Energy Crisis Energy policy and its robust implementation Green initiative & tax credit Improve energy infrastructure 10% Off–grid power generation locally to save T&D loss Conservation of energy 5% Energy Audit 5% Adaptation of Renewable Energy Technology 15% Energy Efficiency Measures 10% Solutions of energy crisis
- 9. Electricity Generation mix in the World 2017 38% 25% 23% 4% 10% Electricity Generation mix in the World 2017 Coal Renewable Gas Oil Nuclear Source: IEA, 2017
- 11. Energy Pyramid
- 12. Essential Technologies of Smart Cities Essential Technologi es of Smart Cities Smart Energy Smart Transport ation Smart Infrastructur e Smart Mobility Smart IOT Device Smart Data Rapid urbanization is leading to smarter cities that improve the lives of citizens through technology. Both residential and commercial buildings in smart cities are more efficient, using less energy Smart grids are part of the development of a smart city Smart streetlights are an easy entry point for many cities LED lights save money and pay for themselves within a few years, Smart energy response and Demand Side Management(DSM) and potential reduction opportunities
- 13. A smart meter is a new kind of electricity meter that can automatically send meter readings to the power supplier for billing and help consumers better understand their energy usage. Smart meter
- 14. prosumers i.e. the consumers who also produce and share surplus energy with grid and other users. Prosumers are not only an important stakeholder of the future smart grids but also have a vital role in peak demand management. According to the WEC, all energy providers should ensure a balance is achieved between the ‘Energy Trilemma’, including energy security, environmental sustainability and energy equity
- 16. - Weather monitoring using a weather station for transmission line in Malaysia. - Laser distance measurement sensor installation
- 17. Sustainability - New Market Territories
- 18. South Asia has among the highest economic growth rates in the world and represents a little over 7 percent of global carbon dioxide emissions. Six countries in the region -- Bangladesh, Bhutan, India, Maldives, Nepal and Sri Lanka -- have enormous untapped opportunities in climate-smart investing in sectors including renewable energy, transport, green buildings, urban wastewater, climate-smart agriculture, and municipal solid waste management.
- 19. electronic thermostats with programmable settings that control home temperature. Smart washing machines can sense the type and size of laundry load and adjust cycle time, water quantity and temperature accordingly. A home energy management system (HEMS) controls and records energy use through the gateway with user input via an app. In-home displays (IHDs) provide real-time household energy use data to consumers via an app or standalone display. Supervisory Control And Data Acquisition (SCADA) allowed the centralized monitoring and control of far-off generation and transmission systems.
- 20. Conclusion Priority on Innovate technology Emphasis on Energy Mix Increase Digital Connectivity (telecom, Broadband) Enhance Digital Platforms and solutions (e-government services, Cloud) More sustainable vision and appropriate action plans More focus on research and development (R&D) Smart meter and modern infrastructure Load Management for peak electricity demand savings due to load-shifting
Hinweis der Redaktion
- https://constructionreviewonline.com/2016/08/south-africa-eyes-diversified-energy-mix/ (Picture credit )
- https://constructionreviewonline.com/2016/08/south-africa-eyes-diversified-energy-mix/ (Picture credit ) 18 – 20 % every year LPG gas demand according to Nepal Oil Corporation 30,000 Metric ton / month LPG Gas Demand in Nepal
- https://constructionreviewonline.com/2016/08/south-africa-eyes-diversified-energy-mix/ (Picture credit )
- https://constructionreviewonline.com/2016/08/south-africa-eyes-diversified-energy-mix/ (Picture credit )
- Before going to the methodology, we need to understand why do we need the process? There are no cities with exactly the same context conditions.
- The outcome of this process is the successful implementation Reading’s traveller info apps – utilising the data in open data server