SlideShare ist ein Scribd-Unternehmen logo
1 von 103
Downloaden Sie, um offline zu lesen
ISSN 1813-3932
                                                                                            FOOD AND NUTRITION TECHNICAL REPORT SERIES
                                                                                                                                                                                                            F A O
                                                                                                                                                                                                                    1

Human energy requirements
Report of a Joint FAO/WHO/UNU Expert Consultation
Rome, 17–24 October 2001


                                                                                                                 Average
                                                                                                               requirement
       Percentage of individuals


                                                                                                   Energy


                                    (low)                                                                   Level of requirement                        (high)


                                                                                                                 Average
                                                                                                               requirement
                                                                                      1.0                                                           1.0
                                   Probability that stipulated intake is inadequate


                                                                                                                                                          Probability that stipulated intake is excessive
                                        for a randomly selected individual


                                                                                                                                                               for a randomly selected individual


                                                                                      0                                                             0
                                                                                            (low intake)    Usual level of intake   (high intake)
FOREWORD
Assessing the calorie and nutrient requirements of human beings, with the greatest possible degree of
accuracy, is one of the most important and central mandates of the Food and Agriculture Organization
of the United Nations (FAO). Since 1948, FAO has convened numerous expert groups in the field of
nutrition to collate, evaluate and interpret current scientific knowledge in order to derive estimates of
human energy requirements and use these estimates to provide recommendations to people and
policy-makers. The World Health Organization (WHO) began its collaboration with FAO on this
important work in the early 1950s, while the United Nations University (UNU) joined the initiative in
1981.
    This important publication is the final report of the most recent expert group meeting, the Joint
FAO/WHO/UNU Expert Consultation on Human Energy Requirements, convened in October 2001 at
FAO headquarters in Rome, Italy. The primary purpose of the expert meetings on nutrient
requirements has remained the same throughout the years: to give advice on scientific issues related to
food energy and nutrient requirements and to formulate recommendations for action. Various expert
groups have contributed principles for determining and applying general requirements, which have
been adopted worldwide.
    The global scientific community has continued to embrace the advice on requirements that was
first published by FAO alone and later in collaboration with WHO. The FAO/WHO recommendations
have reflected the state of knowledge at particular points in time, and have also influenced research
agendas and methodologies over the years. In fact, the FAO/WHO recommendations are currently
utilized in virtually all countries, and nutrient requirement reports are among the most frequently
referenced and most sought-after publications in both organizations.
    Estimates of human energy requirements are essential for assessing whether food supplies are
adequate to meet a population’s nutritional needs. Such estimates are also essential in assessing the
proportion and absolute number of undernourished people worldwide. The recommendations derived
from these estimates assist governments to monitor nutrition programmes and plan development
activities. The recommendations also help with the specific formulation of planning at the national
level for agricultural production, food supplies and the mobilization and distribution of emergency
food aid. FAO has an ongoing mandate to review these assessments periodically – particularly as new
research findings emerge – and to produce estimates using the highest possible degree of accuracy
based on recent scientific advances and developments in the field.
    FAO publishes this report on behalf of the three United Nations (UN) agencies (FAO/WHO/UNU)
that organized the consultation. We would like to express our gratitude to the members of the expert
consultation for their contribution to this important report, as well as to the numerous participants of
the working groups. The work of these groups preceded the expert consultation and served as the
foundation for discussions and exchange during the meeting. Thanks are also due to Dr E. Kennedy,
who very skilfully chaired the expert consultation, and to Dr B. Torun for his commitment to the role
of rapporteur and for his contribution to early drafts of this report.
    We thank all the participants, as well as the non-participating experts who drafted background
papers as part of the preparatory process for the expert consultation. These background papers will be
published in a special issue of Public Health Nutrition in 2005, thereby providing a more detailed
peer-reviewed literature source for many of the ongoing debates on the various topics discussed
during the consultation. We would also like to express our special gratitude to the FAO staff members
who constituted the Secretariat and completed much of the follow-up work that culminated in this
report, in particular the staff of the Nutrition Planning and Evaluation Service (ESNA), P. Shetty, R.
Weisell, and B. Burlingame, as well as G. Kennedy, F. Martinez Nocito, T. Ballard and J. Shaw who
assisted as consultants both during and after the expert consultation.

Kraisid Tontisirin                                                Hartwig de Haen
Director                                                          Assistant Director-General
Food and Nutrition Division                                       Economic and Social Department


                                                                                                      iii
CONTENTS
FOREWORD                                                                              iii

PREFACE                                                                               vii

1. INTRODUCTION                                                                        1
   1.1 What is new in this report?                                                     1
   1.2 Intended use of this report                                                     2
   1.3 Policy implications                                                             2
   References                                                                          3

2. PRINCIPLES AND DEFINITIONS                                                          4
   2.1 Definitions                                                                     4
   2.2 Sources of dietary energy                                                       6
   2.3 Components of energy requirements                                               7
   2.4 Calculation of energy requirements                                              7
   2.5 Recommendations for physical activity                                           9
   2.6 Glossary and abbreviations                                                      9
   References                                                                         10

3. ENERGY REQUIREMENTS OF INFANTS FROM BIRTH TO 12 MONTHS                             11
   3.1 Measurement of total energy expenditure                                        11
   3.2 Equations to predict energy expenditure                                        11
   3.3 Energy needs for growth                                                        13
   3.4 Calculation of energy requirements                                             15
   3.5 Catch-up growth                                                                17
   References                                                                         18

4. ENERGY REQUIREMENTS OF CHILDREN AND ADOLESCENTS                                    20
   4.1 Measurement of total energy expenditure                                        20
   4.2 Equations to predict total energy expenditure                                  20
   4.3 Energy needs for growth                                                        21
   4.4 Calculation of energy requirements                                             21
   4.5 Recommendations for regular physical activity                                  24
   4.6 Infections and mild malnutrition                                               31
   References                                                                         32

5. ENERGY REQUIREMENTS OF ADULTS                                                      35
   5.1 Factorial estimation of total energy expenditure and physical activity level   35
   5.2 Estimation of basal metabolic rate                                             35
   5.3 Physical activity level                                                        37
   5.4 Energy requirements and dietary energy recommendations                         39
   5.5 Older adults and the elderly                                                   47
   5.6 Recommendations for regular physical activity                                  49
   References                                                                         50

6. ENERGY REQUIREMENTS OF PREGNANCY                                                   53
   6.1 Gestational weight gain and optimal pregnancy outcome                          53
   6.2 Determinants of the energy cost of pregnancy                                   54
   6.3 Calculation of energy requirements for pregnancy                               56
   6.4 Special considerations for malnourished, obese and adolescent pregnant women   60
   References                                                                         61


                                                                                       v
7. ENERGY REQUIREMENTS OF LACTATION                                                         63
   7.1 Determinants of the energy cost of lactation                                         63
   7.2 Energy requirements for lactation                                                    65
   References                                                                               66

8. RECOMMENDATIONS FOR FUTURE RESEARCH                                                      67
   8.1 Biological questions: conceptual and methodological                                  67
   8.2 Epidemiological and community studies                                                69

9. CONCLUSIONS                                                                              71
   References                                                                               73

ANNEXES                                                                                     75
  1: Participants – 2001 Joint FAO/WHO/UNU Expert Consultation on Human Energy
  Requirements                                                                              77
  2: Authors and reviewers of papers for expert consultation working groups, meetings and
  follow-up                                                                                 84
  3: Update on predictive equations to estimate basal metabolic rate                        87
  4: Software application for calculating populations’ energy requirements and food needs   89
  5: Energy costs of activities                                                             92


vi
PREFACE
The purpose of the expert consultations on human energy requirements convened by FAO, WHO and,
more recently, UNU is to advise the Directors-General on scientific issues related to food energy,
including requirements, so that appropriate recommendations for action can be formulated. It is hence
important that during the process of determining energy requirements the question of “requirements
for what?” be constantly borne in mind. While biological scientists are generally concerned with the
physiological basis of estimating requirements, it is also necessary to be aware of the practical
applications of these recommendations for estimating the energy requirements and food needs of
populations worldwide.
    The principal objective of expert consultations on human energy requirements is to provide
international agencies and their member countries with the necessary tools for addressing practical
questions, such as assessing the adequacy of food supplies and the numbers of people who do not
attain energy adequacy, drawing up targets for food production and informing national food and
nutrition policy and planning. The recommendations and guidelines that result from these
consultations will serve to enable governments and organizations to plan, monitor and evaluate
nutrition programmes and policies better. They will also help Member Nations to develop estimates of
requirements appropriate for local conditions and for direct application in their countries. It is
important to remember that while developed countries are able to constitute their own committees of
experts who can make recommendations on energy and nutrient requirements for their populations,
the majority of humanity in the developing world relies largely on UN agencies such as FAO. Hence,
the development of pragmatic recommendations by expert committees convened by UN agencies,
which are based on sound scientific evidence and have practical relevance to the conditions prevailing
in the developing world, is paramount.
    The entire process leading up to the convening of an expert group and the resulting consultation is
highly formalized and follows a number of required protocols. For the first time, FAO adopted a two-
stage process, which started with convening working groups in those areas where it believed that new
scientific knowledge existed that might influence the current recommendations for energy needs. The
second stage of the process was the expert consultation itself. The rationale behind convening the
working groups was that many of the scientific questions could be dealt with by experts in the areas
concerned, even though the participation of those experts at the consultation per se was uncertain
owing to the need to provide a globally representative consultative panel. Working groups would also
facilitate discussions, as any contentious issues could be debated and settled before the expert
meeting, which would benefit from the results of such discussions. Accordingly, working groups met
from 27 June to 5 July 2001 at FAO headquarters in Rome, several months before the expert meeting
in October 2001. Three of the working groups focused primarily on energy requirements throughout
the life cycle and related to two important sub-populations – infants and children, and pregnant and
lactating women – for which substantial scientific advances had been made. These working groups
were on: 1) energy (and protein) requirements of infants and preschool children; 2) energy (and
protein) requirements of pregnancy and lactation; and 3) analytical issues in food energy and
composition: energy in food labelling, including regulatory and trade issues, which looked at food
energy values. An additional working group was constituted to provide documentation on
methodologies for energy balance and energy requirements, but it was felt that – given the nature of
the task – there was no need for this group to meet, although their background documents were
available to the expert consultation. The chairpersons of all the working groups on energy were
invited to the expert consultation to present a summary of the deliberations and recommendations of
their groups and to advise the experts. Background papers were commissioned, peer-reviewed and
made available to both the pre-consultation working groups and the experts who met for the
consultation. The entire process of pre-consultation activities and the consultation itself went
smoothly, despite a few hitches that were largely the result of the unhappy events of 11 September
2001, which prevented some of the invited experts from coming to Rome to join the consultative
process. Lists of the participants in the various working group sessions, and those invited as experts to
the consultation are included as Annex 1 of this report. Annex 2 provides details of the authors and


                                                                                                      vii
reviewers of the background documents, which are expected to be published shortly as a supplement
to the journal Public Health Nutrition. The wide availability of this publication as a peer-reviewed
journal supplement is expected to provide the academic community with an opportunity to examine
the collated evidence base that informed the expert panel and influenced their latest recommendations.
    As part of the second stage of the process, the members of the expert consultation met in FAO
headquarters in Rome from 17 to 21 October 2001. The meeting was chaired by Dr E. Kennedy, with
Dr B. Torun serving as rapporteur. The following are the specific tasks outlined in the charge given to
this expert consultation on human energy requirements:

       1. To review the background documents on the state of the art of the scientific literature in this
          area of work, assembling the best evidence on the topic and using, where appropriate, the
          summary, advice and recommendations arising from the deliberations of the working groups
          that had met earlier in the year.
       2. To deliberate on and arrive at recommendations for energy requirements throughout the life
          cycle, while clearly outlining the approaches used to estimate requirements that may be of
          benefit to users. This included taking into account physiological states such as growth,
          pregnancy and lactation and, where relevant, pathological conditions and the additional needs
          during infections. The recommendations were expected to be reached by consensus, and
          where differences persisted the reasons for those differences were to be clearly outlined, with
          all sides presented and appropriately reflected in the report of the expert consultation.
       3. To examine the feasibility of arriving at minimum requirements that may be of use in
          estimating the numbers of individuals in populations who are unable to meet energy
          adequacy.
       4. To comment on the consequences of deficit and excess of energy, and to recommend ways by
          which the health, social and economic consequences of these can be minimized or avoided.
       5. To highlight the main changes to the recommendations of the 1985 report, with particular
          emphasis on those aspects of the new recommendations that have a significant impact on the
          way in which nutritional adequacy of population groups is assessed by those involved in
          policy, planning or analysis of the nutritional status of populations.
       6. To suggest areas where further research is needed, either to deal with gaps in the knowledge
          related to energy requirements in specific groups or situations, or to facilitate the collection of
          normative data that will aid the process of arriving at future recommendations for energy
          requirements.

   It was the sincere desire of the FAO Secretariat to ensure that the report of the expert consultation
on human energy requirements be available within the shortest possible period after the experts met in
Rome. The two-year gap before the interim report was available as a downloadable file on the FAO
Web site, and a further period before it was available in hard copy were due to a series of post-
consultation activities that were deemed essential before the release of the final report. Many of these
post-consultation activities were in response to, and out of respect for, the experts who recommended
a number of important pieces of work to be followed-up and completed for inclusion in the report.
   An important recommendation of the expert group was to update and review the predictive
equations for estimating basal metabolic rate (BMR) and to incorporate the updated equations into the
new recommendations. These activities proved to be time-consuming, as they involved updating the
global database on BMRs that was originally obtained for the 1985 report, reanalysing it with
particular emphasis on looking at the influence of methodological biases and ethnic variations, and
developing new BMR predictive equations with better predictive performance for international use
(Annex 3). The reanalysis was followed by an exercise to test the validity of the new equations, and a
further consultation with a sub-group of the expert panel for their final decision. However, after this
long exercise the experts concluded that the international equations hitherto used continued to have
enhanced precision and robustness. Following reanalysis of the global database, the recommendation
to use a seamless single predictive BMR equation was not considered practical, and hence the expert
consultation was not persuaded to replace the international equations provided in the 1985 report.
These predictive equations have been widely used and are popular with the scientific community and
nutritional planners, and the present report’s recommendation is to continue using them.


viii
One of the other recommendations that arose from the deliberations of the working group on
analytical issues in food energy and composition, which was subsequently endorsed by the experts,
was to convene a meeting to deliberate on food energy values. The objective was to ensure harmony
between the expected adoption of new energy requirement values from this consultation, which are
based solely on energy expenditure measurements or estimates, and energy requirements based on
food intake measurements alone. FAO thus convened a Technical Workshop on Food Energy –
Methods of Analysis and Conversion Factors, which was held in Rome from 3 to 6 December 2002.
The report of this workshop was published as FAO Food and Nutrition Paper No. 77 in 2003, which
complements the present report.
    As part of the post-consultation activities in preparation for the release of the expert report, it was
decided to produce an updated, Windows-compatible and user-friendly software application for the
purpose of calculating population energy requirements and food needs. After the 1981 joint expert
consultation report was released (WHO, 1985), FAO sponsored the development of a manual and
software package (James and Schofield, 1990), recognizing that less attention had hitherto been paid
to the matter of how to apply the requirements to practical food and nutrition planning. The success of
this 1990 user’s manual, which was sponsored by FAO and published by Oxford University Press,
was constrained because it was a priced publication that was available separately from the 1985 joint
expert report. For the 2001 consultation, it was decided to make the new software widely and readily
available by releasing it alongside the report. FAO therefore had to find an organization that would
assist us in developing such a product to be released at the same time as the expert report in 2004.
Early discussions were conducted with the United States Centers for Disease Control and Prevention
(CDC) in Atlanta, Georgia, with the objective of developing the software and making it available as a
downloadable version alongside CDC’s popular EpiNut software. However, CDC was unable to
collaborate in this venture, so other partners had to be sought. The Division of Nutrition, Institute of
Population Health and Clinical Research at Bangalore, India and its Dean, Dr A. Kurpad, identified
Jenesys Technologies, a software applications firm in India, which collaborated alongside the institute
in the development of the software package and accompanying manual (Annex 4). This is now
available on CD-ROM. For the first time, the software package is being issued together with the
expert report in order to ensure that those interested in the report’s recommendations have the means
to investigate and ensure their practical applicability, as well as to benefit from the two outputs’
complementarity. The user’s manual and software application for calculating population energy
requirements and food needs thus represent a further milestone in FAO’s continued involvement in
both the theoretical and the practical issues related to human energy requirements.
    This expert consultation was convened nearly two decades after the last expert group met to
deliberate on energy and protein requirements in 1981. In the interim, the International Dietary
Energy Consultancy Group (IDECG), sponsored jointly by UNU and the International Union of
Nutritional Sciences (IUNS), filled the lacuna by convening meetings to discuss important
developments in this area. The IDECG meeting in London in 1994 on Energy and Protein
Requirements (whose proceedings were published in European Journal of Clinical Nutrition Vol. 50,
Supplement 1 in February 1996) was a seminal meeting that provided much of the preparatory
background for this expert consultation. We would like to acknowledge and pay our tribute to the late,
Dr Beat Schurch who, as Executive Secretary of IDECG, was the quiet engine behind this invaluable
contribution to the advancement and dissemination of nutrition knowledge. FAO and WHO benefited
greatly from IDECG’s work and publications, in particular its review of human energy and protein
requirements in 1994. While FAO was organizing the 2001 expert consultation, Beat Schurch knew
that he was sick but planned to attend both the consultation and the working groups that preceded it.
Unfortunately, his illness progressed more quickly than had been anticipated, and he had to decline
the invitation. He approached his illness and its culmination with the same equanimity with which he
approached most matters and wished the group well. His contribution and friendship will be sorely
missed.

                                                                                     Prakash Shetty
                                                                                               Chief
                                         Nutrition Planning, Assessment & Evaluation Service (ESNA)
                                                                           Food & Nutrition Division


                                                                                                        ix
Introduction


1. INTRODUCTION
Since 1949, the Food and Agriculture Organization of the United Nations (FAO) and, since the early
1950s, the World Health Organization (WHO) have convened groups of experts to evaluate current
scientific knowledge in order to define the energy requirements of humans and propose dietary energy
recommendations for populations. The purpose of this information is to assist FAO and WHO in
implementing their programmes. The United Nations University (UNU) became part of this joint
initiative in 1981. The reports of these expert meetings (see the list of References at the end of this
chapter) have become important guidelines on energy in human nutrition for academic scientists,
nutritionists, physicians and other health workers, as well as for planners and policy-makers in both
the agriculture and health sectors throughout the world.
    New scientific knowledge generated in the 20 years since the last expert consultation was held
prompted FAO, WHO and UNU to assemble a new expert consultation to make recommendations for
energy requirements of populations throughout the life cycle (WHO, 1985). This consultation took
place from 17 to 24 October 2001 at FAO headquarters in Rome. Its mandate was to revise and update
the conclusions and recommendations of the preceding consultation, which was convened in 1981 and
whose report was published in 1985. In preparation for the forthcoming expert consultation, well-
known scientists with demonstrated expertise in this area of work were asked to examine and write
background papers on various topics that required revision and updating. Several of the authors and
other leading scientists constituted working groups that met in Rome in June 2001 to discuss and
analyse critically the contents of the background papers, which were subsequently modified following
the working group suggestions. The modified papers, the working groups’ conclusions and other
relevant documents were provided to all members of the expert consultation for analysis and
consideration in their deliberations.1
    Dr Eileen Kennedy was elected to chair this expert consultation, and Dr Benjamin Torun to be the
rapporteur. Several conclusions and recommendations were the immediate results, while a number of
topics were identified as requiring further research and analysis before the experts could finalize their
recommendations. The rapporteur and other members of the consultation were given the task of
pursuing the pending issues with assistance from the FAO Secretariat, and additional working papers
were commissioned. This laborious task went on until the end of 2003, when almost all questions had
been answered and gaps filled and the rapporteur was able to prepare the final draft for examination
and approval by the other experts from the consultation. This report is the final result of those efforts.

1.1 WHAT IS NEW IN THIS REPORT?
Although the basic principles set forth in previous expert meetings have withstood the test of time,
several modifications are proposed in this report. Members of the expert consultation and participants
in the working groups recognize and accept the responsibility for proposing these modifications, and
for the implications that they will have on health, agriculture, the food industry, economic planning,
international aid and social programmes related to food and nutrition. It is their belief that the
conclusions and recommendations in this report are well grounded, given the current state of the best
scientific knowledge. A critical appraisal of their application will be the final proof of their accuracy,
applicability and appropriateness.

    The new concepts and recommendations set forth in this report include:

         calculation of energy requirements for all ages, based on measurements and estimates of total
     daily energy expenditure and on energy needs for growth, pregnancy and lactation;
         in the light of new data, modification of the requirements and dietary energy
     recommendations for infants and for older children and adolescents, in order to correct previous
     overestimations for the former and underestimations for the latter;

1
 Annex 1 gives the names of participants in the working groups and expert consultation. Annex 2 lists the titles
and authors of the background documents.


                                                                                                               1
Human energy requirements: Report of a Joint FAO/WHO/UNU Expert Consultation


        proposals for differentiating the requirements for populations with lifestyles that involve
    different levels of habitual physical activity, starting as early as six years of age;
        reassessment of energy requirements for adults, based on energy expenditure estimates
    expressed as multiples of basal metabolic rates;
        classification of physical activity levels based on the degree of habitual activity that is
    consistent with long-term good health and maintenance of a healthy body weight;
        recommendations for physical activity for children and adults to maintain fitness and health
    and to reduce the risk of developing obesity and co-morbid diseases associated with a sedentary
    lifestyle;
        an experimental approach for factorial estimates of energy needs during pregnancy and
    lactation;
        distribution in the two last trimesters of pregnancy of the recommendations for additional
    dietary energy needs.

1.2 INTENDED USE OF THIS REPORT
This report is briefer and less detailed than the reports of previous expert meetings and consultations.
The commissioned background papers, which will be published in a peer-reviewed journal,
complement the report with details on the sources, analysis and interpretation of the scientific
information. In addition to a printed version, the report will be placed on the Internet for wider access
and faster diffusion.
   This report is not meant merely to describe the energy expenditures and requirements of
population groups. It intends to be prescriptive, in order to support and maintain health and good
nutrition. The recommendations, however, are meant for well-nourished and healthy populations, as
the correction of malnutrition – either deficit or excess – involves different energy requirements and
dietary recommendations. The report is not meant to be prescriptive for individual subjects, some of
whom may be at either extreme of a normal distribution. Although estimates of requirements are
derived from measurements of individuals with specific characteristics such as age, gender, body size,
presumed body composition and physical activity, the data have been pooled to give the average
energy requirements of groups or classes of individuals who have similar characteristics, but on
whom measurements have not been made. Consequently, application of these results to any one
individual for clinical or other purposes may lead to errors of diagnosis and improper management.

1.3 POLICY IMPLICATIONS
A science-based definition of human energy requirements is crucial for the control and prevention of
undernutrition due to insufficient intake of food energy, which remains a major problem for many
countries. It is also essential to efforts to curb the excessive intake of food energy that is a major
determinant of nutrition-related chronic diseases, at present an important cause of worldwide
morbidity and mortality among adults.
    Insufficient food energy intake is almost always accompanied by a deficient intake of most
nutrients. Awareness of the consequences of insufficient energy intakes in children and adults has
influenced health and food and agriculture policies around the world. More recently, the consequences
of increasing obesity and nutrition-related chronic diseases have also been recognized as major factors
for the health, food and agriculture sectors. These problems are increasing globally as a result of
changes in diets and lifestyles that are reflected in changing food cultures and physical activity
patterns among all segments of society, and not only among affluent groups or in the richest countries.
Undernutrition early in life, followed by an inappropriate diet and low physical activity in childhood
and adult life increases vulnerability to chronic non-communicable diseases. Low-income groups in
urban areas are especially vulnerable to the risk of obesity owing to a positive energy balance. The
current increased incidence of overweight and obesity among children and adults in most countries
leads to rapidly rising projections of disability and premature death to nutrition-related chronic
diseases.
    Prevention is the only feasible approach to control the double burden of under- and overnutrition.
The cost of treating and managing the ensuing disabilities and diseases imposes an intolerable
economic and health burden, especially for poorer countries. As inappropriate dietary intake and lack


2
Introduction


of physical activity are the main causes of nutritional problems, there is an urgent need for
governments, in partnership with all relevant stakeholders, to integrate strategies that promote healthy
diets and regular physical activity in all relevant policies and programmes, including those designed to
fight undernutrition. Both undernutrition and obesity are preventable, as has been demonstrated by
countries with successful programmes. In addition to health promotion, nutrition education and
relevant agricultural and food policies, effective food and nutrition programmes must include
community action to overcome the environmental, social and economic constraints that limit the
improvement of access to food, and to promote better dietary quality and life style practices that
encourage a physically active life.

REFERENCES
FAO. 1950. Calorie requirements: Report of the Committee on Calorie Requirements. FAO Nutritional Studies
No. 5. Rome.
FAO. 1957. Calorie requirements: Report of the Second Committee on Calorie Requirements. FAO Nutritional
Studies No. 15. Rome.
FAO/WHO. 1973. Energy and protein requirements: Report of a joint FAO/WHO ad hoc expert committee.
FAO Nutrition Meetings Report Series No. 52. WHO Technical Report Series No. 522. Rome and Geneva.
WHO. 1985. Energy and protein requirements: Report of a joint FAO/WHO/UNU expert consultation. WHO
Technical Report Series No. 724. Geneva.


                                                                                                        3
Human energy requirements: Report of a Joint FAO/WHO/UNU Expert Consultation


2. PRINCIPLES AND DEFINITIONS
Human energy requirements are estimated from measures of energy expenditure plus the additional
energy needs for growth, pregnancy and lactation. Recommendations for dietary energy intake from
food must satisfy these requirements for the attainment and maintenance of optimal health,
physiological function and well-being. The latter (i.e. well-being) depends not only on health, but also
on the ability to satisfy the demands imposed by society and the environment, as well as all the other
energy-demanding activities that fulfil individual needs.
    Energy balance is achieved when input (i.e. dietary energy intake) is equal to output (i.e. total
energy expenditure), plus the energy cost of growth in childhood and pregnancy, or the energy cost to
produce milk during lactation. When energy balance is maintained over a prolonged period, an
individual is considered to be in a steady state. This can include short periods during which the day-
to-day balance between intake and expenditure does not occur. An optimal steady state is achieved
when energy intake compensates for total energy expenditure and allows for adequate growth in
children, and pregnancy and lactation in women, without imposing metabolic, physiological or
behavioural restrictions that limit the full expression of a person’s biological, social and economic
potential.
    Within certain limits, humans can adapt to transient or enduring changes in energy intake through
possible physiological and behavioural responses related to energy expenditure and/or changes in
growth. Energy balance is maintained, and a new steady state is then achieved. However, adjustments
to low or high energy intakes may sometimes entail biological and behavioural penalties, such as
reduced growth velocity, loss of lean body mass, excessive accumulation of body fat, increased risk of
disease, forced rest periods, and physical or social limitations in performing certain activities and
tasks. Some of these adjustments are important and may even increase the chances of survival in times
of food scarcity.

2.1 DEFINITIONS
An adequate, healthy diet must satisfy human needs for energy and all essential nutrients.
Furthermore, dietary energy needs and recommendations cannot be considered in isolation of other
nutrients in the diet, as the lack of one will influence the others. Thus, the following definitions are
based on the assumption that requirements for energy will be fulfilled through the consumption of a
diet that satisfies all nutrient needs.

Energy requirement is the amount of food energy needed to balance energy expenditure in order to
maintain body size, body composition and a level of necessary and desirable physical activity
consistent with long-term good health. This includes the energy needed for the optimal growth and
development of children, for the deposition of tissues during pregnancy, and for the secretion of milk
during lactation consistent with the good health of mother and child.

The recommended level of dietary energy intake for a population group is the mean energy
requirement of the healthy, well-nourished individuals who constitute that group.

   Based on these definitions, a main objective for the assessment of energy requirements is the
prescription of dietary energy intakes that are compatible with long-term good health. Therefore, the
levels of energy intake recommended by this expert consultation are based on estimates of the
requirements of healthy, well-nourished individuals. It is recognized that some populations have
particular public health characteristics that are part of their usual, “normal” life. Foremost among
these are population groups in many developing countries where there are numerous infants and
children who suffer from mild to moderate degrees of malnutrition and who experience frequent
episodes of infectious diseases, mostly diarrhoeal and respiratory infections. Special considerations
are made in this report for such sub-populations.


4
2.1.1 Daily energy requirements and daily energy intakes
Energy requirements and recommended levels of intake are often referred to as daily requirements or
recommended daily intakes. These terms are used as a matter of convention and convenience,
indicating that the requirement represents an average of energy needs over a certain number of days,
and that the recommended energy intake is the amount of energy that should be ingested as a daily
average over a certain period of time. There is no implication that exactly this amount of energy must
be consumed every day, nor that the requirement and recommended intake are constant, day after day.
Neither is there any biological basis for defining the number of days over which the requirement or
intake must be averaged. As a matter of convenience, taking into account that physical activity and
eating habits may vary on some days of the week, periods of seven days are often used when
estimating the average daily energy expenditure and recommended daily intake.

2.1.2 Average requirement and inter-individual variation
Estimates of energy requirements are derived from measurements of individuals. Measurements of a
collection of individuals of the same gender and similar age, body size and physical activity are
grouped together to give the average energy requirement – or recommended level of dietary intake –
for a class of people or a population group. These requirements are then used to predict the
requirements and recommended levels of energy intake for other individuals with similar
characteristics, but on whom measurements have not been made. Although individuals in a given
class have been matched for characteristics that may affect requirements, such as gender, age, body
size, body composition and lifestyle, there remain unknown factors that produce variations among
individuals. Consequently, there is a distribution of requirements within the class or population group
(WHO, 1985) (Figure 2.1).

FIGURE 2.1
Distribution of energy requirements of a population group or class of individuals*


* It is assumed that individual requirements are randomly distributed about the mean requirement for the class of individuals,
and that the distribution is Gaussian.
Source. WHO, 1985.


   For most specific nutrients, a certain excess of intake will not be harmful. Thus, when dietary
recommendations are calculated for these nutrients, the variation among individuals in a class or
population group is taken into account, and the recommended level of intake is an amount that will
meet or exceed the requirements of practically all individuals in the group. For example, the


      5
Human energy requirements: Report of a Joint FAO/WHO/UNU Expert Consultation 66


recommended safe level of intake for proteins is the average requirement of the population group,
plus 2 standard deviations. This approach cannot be applied to dietary energy recommendations,
because intakes that exceed requirements will produce a positive balance, which may lead to
overweight and obesity in the long term. A high level of energy intake that assures a low probability
of energy deficiency for most people (e.g. the average requirement plus 2 standard deviations) also
implies a high probability of obesity for most people owing to a dietary energy excess (Figure 2.2).
Therefore, in agreement with earlier reports, this expert consultation concluded that the descriptor of
the dietary energy intake that could be safely recommended for a population group is the estimated
average energy requirement of that group.

FIGURE 2.2
Probability that a particular energy intake is inadequate or excessive for an individual*


* Individuals are randomly selected among a class of people or a population group. The two probability curves overlap, so the
level of energy intake that assures a low probability of dietary energy deficiency is the same level that implies a high probability
of obesity owing to dietary energy excess.
Source: WHO, 1985.


2.2 SOURCES OF DIETARY ENERGY
Energy for the metabolic and physiological functions of humans is derived from the chemical energy
bound in food and its macronutrient constituents, i.e. carbohydrates, fats, proteins and ethanol, which
act as substrates or fuels. After food is ingested, its chemical energy is released and converted into
thermic, mechanical and other forms of energy.
   This report refers to energy requirements that must be satisfied with an adequately balanced diet,
and does not make specific recommendations for carbohydrates, fats or proteins. Reports from other
FAO and WHO expert groups address those topics. Nevertheless, it should be noted that fats and
carbohydrates are the main sources of dietary energy, although proteins also provide important
amounts of energy, especially when total dietary energy intake is limited. Ethanol is not considered
part of a food system, but its contribution to total energy intake cannot be overlooked, particularly
among populations that regularly consume alcoholic beverages. Allowing for the mean intestinal
absorption, and for the nitrogenous portion of proteins that cannot be completely oxidized, the
average values of metabolizable energy provided by substrates in a mixed diet are 16.7 kJ (4 kcal) per


6
Principles and definitions


substrates determined by chemical analysis, or estimated from appropriate food composition tables. A
recent related report from a FAO technical workshop provides more information on this topic (FAO,
2003).

2.3 COMPONENTS OF ENERGY REQUIREMENTS
Human beings need energy for the following:

        Basal metabolism. This comprises a series of functions that are essential for life, such as cell
    function and replacement; the synthesis, secretion and metabolism of enzymes and hormones to
    transport proteins and other substances and molecules; the maintenance of body temperature;
    uninterrupted work of cardiac and respiratory muscles; and brain function. The amount of energy
    used for basal metabolism in a period of time is called the basal metabolic rate (BMR), and is
    measured under standard conditions that include being awake in the supine position after ten to
    12 hours of fasting and eight hours of physical rest, and being in a state of mental relaxation in an
    ambient environmental temperature that does not elicit heat-generating or heat-dissipating
    processes. Depending on age and lifestyle, BMR represents 45 to 70 percent of daily total energy
    expenditure, and it is determined mainly by the individual’s age, gender, body size and body
    composition.
        Metabolic response to food. Eating requires energy for the ingestion and digestion of food,
    and for the absorption, transport, interconversion, oxidation and deposition of nutrients. These
    metabolic processes increase heat production and oxygen consumption, and are known by terms
    such as dietary-induced thermogenesis, specific dynamic action of food and thermic effect of
    feeding. The metabolic response to food increases total energy expenditure by about 10 percent of
    the BMR over a 24-hour period in individuals eating a mixed diet.
        Physical activity. This is the most variable and, after BMR, the second largest component of
    daily energy expenditure. Humans perform obligatory and discretionary physical activities.
    Obligatory activities can seldom be avoided within a given setting, and they are imposed on the
    individual by economic, cultural or societal demands. The term “obligatory” is more
    comprehensive than the term “occupational” that was used in the 1985 report (WHO, 1985)
    because, in addition to occupational work, obligatory activities include daily activities such as
    going to school, tending to the home and family and other demands made on children and adults
    by their economic, social and cultural environment.
        Discretionary activities, although not socially or economically essential, are important for
    health, well-being and a good quality of life in general. They include the regular practice of
    physical activity for fitness and health; the performance of optional household tasks that may
    contribute to family comfort and well-being; and the engagement in individually and socially
    desirable activities for personal enjoyment, social interaction and community development.
        Growth. The energy cost of growth has two components: 1) the energy needed to synthesize
    growing tissues; and 2) the energy deposited in those tissues. The energy cost of growth is about
    35 percent of total energy requirement during the first three months of age, falls rapidly to about
    5 percent at 12 months and about 3 percent in the second year, remains at 1 to 2 percent until
    mid-adolescence, and is negligible in the late teens.
        Pregnancy. During pregnancy, extra energy is needed for the growth of the foetus, placenta
    and various maternal tissues, such as in the uterus, breasts and fat stores, as well as for changes in
    maternal metabolism and the increase in maternal effort at rest and during physical activity.
        Lactation. The energy cost of lactation has two components: 1) the energy content of the milk
    secreted; and 2) the energy required to produce that milk. Well-nourished lactating women can
    derive part of this additional requirement from body fat stores accumulated during pregnancy.

2.4 CALCULATION OF ENERGY REQUIREMENTS
The total energy expenditure of free-living persons can be measured using the doubly labelled water
technique (DLW) or other methods that give comparable results. Among these, individually calibrated
heart rate monitoring has been successfully validated. Using these methods, measurements of total
energy expenditure over a 24-hour period include the metabolic response to food and the energy cost


                                                                                                        7
Human energy requirements: Report of a Joint FAO/WHO/UNU Expert Consultation


of tissue synthesis. For adults, this is equivalent to daily energy requirements. Additional energy for
deposition in growing tissues is needed to determine energy requirements in infancy, childhood,
adolescence and during pregnancy, and for the production and secretion of milk during lactation. It
can be estimated from calculations of growth (or weight gain) velocity and the composition of weight
gain, and from the average volume and composition of breastmilk.

2.4.1 Factorial estimates of total energy expenditure
When experimental data on total energy expenditure are not available, it can be estimated by factorial
calculations based on the time allocated to activities that are performed habitually and the energy cost
of those activities. Factorial calculations combine two or more components or “factors”, such as the
sum of the energy spent while sleeping, resting, working, doing social or discretionary household
activities, and in leisure. Energy spent in each of these components may in turn be calculated by
knowing the time allocated to each activity, and its corresponding energy cost.
   As discussed in the following sections of this report, the experimental measurement of total energy
expenditure and the assessment of growth and tissue composition allow sound predictions to be made
regarding energy requirements and dietary recommendations for infants and older children around the
world. Special considerations and additional calculations assist the formulation of recommendations
for children and adolescents with diverse lifestyles.
   Total energy expenditure has also been measured in groups of adults, but this has been primarily in
industrialized countries. Variations in body size, body composition and habitual physical activity
among populations of different geographical, cultural and economic backgrounds make it difficult to
apply the published results on a worldwide basis. Thus, in order to account for differences in body
size and composition, energy requirements were initially calculated as multiples of BMR. They were
then converted into energy units using a known BMR value for the population, or the mean BMR
calculated from the population’s mean body weight. To account for differences in the characteristic
physical activity of the associated lifestyles, energy requirements of adults were estimated by factorial
calculations that took into account the times allocated to activities demanding different levels of
physical effort.
   The extra needs for pregnancy and lactation were also calculated using factorial estimates for the
growth of maternal and foetal tissues, the metabolic changes associated with pregnancy and the
synthesis and secretion of milk during lactation.

2.4.2 Expression of requirements and recommendations
Measurements of energy expenditure and energy requirement recommendations are expressed in units
of energy (joules, J), in accordance with the international system of units. Because many people are
still used to the customary usage of thermochemical energy units (kilocalories, kcal), both are used in
this report, with kilojoules given first and kilocalories second, within parenthesis and in a different
font (Arial 9). In tables, values for kilocalories are given in italic type.2
    Gender, age and body weight are the main determinants of total energy expenditure. Thus, energy
requirements are presented separately for each gender and various age groups, and are expressed both
as energy units per day and energy per kilogram of body weight. As body size and composition also
influence energy expenditure, and are closely related to basal metabolism, requirements are also
expressed as multiples of BMR.


2
 1 joule (J) is the amount of mechanical energy required to displace a mass of 1 kg through a distance of 1 m
with an acceleration of 1 m per second (1 J = 1 kg × 1 m2 × 1 sec-2). Multiples of 1 000 (kilojoules, kJ) or 1
million (megajoules, MJ) are used in human nutrition. The conversion factors between joules and calories are: 1
kcal = 4.184 kJ, or conversely, 1 kJ = 0.239 kcal.


8
Principles and definitions


2.5 RECOMMENDATIONS FOR PHYSICAL ACTIVITY
A certain amount of activity must be performed regularly in order to maintain overall health and
fitness,3 to achieve energy balance and to reduce the risk of developing obesity and associated
diseases, most of which are associated with a sedentary lifestyle. This expert consultation therefore
endorsed the proposition that recommendations for dietary energy intake must be accompanied by
recommendations for an appropriate level of habitual physical activity. This report provides
guidelines for desirable physical activity levels, and for the duration, frequency and intensity of
physical exercise as recommended by various organizations with expertise in physical activity and
health. It also emphasizes that appropriate types and amounts of physical activity can be carried out
during the performance of either obligatory or discretionary activities and that recommendations must
take into account the cultural, social and environmental characteristics of the target population.

2.6 GLOSSARY AND ABBREVIATIONS
In addition to those defined in the preceding sections, the following terms and abbreviations are used
in this report. They are consistent with the definitions used in other related WHO and FAO documents
(FAO, 2003; James and Schofield 1990; WHO, 1995).

Basal metabolic rate (BMR): The minimal rate of energy expenditure compatible with life. It is
measured in the supine position under standard conditions of rest, fasting, immobility,
thermoneutrality and mental relaxation. Depending on its use, the rate is usually expressed per minute,
per hour or per 24 hours.

Body mass index (BMI): The indicator of weight adequacy in relation to height of older children,
adolescents and adults. It is calculated as weight (in kilograms) divided by height (in meters), squared.
The acceptable range for adults is 18.5 to 24.9, and for children it varies with age.

Doubly labelled water (DLW) technique: A method used to measure the average total energy
expenditure of free-living individuals over several days (usually 10 to 14), based on the disappearance
of a dose of water enriched with the stable isotopes 2H and 18O.

Energy requirement (ER): The amount of food energy needed to balance energy expenditure in order
to maintain body size, body composition and a level of necessary and desirable physical activity, and
to allow optimal growth and development of children, deposition of tissues during pregnancy, and
secretion of milk during lactation, consistent with long-term good health. For healthy, well-nourished
adults, it is equivalent to total energy expenditure. There are additional energy needs to support
growth in children and in women during pregnancy, and for milk production during lactation.

Heart rate monitoring (HRM): A method to measure the daily energy expenditure of free-living
individuals, based on the relationship of heart rate and oxygen consumption and on minute-by-minute
monitoring of heart rate.

Total energy expenditure (TEE): The energy spent, on average, in a 24-hour period by an individual
or a group of individuals. By definition, it reflects the average amount of energy spent in a typical
day, but it is not the exact amount of energy spent each and every day.

Physical activity level (PAL): TEE for 24 hours expressed as a multiple of BMR, and calculated as
TEE/BMR for 24 hours. In adult men and non-pregnant, non-lactating women, BMR times PAL is
equal to TEE or the daily energy requirement.


3
 The term “fitness” encompasses cardiorespiratory health, appropriate body composition (including fat
distribution), muscular strength, endurance and flexibility. Fitness can generally be described as the ability to
perform moderate to vigorous physical activity without becoming excessively tired.


                                                                                                                    9
Human energy requirements: Report of a Joint FAO/WHO/UNU Expert Consultation


Physical activity ratio (PAR): The energy cost of an activity per unit of time (usually a minute or an
hour) expressed as a multiple of BMR. It is calculated as energy spent in an activity/BMR, for the
selected time unit.

REFERENCES
FAO. 2003. Food energy – methods of analysis and conversion factors. Report of a technical workshop. FAO
Food and Nutrition Paper No. 77. Rome.
James, W.P.T. & Schofield, E.C. 1990. Human energy requirements. A manual for planners and nutritionists.
Oxford, UK, Oxford Medical Publications under arrangement with FAO.
WHO. 1985. Energy and protein requirements: Report of a joint FAO/WHO/UNU expert consultation. WHO
Technical Report Series No. 724. Geneva.
WHO. 1995. Physical status: The use and interpretation of anthropometry. Report of a WHO expert committee.
WHO Technical Report Series No. 854. Geneva.


10
Energy requirements of infants from birth to 12 months


3. ENERGY REQUIREMENTS OF INFANTS
FROM BIRTH TO 12 MONTHS
The principle of calculating energy requirements from total energy expenditure (TEE) plus the energy
needs for growth applies to infants and children of all ages. However, the previous FAO/WHO/UNU
expert consultation (WHO, 1985) estimated the energy requirements of infants from the observed
intakes of healthy children growing normally, largely owing to the lack of sufficient information on
total energy expenditure. For the last report, data on measurements of infants and children were
compiled from studies of infants in Canada, Sweden, the United Kingdom and the United States
(Whitehead, Paul and Cole, 1981). Results from developing countries were not included in the
analysis “to ensure that the intakes represented those of groups of children who, on the average, were
growing along the fiftieth percentile of the WHO reference standard”. An additional 5 percent was
added to compensate for a possible methodological bias in the calculation of energy intakes.
    Scientific information generated in the intervening years has allowed the present consultation to
base its estimates and recommendations for infants on energy expenditure plus the energy needs for
growth. This assumes that the energy intake of infants is self-regulated and matches energy needs
(Fomon, 1974; Dewey and Lönnerdal, 1986). In keeping with the principles followed by preceding
expert groups, it was decided to base the analyses, conclusions and recommendations on results of
studies carried out on healthy, well-nourished, non-stunted infants born at full term with adequate
birth weight, and growing along the trajectory of the WHO reference standards (WHO, 1983). This
permits the prescription of dietary recommendations consistent with the optimal growth of healthy,
well-nourished infant populations. Special considerations must be made for groups with particular
needs, such as undernourished infants and those with low weight or size at birth.

3.1 MEASUREMENT OF TOTAL ENERGY EXPENDITURE
The use of the doubly labelled water (DLW) (2H218O) technique to calculate total production of
carbon dioxide (CO2) over several days and, from this, total energy expenditure was originally
developed for use in small mammals (Lifson, Gordon and McClintock, 1955), and its application was
later validated in humans (Schoeller and van Santen, 1982; Klein et al., 1984; Coward et al., 1984).
Although questions have been raised about the appropriateness of the assumptions used for the
calculation of TEE, DLW is currently considered the most accurate technique for measuring TEE in
free-living individuals. TEE measured by this method includes basal metabolism, the metabolic
response to food, thermoregulatory needs, physical activity costs, and the energy cost to synthesize
growing tissues. Consequently, energy requirements are calculated as the sum of TEE plus the energy
deposited as protein and fat in growing tissues and organs.
    This consultation examined an analysis of 13 studies with DLW performed on a total of 417
healthy, well-nourished, non-stunted infants of from 0 to 12 months of age (Butte, 2001). Eleven
investigations were carried out in the United Kingdom (Lucas et al., 1987; Roberts et al., 1988;
Davies, Ewing and Lucas, 1989; Wells and Davies, 1995; Wells, Cole and Davies, 1996; Davies et
al., 1997), the United States (Butte et al., 1990; Stunkard et al., 1999; Butte et al., 2000b) and the
Netherlands (de Bruin et al., 1998), one in Chile (Salazar et al., 2000) and one in China (Jiang et al.,
1998). Several studies conducted repeated measurements of TEE at intervals of two to three months,
increasing the number of TEE data points to 854. One such study showed that the coefficient of
variation among individuals was fairly uniform from three to 24 months of age, ranging from 15 to 21
percent for TEE/day (average: 18 percent), and from 13 to 17 percent for TEE/kg/day (average: 15
percent) (Butte et al., 2000b). The average inter-individual variation was similar to that observed
among older children (19 percent for TEE/day, and 17 percent for TEE/kg/day; see section 4.1).

3.2 EQUATIONS TO PREDICT ENERGY EXPENDITURE
Longitudinal measurements of TEE with DLW at three-month intervals for the first two years of life
on 76 healthy infants (40 breastfed and 36 formula-fed) showed that there is a good linear relationship


                                                                                                     11
Human energy requirements: Report of a Joint FAO/WHO/UNU Expert Consultation


between TEE and body weight (Butte et al., 2000b). TEE was significantly affected by age, gender,
weight and length. Age, weight and height were all good predictors of TEE, with a slight advantage
for weight. Because the three parameters were highly correlated (r = 0.91 – 0.96), and there were no
independent effects of age, gender and length when weight was used as the predictor, the latter was
used to develop the following equation (Butte, 2001), which is graphically displayed in Figure 3.1.

TEE (MJ/day) = – 0.416 + 0.371 kg; n = 320, r = 0.85, see = 0.456 MJ/day (109 kcal/day)
TEE (kcal/day) = – 99.4 + 88.6 kg
(n = number of observations; see = standard error of estimate)


FIGURE 3.1
Linear relationship and 95 percent confidence and prediction intervals of equation to
predict TEE from body weight in healthy infants, one to 24 months old

              6000            Linear regression
                                                                                                                                                                                                1400
                              95% Confidence interval
                                                                                                                                                                              J
              5000                                                                                                                                J JJ              JJ      J           J       1200
                              95% Prediction interval                                                                                  J J           J J                        J
                                                                                                                                                                                            J
                                                                                                                               J
                                                                                                                           J J J J                                        J        J
                                                                                                                                                         J
                                                                                                                                        J       J J              J J           J
                                                                                                                                                                                                1000


                                                                                                                                                                                                       TEE (kcal/d)
                                                                                                                                          J                     J J
 TEE (kJ/d)


                                                                                                                 JJ J J J               J
              4000                                                                                J J
                                                                                                                   J J    J JJJ J JJ               J
                                                                                                                                                   J        J
                                                                                                                                                              J
                                                                                                                                                                       JJ
                                                                                              J            J JJ J
                                                                                                               J                     J J J J                     J          J
                                                                                                            J J J J  J            J J JJ J JJ
                                                                                             J JJ JJ         JJ J J J
                                                                                                              J
                                                                                                                                                           J       JJ J J
                                                                                                                                                                   J

                                                                       J J JJ JJJ JJ J JJJ
                                                                                               J
                                                                               J J J J J J J JJ J
                                                                                                      JJ
                                                                                                          J J J J JJ
                                                                                                             J
                                                                                                              J        J
                                                                                                                                 J
                                                                                                                                      J
                                                                                                                                               J
                                                                                                                                                 J
                                                                                                                                                 J                               J              800
                                                                                                                       JJ    JJ       J J J JJ                       J
              3000                                                J
                                                                     J
                                                                                 J JJ J J J JJ J
                                                                                   J J
                                                                                             J
                                                                                             J      J        JJJ
                                                                                                                                             J
                                                                                                                                                     J
                                                             J J J           J J       J J JJJJ J J J
                                                                                            J J
                                                      J         J J                  J              J JJ
                                                     J J          J JJ JJ      JJ J JJ J J J J
                                                                               J
                                                                                                  J JJ J J JJ J
                                                                                                                 JJ
                                                                                                                                                                                                600
                                            J   J           J JJ J J             J JJJ
                                                                                     J                         J
                                        J                      JJ           JJ J JJ        JJ J
                                                                                                        J
                                                                                                                           J
                                J   J                       JJ J JJJ JJ           J        J J
              2000                    J
                            J J JJ JJ J J
                                                   J
                                                  J J J J  J J JJ J J
                                                                       J
                                                                              J J
                                                                                             J
                         J J J JJ J J J J
                                     J
                                        JJ
                                          J        JJJ JJ
                                                    J
                                                        JJ
                                                              J
                                                              J
                                                                          J
                                                                                                                                                                                                400
                          J      J
                                 J J             J
                                J       JJ      JJ J

              1000                                                                                                                                                                              200

                 0                                                                                                                                                                              0
                     4                  6                                       8                                   10                                   12                            14
                                                                                    Weight (kg)

TEE (MJ/d) = – 0.416 + 0.371 kg; n = 320, r = 0.85, see = 0.456 MJ/d (109 kcal/d).
TEE (kcal/d) = – 99.4 + 88.6 kg.
Source: Butte, 2001.


    The relationship between TEE and weight in the 13 studies mentioned in Section 3.1 was explored
using the mean values for TEE and body weight. Some studies included longitudinal or cross-
sectional data at various ages throughout infancy, or from groups of either breastfed or formula-fed
infants. A total of 40 sets of TEE and body weight values, weighted for sample size, gave the
following linear regression equation, which does not differ significantly from that shown above:

TEE (MJ/day) = – 0.399 + 0.369 kg; n = 40, r = 0.99, see = 0.527 MJ/day (126 kcal/day)
TEE (kcal/day) = – 95.4 + 88.3 kg

   As the equation was derived from the mean values of each study, the regression coefficient and
standard error of estimate (see) do not reflect individual variation.

3.2.1 Breastfed and formula-fed infants
Four studies with breastfed and formula-fed infants showed that the formula-fed infants had higher
TEE during the first year of life (Butte et al., 1990; Butte et al., 2000b; Jiang et al., 1998; Davies et
al., 1990). Compared with their breastfed counterparts, formula-fed infants had on average 12, 7, 6
and 3 percent higher TEE at three, six, nine and 12 months of age, respectively. At 18 and 24 months,
there was no difference between infants who still received breastmilk and those who did not (Butte,
2001). The equations to predict TEE from body weight are as follows:


12
Energy requirements of infants from birth to 12 months


Breastfed:
TEE (MJ/day) = – 0.635 + 0.388 kg; n = 195, r = 0.87, see = 0.453 MJ/day (108 kcal/day)
TEE (kcal/day) = – 152.0 + 92.8 kg

Formula-fed:
TEE (MJ/day) = – 0.122 + 0.346 kg; n = 125, r = 0.85, see = 0.463 MJ/day (110 kcal/day)
TEE (kcal/day) = – 29.0 + 82.6 kg

3.3 ENERGY NEEDS FOR GROWTH
Growth is a sensitive indicator of whether an infant’s energy requirements are satisfied. Energy
demands for growth constitute about 35 percent of the total energy requirement during the first three
months of life (40 percent in the first month), this proportion is halved in the next three months (i.e. to
about 17.5 percent), and further reduced to one-third of that during the ensuing six months (i.e. to less
than 6 percent) and to only 3 percent at 12 months. Energy for growth falls to less than 2 percent of
daily requirements in the second year, remains between 1 and 2 percent until mid-adolescence, and
gradually disappears by 20 years of age.
    Energy needs for growth have two components: 1) the energy used to synthesize growing tissues,
which is part of the total energy expenditure measured with DLW; and 2) the energy deposited in
those tissues, basically as fat and protein, because carbohydrate content is insignificant. Hence, energy
requirements in infancy can be calculated by adding the energy deposited in growing tissues to TEE.
    Much previous knowledge on the energy cost of growth was based on studies in pre-term infants
or in children recovering from malnutrition, and used energy balance and the two-component body
composition techniques (WHO, 1985; Butte, Wong and Garza, 1989). Methodological advances have
allowed a better assessment of body composition changes during infancy through serial measurements
of total body electrical conductivity (de Bruin et al., 1998), or with a multi-component body
composition model based on measurements of total body water, total body potassium and bone
mineral content (Butte et al., 2000a). This permits calculation of the gains in protein and fat, as well
as of the corresponding energy deposition assuming that the energy equivalents of protein and fat are
23.6 and 38.7 kJ/g (5.65 and 9.25 kcal/g), respectively. As Table 3.1 shows, energy accrued per gram of
weight gain decreased from approximately 26 kJ (6.3 kcal) in the first three months of life to about 10
kJ (2.3 kcal) at nine to 12 months.


TABLE 3.1
Protein, fat and energy deposition during growth in the first year of life
      Age           Protein gain     Fat mass gain       Weight gain       Energy accrued in normal growth*
     months             g/d               g/d                g/d                kJ/g              kcal/g
     Boys
      0–3               2.6               19.6              32.7                25.1               6.0
      3–6               2.3               3.9               17.7                11.6               2.8
      6–9               2.3               0.5               11.8                 6.2               1.5
      9–12              1.6               1.7                9.1                11.4               2.7
      Girls
      0–3               2.2               19.7              31.1                26.2               6.3
      3–6               1.9               5.8               17.3                15.6               3.7
      6–9               2.0               0.8               10.6                 7.4               1.8
      9–12              1.8               1.1                8.7                 9.8               2.3
*
 Energy equivalents: 1 g protein = 23.6 kJ (5.65 kcal); 1 g fat = 38.7 kJ (9.25 kcal).
Source: Butte et al., 2000a.


                                                                                                               13
TABLE 3.2


14
     Energy requirements of infants during the first year of life*
           Age             Weight       Weight gain     Total energy expenditurea      Energy depositionb                       Daily energy requirementc
          months            kg              g/d            MJ/d          kcal/d        MJ/d          kcal/d          MJ/d          kcal/d        kJ/kg/d    kcal/kg/d
           Boys
            0–1             4.58            35.2          1.282           306          0.884          211           2.166           518           473         113
            1–2             5.50            30.4          1.623           388          0.764          183           2.387           570           434         104
            2–3             6.28            23.2          1.912           457          0.582          139           2.494           596           397          95
            3–4             6.94            19.1          2.157           515          0.224          53            2.380           569           343          82
            4–5             7.48            16.1          2.357           563          0.189          45            2.546           608           340          81
            5–6             7.93            12.8          2.524           603          0.150          36            2.674           639           337          81
            6–7             8.30            11.0          2.661           636          0.069          17            2.730           653           329          79
            7–8             8.62            10.4          2.780           664          0.065          16            2.845           680           330          79
            8–9             8.89             9.0          2.880           688          0.057          14            2.936           702           330          79
           9–10             9.13             7.9          2.969           710          0.089          21            3.058           731           335          80
           10–11            9.37             7.7          3.058           731          0.087          21            3.145           752           336          80
           11–12            9.62             8.2          3.150           753          0.093          22            3.243           775           337          81
           Girls
            0–1             4.35            28.3          1.197           286          0.746          178           1.942           464           447         107
            1–2             5.14            25.5          1.490           356          0.672          161           2.162           517           421         101
            2–3             5.82            21.2          1.742           416          0.559          134           2.301           550           395          94
            3–4             6.41            18.4          1.960           469          0.285          68            2.245           537           350          84
            4–5             6.92            15.5          2.149           514          0.239          57            2.389           571           345          83
            5–6             7.35            12.8          2.309           552          0.199          47            2.507           599           341          82
            6–7             7.71            11.0          2.442           584          0.083          20            2.525           604           328          78
            7–8             8.03             9.2          2.561           612          0.069          17            2.630           629           328          78
            8–9             8.31             8.4          2.665           637          0.063          15            2.728           652           328          78
                                                                                                                                                                        Human energy requirements: Report of a Joint FAO/WHO/UNU Expert Consultation


           9–10             8.55             7.7          2.754           658          0.074          18            2.828           676           331          79
           10–11            8.78             6.6          2.839           679          0.063          15            2.902           694           331          79
           11–12            9.00             6.3          2.920           698          0.060          14            2.981           712           331          79
     * Calculated from linear regression analysis of total energy expenditure on weight, plus allowance for energy deposition in tissues during growth.
     a
       TEE (MJ/d) = – 0.416 + 0.371 kg (section 3.2).
     b
       Weight gain × energy accrued in normal growth (Table 3.1).
     c
       Requirement = total energy expenditure + energy deposition.
     Sources: Butte, 2001. Weight and weight gain data from WHO, 1994.
Energy requirements of infants from birth to 12 months


3.4 CALCULATION OF ENERGY REQUIREMENTS
Table 3.2 shows the average energy requirements of infants from one to 12 months of age, combining
the needs of breastfed and formula-fed infants. TEE was calculated with the predictive linear
equations described in section 3.2 and the median weight for age of the WHO pooled breastfed data
set (WHO, 1994). The rate of median weight gain at monthly intervals was calculated from the same
source. Energy deposited in growing tissues was estimated by multiplying the monthly weight gain by
the mean energy accrued in each three-month period (Table 3.1). The sum of TEE and energy
deposition is the mean daily energy requirement (in MJ or kcal). It is calculated as energy units per
kilogram of body weight, dividing the daily requirement by the median weight at each month of age.
    Breastmilk is the best food for infants, and exclusive breastfeeding is strongly recommended
during the first six months of life, followed by a combination of breastmilk and complementary foods
throughout infancy. As TEE is lower among breastfed than formula-fed infants during the first year of
life, the energy requirements of breastfed infants are also lower. This is illustrated in Table 3.3, in
which requirements are calculated for breastfed and formula-fed infants with the same body weights
using the predictive equations described in section 3.2.1. For the purpose of simplicity, the values
have been rounded off to the closest 5 kJ/kg/day, or 1 kcal/kg/day. These figures are consistent with
the fact that a healthy woman can produce enough milk to provide the energy required by a healthy,
exclusively breastfed infant of up to six months of age.

TABLE 3.3
Energy requirements of breastfed, formula-fed and all infants*
   Age                   Breastfeda                         Formula-fedb                  All (breast- and formula-fed)c
  Months       Boys         Girls       Mean        Boys       Girls       Mean       Boys            Girls           Mean
 kJ/kg/d
     1          445         415         430         510         490        500         475            445              460
     2          410         395         405         460         455        460         435            420              430
     3          380         375         380         420         420        420         395            395              395
     4          330         335         330         360         370        365         345            350              345
     5          330         330         330         355         365        360         340            345              345
     6          325         330         330         350         355        355         335            340              340
     7          320         315         320         340         340        340         330            330              330
     8          320         320         320         340         340        340         330            330              330
     9          325         320         320         340         340        340         330            330              330
    10          330         325         325         340         340        340         335            330              335
    11          330         325         325         340         340        340         335            330              335
    12          330         325         330         345         340        340         335            330              335
 kcal/kg/d
     1          106          99         102         122         117        120         113            107              110
     2           98          95          97         110         108        109         104            101              102
     3           91          90          90         100         101        100          95             94              95
     4           79          80          79          86         89          87          82             84              83
     5           79          79          79          85         87          86          81             82              82
     6           78          79          78          83         85          84          81             81              81
     7           76          76          76          81         81          81          79             78              79
     8           77          76          76          81         81          81          79             78              79
     9           77          76          77          81         81          81          79             78              79
    10           79          77          78          82         81          81          80             79              80
    11           79          77          78          82         81          81          80             79              80
    12            79           77          78        82          81         81          81           79             80
* Numbers rounded to the closest 5 kJ/kg/d, and 1 kcal/kg/d, using the mean body weight and energy deposition in Table 3.1
and the following predictive equations for TEE:
a
  TEE (MJ/kg/d) = (– 0.635 + 0.388 weight) / weight.
b
  TEE (MJ/kg/d) = (– 0.122 + 0.346 weight) / weight.
c
  TEE (MJ/kg/d) = (– 0.416 + 0.371 weight) / weight.


                                                                                                                             15
Human energy requirements: Report of a Joint FAO/WHO/UNU Expert Consultation


3.4.1 Comparison with previous requirements
Compared with the values in the 1985 FAO/WHO/UNU report, energy requirements proposed by this
consultation are about 12 percent lower in the first three months of life, 17 percent lower from three to
nine months, and 20 percent lower from nine to 12 months (Table 3.4 and Figure 3.2). The
requirements for breastfed infants are 17, 20 and 22 percent lower than the 1985 estimates at ages 0 to
three, three to nine and nine to 12 months, respectively. That the 1985 consultation overestimated
requirements of this group had already been suggested from an analysis of 3 573 data points of energy
intakes of well-nourished infants recorded after 1980 (Butte, 1996).

TABLE 3.4
Comparison of present estimates of energy requirements (kJ/kg/d) of infants
with those calculated in the previous (1985) FAO/WHO/UNU report
      Age            Present estimates         1985         % difference from 1985
     months      All infants     Breastfed   estimates   All infants      Breastfed

      0–1           460            430         519          -11              -17
      1–2           430            405         485          -11              -16
      2–3           395            380         456          -13              -17
      3–4           345            330         431          -20              -23
      4–5           345            330         414          -17              -20
      5–6           340            330         404          -16              -18
      6–7           330            320         397          -17              -19
      7–8           330            320         395          -16              -19
      8–9           330            320         397          -17              -19
     9–10           335            325         414          -19              -21
     10–11          335            325         418          -20              -22
     11–12          335            330         437          -23              -24


3.4.2 Basal metabolic rate and physical activity level
The 1981 FAO/WHO/UNU expert consultation estimated the energy requirements of adults as
multiples of BMR (WHO, 1985). This was later called “physical activity level” (PAL) in a manual
commissioned by FAO for the calculation of human energy requirements. PAL is defined as the total
energy required over 24 hours divided by the basal metabolic rate over 24 hours (James and
Schofield, 1990). The 2001 expert consultation upheld this approach to estimating requirements for
adults (section 5). However, the approach must be used with caution or avoided altogether in relation
to the energy requirements of infants and young children, as PAL values may cause confusion owing
to differences in the factors that determine energy requirements among children and among adults. In
non-pregnant, non-lactating women energy requirements are equal to TEE. In children, however,
energy requirements are equal to TEE plus energy accrued or deposited during growth (Eg). These
differences are quantitatively small after two years of age, when Eg represents less than 1 or 2 percent
of the total energy requirement of the child; but they are increasingly larger at less than two years of
age. For example, Eg is about 40 and 23 percent of the energy requirement in the first and third
months of life, respectively. Consequently, energy requirement expressed as a function of BMR is
much higher (i.e. > 2.0 at one month of age and > 1.7 at three months) in comparison with a PAL
value (which is based on measured total energy expenditure) of 1.2 and 1.3 respectively.
    BMR of term infants has been studied extensively producing variable results that range from 180
to 250 kJ/kg/day (43 to 60 kcal/kg/day) (Butte, 2001). This high variability has been attributed to
biological differences, mainly in body composition at different stages of infancy, and to differences in
methods and experimental conditions. For example, some investigators measured “basal” metabolism
in infants who were sleeping spontaneously or under the effect of a sedative, which decreases BMR,
and others did the measurements in the fed state, which increases BMR. The 1981 expert consultation
endorsed the use of predictive equations to estimate the BMR of children under three years of age,
derived from approximately 300 data points obtained by a variety of investigators using different
methods and under diverse conditions (Schofield, Schofield and James, 1985). These equations


16
8070520 Human Energy Requirements

Weitere ähnliche Inhalte

Was ist angesagt?

Nutrition through the life cycle
Nutrition through the life cycleNutrition through the life cycle
Nutrition through the life cycleProf.Louay Labban
 
Protein quality,Assesment method,Requirement,Protien food source & Deficiency...
Protein quality,Assesment method,Requirement,Protien food source & Deficiency...Protein quality,Assesment method,Requirement,Protien food source & Deficiency...
Protein quality,Assesment method,Requirement,Protien food source & Deficiency...MalihaQuader1
 
Quasi vitamins: choline
Quasi vitamins: cholineQuasi vitamins: choline
Quasi vitamins: cholineDomina Petric
 
Drug, nutrient and diet interaction
Drug, nutrient and diet interactionDrug, nutrient and diet interaction
Drug, nutrient and diet interactionKrishitaMukherjee
 
Health benefits of functional food
Health benefits of functional foodHealth benefits of functional food
Health benefits of functional foodAsiya Shakirova
 
Energy requirement for a normal person
Energy requirement for a normal person Energy requirement for a normal person
Energy requirement for a normal person Geeta Jaiswal
 
Applied Nutrition for hormone dysfunction, with Kyla Williams
Applied Nutrition for hormone dysfunction, with Kyla WilliamsApplied Nutrition for hormone dysfunction, with Kyla Williams
Applied Nutrition for hormone dysfunction, with Kyla WilliamsIgennus Healthcare Nutrition
 
Carbohydrates in Sports
Carbohydrates in SportsCarbohydrates in Sports
Carbohydrates in Sportswajihahwafa
 
Drug Nutrient Interaction
Drug Nutrient Interaction Drug Nutrient Interaction
Drug Nutrient Interaction Rasheed Perry
 
Physiology of nutrition
Physiology of nutritionPhysiology of nutrition
Physiology of nutritionSanjogBam
 
Nutritional importance of proteins
Nutritional importance of proteinsNutritional importance of proteins
Nutritional importance of proteinsrohini sane
 
Principles of Diet Therapy and Therapeutic Nutrition
Principles of Diet Therapy  and Therapeutic NutritionPrinciples of Diet Therapy  and Therapeutic Nutrition
Principles of Diet Therapy and Therapeutic NutritionBiotech Online
 
Absorption, transport and metabolism of thiamin
Absorption, transport and metabolism of thiaminAbsorption, transport and metabolism of thiamin
Absorption, transport and metabolism of thiaminDomina Petric
 
Dietary Reference Intakes
Dietary Reference IntakesDietary Reference Intakes
Dietary Reference IntakesCSN Vittal
 
Basic concepts of Nutrition
Basic concepts of NutritionBasic concepts of Nutrition
Basic concepts of NutritionTEJAS PATEL
 

Was ist angesagt? (20)

Nutrition in emergency
Nutrition in emergencyNutrition in emergency
Nutrition in emergency
 
Nutrition through the life cycle
Nutrition through the life cycleNutrition through the life cycle
Nutrition through the life cycle
 
Protein quality,Assesment method,Requirement,Protien food source & Deficiency...
Protein quality,Assesment method,Requirement,Protien food source & Deficiency...Protein quality,Assesment method,Requirement,Protien food source & Deficiency...
Protein quality,Assesment method,Requirement,Protien food source & Deficiency...
 
Energy
EnergyEnergy
Energy
 
Quasi vitamins: choline
Quasi vitamins: cholineQuasi vitamins: choline
Quasi vitamins: choline
 
Drug, nutrient and diet interaction
Drug, nutrient and diet interactionDrug, nutrient and diet interaction
Drug, nutrient and diet interaction
 
Health benefits of functional food
Health benefits of functional foodHealth benefits of functional food
Health benefits of functional food
 
Energy requirement for a normal person
Energy requirement for a normal person Energy requirement for a normal person
Energy requirement for a normal person
 
Applied Nutrition for hormone dysfunction, with Kyla Williams
Applied Nutrition for hormone dysfunction, with Kyla WilliamsApplied Nutrition for hormone dysfunction, with Kyla Williams
Applied Nutrition for hormone dysfunction, with Kyla Williams
 
Carbohydrates in Sports
Carbohydrates in SportsCarbohydrates in Sports
Carbohydrates in Sports
 
Requirement for nutrients
Requirement for nutrientsRequirement for nutrients
Requirement for nutrients
 
Drug Nutrient Interaction
Drug Nutrient Interaction Drug Nutrient Interaction
Drug Nutrient Interaction
 
Physiology of nutrition
Physiology of nutritionPhysiology of nutrition
Physiology of nutrition
 
Dietary Guidelines
Dietary GuidelinesDietary Guidelines
Dietary Guidelines
 
NUTRITIONAL CARE PLAN
NUTRITIONAL CARE PLANNUTRITIONAL CARE PLAN
NUTRITIONAL CARE PLAN
 
Nutritional importance of proteins
Nutritional importance of proteinsNutritional importance of proteins
Nutritional importance of proteins
 
Principles of Diet Therapy and Therapeutic Nutrition
Principles of Diet Therapy  and Therapeutic NutritionPrinciples of Diet Therapy  and Therapeutic Nutrition
Principles of Diet Therapy and Therapeutic Nutrition
 
Absorption, transport and metabolism of thiamin
Absorption, transport and metabolism of thiaminAbsorption, transport and metabolism of thiamin
Absorption, transport and metabolism of thiamin
 
Dietary Reference Intakes
Dietary Reference IntakesDietary Reference Intakes
Dietary Reference Intakes
 
Basic concepts of Nutrition
Basic concepts of NutritionBasic concepts of Nutrition
Basic concepts of Nutrition
 

Mehr von Rasel Khondaker

Mehr von Rasel Khondaker (20)

About Abudhabi Emirate
About Abudhabi EmirateAbout Abudhabi Emirate
About Abudhabi Emirate
 
10 Things To Know About Al Ain
10 Things To Know About Al Ain10 Things To Know About Al Ain
10 Things To Know About Al Ain
 
10 Things To Know About Abu Dhabi
10 Things To Know About Abu Dhabi10 Things To Know About Abu Dhabi
10 Things To Know About Abu Dhabi
 
10 Things To Know About Al Gharbia
10 Things To Know About Al Gharbia10 Things To Know About Al Gharbia
10 Things To Know About Al Gharbia
 
5e Chapter 05
5e Chapter 055e Chapter 05
5e Chapter 05
 
Chapter06
Chapter06Chapter06
Chapter06
 
2011%20 Steward%20 Pledge 0
2011%20 Steward%20 Pledge 02011%20 Steward%20 Pledge 0
2011%20 Steward%20 Pledge 0
 
Datastewards
DatastewardsDatastewards
Datastewards
 
Good Hygiene Practices
Good Hygiene PracticesGood Hygiene Practices
Good Hygiene Practices
 
Ship Organization
Ship OrganizationShip Organization
Ship Organization
 
Stewarding Department (1)
Stewarding Department  (1)Stewarding Department  (1)
Stewarding Department (1)
 
Cv Cv
Cv  CvCv  Cv
Cv Cv
 
Cv Cv
Cv  CvCv  Cv
Cv Cv
 
075e Cribb
075e Cribb075e Cribb
075e Cribb
 
19604900 Human Resouce Management Mgt501
19604900 Human Resouce Management Mgt50119604900 Human Resouce Management Mgt501
19604900 Human Resouce Management Mgt501
 
13418441 Hotel Salary Riew Form
13418441 Hotel Salary Riew Form13418441 Hotel Salary Riew Form
13418441 Hotel Salary Riew Form
 
22945926 Hr Practices In Hotel Industry
22945926 Hr Practices In Hotel Industry22945926 Hr Practices In Hotel Industry
22945926 Hr Practices In Hotel Industry
 
38215002 Bgcha02
38215002 Bgcha0238215002 Bgcha02
38215002 Bgcha02
 
13758611 Hotel Intro
13758611 Hotel Intro13758611 Hotel Intro
13758611 Hotel Intro
 
13103855 Research On Consumer Preference For Soft Drinks
13103855 Research On Consumer Preference For Soft Drinks13103855 Research On Consumer Preference For Soft Drinks
13103855 Research On Consumer Preference For Soft Drinks
 

8070520 Human Energy Requirements

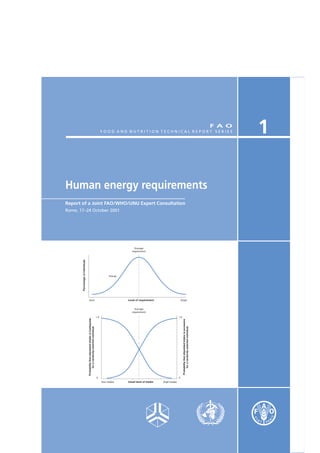
  • 1. ISSN 1813-3932 FOOD AND NUTRITION TECHNICAL REPORT SERIES F A O 1 Human energy requirements Report of a Joint FAO/WHO/UNU Expert Consultation Rome, 17–24 October 2001 Average requirement Percentage of individuals Energy (low) Level of requirement (high) Average requirement 1.0 1.0 Probability that stipulated intake is inadequate Probability that stipulated intake is excessive for a randomly selected individual for a randomly selected individual 0 0 (low intake) Usual level of intake (high intake)
  • 2. FOREWORD Assessing the calorie and nutrient requirements of human beings, with the greatest possible degree of accuracy, is one of the most important and central mandates of the Food and Agriculture Organization of the United Nations (FAO). Since 1948, FAO has convened numerous expert groups in the field of nutrition to collate, evaluate and interpret current scientific knowledge in order to derive estimates of human energy requirements and use these estimates to provide recommendations to people and policy-makers. The World Health Organization (WHO) began its collaboration with FAO on this important work in the early 1950s, while the United Nations University (UNU) joined the initiative in 1981. This important publication is the final report of the most recent expert group meeting, the Joint FAO/WHO/UNU Expert Consultation on Human Energy Requirements, convened in October 2001 at FAO headquarters in Rome, Italy. The primary purpose of the expert meetings on nutrient requirements has remained the same throughout the years: to give advice on scientific issues related to food energy and nutrient requirements and to formulate recommendations for action. Various expert groups have contributed principles for determining and applying general requirements, which have been adopted worldwide. The global scientific community has continued to embrace the advice on requirements that was first published by FAO alone and later in collaboration with WHO. The FAO/WHO recommendations have reflected the state of knowledge at particular points in time, and have also influenced research agendas and methodologies over the years. In fact, the FAO/WHO recommendations are currently utilized in virtually all countries, and nutrient requirement reports are among the most frequently referenced and most sought-after publications in both organizations. Estimates of human energy requirements are essential for assessing whether food supplies are adequate to meet a population’s nutritional needs. Such estimates are also essential in assessing the proportion and absolute number of undernourished people worldwide. The recommendations derived from these estimates assist governments to monitor nutrition programmes and plan development activities. The recommendations also help with the specific formulation of planning at the national level for agricultural production, food supplies and the mobilization and distribution of emergency food aid. FAO has an ongoing mandate to review these assessments periodically – particularly as new research findings emerge – and to produce estimates using the highest possible degree of accuracy based on recent scientific advances and developments in the field. FAO publishes this report on behalf of the three United Nations (UN) agencies (FAO/WHO/UNU) that organized the consultation. We would like to express our gratitude to the members of the expert consultation for their contribution to this important report, as well as to the numerous participants of the working groups. The work of these groups preceded the expert consultation and served as the foundation for discussions and exchange during the meeting. Thanks are also due to Dr E. Kennedy, who very skilfully chaired the expert consultation, and to Dr B. Torun for his commitment to the role of rapporteur and for his contribution to early drafts of this report. We thank all the participants, as well as the non-participating experts who drafted background papers as part of the preparatory process for the expert consultation. These background papers will be published in a special issue of Public Health Nutrition in 2005, thereby providing a more detailed peer-reviewed literature source for many of the ongoing debates on the various topics discussed during the consultation. We would also like to express our special gratitude to the FAO staff members who constituted the Secretariat and completed much of the follow-up work that culminated in this report, in particular the staff of the Nutrition Planning and Evaluation Service (ESNA), P. Shetty, R. Weisell, and B. Burlingame, as well as G. Kennedy, F. Martinez Nocito, T. Ballard and J. Shaw who assisted as consultants both during and after the expert consultation. Kraisid Tontisirin Hartwig de Haen Director Assistant Director-General Food and Nutrition Division Economic and Social Department iii
  • 3. CONTENTS FOREWORD iii PREFACE vii 1. INTRODUCTION 1 1.1 What is new in this report? 1 1.2 Intended use of this report 2 1.3 Policy implications 2 References 3 2. PRINCIPLES AND DEFINITIONS 4 2.1 Definitions 4 2.2 Sources of dietary energy 6 2.3 Components of energy requirements 7 2.4 Calculation of energy requirements 7 2.5 Recommendations for physical activity 9 2.6 Glossary and abbreviations 9 References 10 3. ENERGY REQUIREMENTS OF INFANTS FROM BIRTH TO 12 MONTHS 11 3.1 Measurement of total energy expenditure 11 3.2 Equations to predict energy expenditure 11 3.3 Energy needs for growth 13 3.4 Calculation of energy requirements 15 3.5 Catch-up growth 17 References 18 4. ENERGY REQUIREMENTS OF CHILDREN AND ADOLESCENTS 20 4.1 Measurement of total energy expenditure 20 4.2 Equations to predict total energy expenditure 20 4.3 Energy needs for growth 21 4.4 Calculation of energy requirements 21 4.5 Recommendations for regular physical activity 24 4.6 Infections and mild malnutrition 31 References 32 5. ENERGY REQUIREMENTS OF ADULTS 35 5.1 Factorial estimation of total energy expenditure and physical activity level 35 5.2 Estimation of basal metabolic rate 35 5.3 Physical activity level 37 5.4 Energy requirements and dietary energy recommendations 39 5.5 Older adults and the elderly 47 5.6 Recommendations for regular physical activity 49 References 50 6. ENERGY REQUIREMENTS OF PREGNANCY 53 6.1 Gestational weight gain and optimal pregnancy outcome 53 6.2 Determinants of the energy cost of pregnancy 54 6.3 Calculation of energy requirements for pregnancy 56 6.4 Special considerations for malnourished, obese and adolescent pregnant women 60 References 61 v
  • 4. 7. ENERGY REQUIREMENTS OF LACTATION 63 7.1 Determinants of the energy cost of lactation 63 7.2 Energy requirements for lactation 65 References 66 8. RECOMMENDATIONS FOR FUTURE RESEARCH 67 8.1 Biological questions: conceptual and methodological 67 8.2 Epidemiological and community studies 69 9. CONCLUSIONS 71 References 73 ANNEXES 75 1: Participants – 2001 Joint FAO/WHO/UNU Expert Consultation on Human Energy Requirements 77 2: Authors and reviewers of papers for expert consultation working groups, meetings and follow-up 84 3: Update on predictive equations to estimate basal metabolic rate 87 4: Software application for calculating populations’ energy requirements and food needs 89 5: Energy costs of activities 92 vi
  • 5. PREFACE The purpose of the expert consultations on human energy requirements convened by FAO, WHO and, more recently, UNU is to advise the Directors-General on scientific issues related to food energy, including requirements, so that appropriate recommendations for action can be formulated. It is hence important that during the process of determining energy requirements the question of “requirements for what?” be constantly borne in mind. While biological scientists are generally concerned with the physiological basis of estimating requirements, it is also necessary to be aware of the practical applications of these recommendations for estimating the energy requirements and food needs of populations worldwide. The principal objective of expert consultations on human energy requirements is to provide international agencies and their member countries with the necessary tools for addressing practical questions, such as assessing the adequacy of food supplies and the numbers of people who do not attain energy adequacy, drawing up targets for food production and informing national food and nutrition policy and planning. The recommendations and guidelines that result from these consultations will serve to enable governments and organizations to plan, monitor and evaluate nutrition programmes and policies better. They will also help Member Nations to develop estimates of requirements appropriate for local conditions and for direct application in their countries. It is important to remember that while developed countries are able to constitute their own committees of experts who can make recommendations on energy and nutrient requirements for their populations, the majority of humanity in the developing world relies largely on UN agencies such as FAO. Hence, the development of pragmatic recommendations by expert committees convened by UN agencies, which are based on sound scientific evidence and have practical relevance to the conditions prevailing in the developing world, is paramount. The entire process leading up to the convening of an expert group and the resulting consultation is highly formalized and follows a number of required protocols. For the first time, FAO adopted a two- stage process, which started with convening working groups in those areas where it believed that new scientific knowledge existed that might influence the current recommendations for energy needs. The second stage of the process was the expert consultation itself. The rationale behind convening the working groups was that many of the scientific questions could be dealt with by experts in the areas concerned, even though the participation of those experts at the consultation per se was uncertain owing to the need to provide a globally representative consultative panel. Working groups would also facilitate discussions, as any contentious issues could be debated and settled before the expert meeting, which would benefit from the results of such discussions. Accordingly, working groups met from 27 June to 5 July 2001 at FAO headquarters in Rome, several months before the expert meeting in October 2001. Three of the working groups focused primarily on energy requirements throughout the life cycle and related to two important sub-populations – infants and children, and pregnant and lactating women – for which substantial scientific advances had been made. These working groups were on: 1) energy (and protein) requirements of infants and preschool children; 2) energy (and protein) requirements of pregnancy and lactation; and 3) analytical issues in food energy and composition: energy in food labelling, including regulatory and trade issues, which looked at food energy values. An additional working group was constituted to provide documentation on methodologies for energy balance and energy requirements, but it was felt that – given the nature of the task – there was no need for this group to meet, although their background documents were available to the expert consultation. The chairpersons of all the working groups on energy were invited to the expert consultation to present a summary of the deliberations and recommendations of their groups and to advise the experts. Background papers were commissioned, peer-reviewed and made available to both the pre-consultation working groups and the experts who met for the consultation. The entire process of pre-consultation activities and the consultation itself went smoothly, despite a few hitches that were largely the result of the unhappy events of 11 September 2001, which prevented some of the invited experts from coming to Rome to join the consultative process. Lists of the participants in the various working group sessions, and those invited as experts to the consultation are included as Annex 1 of this report. Annex 2 provides details of the authors and vii
  • 6. reviewers of the background documents, which are expected to be published shortly as a supplement to the journal Public Health Nutrition. The wide availability of this publication as a peer-reviewed journal supplement is expected to provide the academic community with an opportunity to examine the collated evidence base that informed the expert panel and influenced their latest recommendations. As part of the second stage of the process, the members of the expert consultation met in FAO headquarters in Rome from 17 to 21 October 2001. The meeting was chaired by Dr E. Kennedy, with Dr B. Torun serving as rapporteur. The following are the specific tasks outlined in the charge given to this expert consultation on human energy requirements: 1. To review the background documents on the state of the art of the scientific literature in this area of work, assembling the best evidence on the topic and using, where appropriate, the summary, advice and recommendations arising from the deliberations of the working groups that had met earlier in the year. 2. To deliberate on and arrive at recommendations for energy requirements throughout the life cycle, while clearly outlining the approaches used to estimate requirements that may be of benefit to users. This included taking into account physiological states such as growth, pregnancy and lactation and, where relevant, pathological conditions and the additional needs during infections. The recommendations were expected to be reached by consensus, and where differences persisted the reasons for those differences were to be clearly outlined, with all sides presented and appropriately reflected in the report of the expert consultation. 3. To examine the feasibility of arriving at minimum requirements that may be of use in estimating the numbers of individuals in populations who are unable to meet energy adequacy. 4. To comment on the consequences of deficit and excess of energy, and to recommend ways by which the health, social and economic consequences of these can be minimized or avoided. 5. To highlight the main changes to the recommendations of the 1985 report, with particular emphasis on those aspects of the new recommendations that have a significant impact on the way in which nutritional adequacy of population groups is assessed by those involved in policy, planning or analysis of the nutritional status of populations. 6. To suggest areas where further research is needed, either to deal with gaps in the knowledge related to energy requirements in specific groups or situations, or to facilitate the collection of normative data that will aid the process of arriving at future recommendations for energy requirements. It was the sincere desire of the FAO Secretariat to ensure that the report of the expert consultation on human energy requirements be available within the shortest possible period after the experts met in Rome. The two-year gap before the interim report was available as a downloadable file on the FAO Web site, and a further period before it was available in hard copy were due to a series of post- consultation activities that were deemed essential before the release of the final report. Many of these post-consultation activities were in response to, and out of respect for, the experts who recommended a number of important pieces of work to be followed-up and completed for inclusion in the report. An important recommendation of the expert group was to update and review the predictive equations for estimating basal metabolic rate (BMR) and to incorporate the updated equations into the new recommendations. These activities proved to be time-consuming, as they involved updating the global database on BMRs that was originally obtained for the 1985 report, reanalysing it with particular emphasis on looking at the influence of methodological biases and ethnic variations, and developing new BMR predictive equations with better predictive performance for international use (Annex 3). The reanalysis was followed by an exercise to test the validity of the new equations, and a further consultation with a sub-group of the expert panel for their final decision. However, after this long exercise the experts concluded that the international equations hitherto used continued to have enhanced precision and robustness. Following reanalysis of the global database, the recommendation to use a seamless single predictive BMR equation was not considered practical, and hence the expert consultation was not persuaded to replace the international equations provided in the 1985 report. These predictive equations have been widely used and are popular with the scientific community and nutritional planners, and the present report’s recommendation is to continue using them. viii
  • 7. One of the other recommendations that arose from the deliberations of the working group on analytical issues in food energy and composition, which was subsequently endorsed by the experts, was to convene a meeting to deliberate on food energy values. The objective was to ensure harmony between the expected adoption of new energy requirement values from this consultation, which are based solely on energy expenditure measurements or estimates, and energy requirements based on food intake measurements alone. FAO thus convened a Technical Workshop on Food Energy – Methods of Analysis and Conversion Factors, which was held in Rome from 3 to 6 December 2002. The report of this workshop was published as FAO Food and Nutrition Paper No. 77 in 2003, which complements the present report. As part of the post-consultation activities in preparation for the release of the expert report, it was decided to produce an updated, Windows-compatible and user-friendly software application for the purpose of calculating population energy requirements and food needs. After the 1981 joint expert consultation report was released (WHO, 1985), FAO sponsored the development of a manual and software package (James and Schofield, 1990), recognizing that less attention had hitherto been paid to the matter of how to apply the requirements to practical food and nutrition planning. The success of this 1990 user’s manual, which was sponsored by FAO and published by Oxford University Press, was constrained because it was a priced publication that was available separately from the 1985 joint expert report. For the 2001 consultation, it was decided to make the new software widely and readily available by releasing it alongside the report. FAO therefore had to find an organization that would assist us in developing such a product to be released at the same time as the expert report in 2004. Early discussions were conducted with the United States Centers for Disease Control and Prevention (CDC) in Atlanta, Georgia, with the objective of developing the software and making it available as a downloadable version alongside CDC’s popular EpiNut software. However, CDC was unable to collaborate in this venture, so other partners had to be sought. The Division of Nutrition, Institute of Population Health and Clinical Research at Bangalore, India and its Dean, Dr A. Kurpad, identified Jenesys Technologies, a software applications firm in India, which collaborated alongside the institute in the development of the software package and accompanying manual (Annex 4). This is now available on CD-ROM. For the first time, the software package is being issued together with the expert report in order to ensure that those interested in the report’s recommendations have the means to investigate and ensure their practical applicability, as well as to benefit from the two outputs’ complementarity. The user’s manual and software application for calculating population energy requirements and food needs thus represent a further milestone in FAO’s continued involvement in both the theoretical and the practical issues related to human energy requirements. This expert consultation was convened nearly two decades after the last expert group met to deliberate on energy and protein requirements in 1981. In the interim, the International Dietary Energy Consultancy Group (IDECG), sponsored jointly by UNU and the International Union of Nutritional Sciences (IUNS), filled the lacuna by convening meetings to discuss important developments in this area. The IDECG meeting in London in 1994 on Energy and Protein Requirements (whose proceedings were published in European Journal of Clinical Nutrition Vol. 50, Supplement 1 in February 1996) was a seminal meeting that provided much of the preparatory background for this expert consultation. We would like to acknowledge and pay our tribute to the late, Dr Beat Schurch who, as Executive Secretary of IDECG, was the quiet engine behind this invaluable contribution to the advancement and dissemination of nutrition knowledge. FAO and WHO benefited greatly from IDECG’s work and publications, in particular its review of human energy and protein requirements in 1994. While FAO was organizing the 2001 expert consultation, Beat Schurch knew that he was sick but planned to attend both the consultation and the working groups that preceded it. Unfortunately, his illness progressed more quickly than had been anticipated, and he had to decline the invitation. He approached his illness and its culmination with the same equanimity with which he approached most matters and wished the group well. His contribution and friendship will be sorely missed. Prakash Shetty Chief Nutrition Planning, Assessment & Evaluation Service (ESNA) Food & Nutrition Division ix
  • 8. Introduction 1. INTRODUCTION Since 1949, the Food and Agriculture Organization of the United Nations (FAO) and, since the early 1950s, the World Health Organization (WHO) have convened groups of experts to evaluate current scientific knowledge in order to define the energy requirements of humans and propose dietary energy recommendations for populations. The purpose of this information is to assist FAO and WHO in implementing their programmes. The United Nations University (UNU) became part of this joint initiative in 1981. The reports of these expert meetings (see the list of References at the end of this chapter) have become important guidelines on energy in human nutrition for academic scientists, nutritionists, physicians and other health workers, as well as for planners and policy-makers in both the agriculture and health sectors throughout the world. New scientific knowledge generated in the 20 years since the last expert consultation was held prompted FAO, WHO and UNU to assemble a new expert consultation to make recommendations for energy requirements of populations throughout the life cycle (WHO, 1985). This consultation took place from 17 to 24 October 2001 at FAO headquarters in Rome. Its mandate was to revise and update the conclusions and recommendations of the preceding consultation, which was convened in 1981 and whose report was published in 1985. In preparation for the forthcoming expert consultation, well- known scientists with demonstrated expertise in this area of work were asked to examine and write background papers on various topics that required revision and updating. Several of the authors and other leading scientists constituted working groups that met in Rome in June 2001 to discuss and analyse critically the contents of the background papers, which were subsequently modified following the working group suggestions. The modified papers, the working groups’ conclusions and other relevant documents were provided to all members of the expert consultation for analysis and consideration in their deliberations.1 Dr Eileen Kennedy was elected to chair this expert consultation, and Dr Benjamin Torun to be the rapporteur. Several conclusions and recommendations were the immediate results, while a number of topics were identified as requiring further research and analysis before the experts could finalize their recommendations. The rapporteur and other members of the consultation were given the task of pursuing the pending issues with assistance from the FAO Secretariat, and additional working papers were commissioned. This laborious task went on until the end of 2003, when almost all questions had been answered and gaps filled and the rapporteur was able to prepare the final draft for examination and approval by the other experts from the consultation. This report is the final result of those efforts. 1.1 WHAT IS NEW IN THIS REPORT? Although the basic principles set forth in previous expert meetings have withstood the test of time, several modifications are proposed in this report. Members of the expert consultation and participants in the working groups recognize and accept the responsibility for proposing these modifications, and for the implications that they will have on health, agriculture, the food industry, economic planning, international aid and social programmes related to food and nutrition. It is their belief that the conclusions and recommendations in this report are well grounded, given the current state of the best scientific knowledge. A critical appraisal of their application will be the final proof of their accuracy, applicability and appropriateness. The new concepts and recommendations set forth in this report include: calculation of energy requirements for all ages, based on measurements and estimates of total daily energy expenditure and on energy needs for growth, pregnancy and lactation; in the light of new data, modification of the requirements and dietary energy recommendations for infants and for older children and adolescents, in order to correct previous overestimations for the former and underestimations for the latter; 1 Annex 1 gives the names of participants in the working groups and expert consultation. Annex 2 lists the titles and authors of the background documents. 1
  • 9. Human energy requirements: Report of a Joint FAO/WHO/UNU Expert Consultation proposals for differentiating the requirements for populations with lifestyles that involve different levels of habitual physical activity, starting as early as six years of age; reassessment of energy requirements for adults, based on energy expenditure estimates expressed as multiples of basal metabolic rates; classification of physical activity levels based on the degree of habitual activity that is consistent with long-term good health and maintenance of a healthy body weight; recommendations for physical activity for children and adults to maintain fitness and health and to reduce the risk of developing obesity and co-morbid diseases associated with a sedentary lifestyle; an experimental approach for factorial estimates of energy needs during pregnancy and lactation; distribution in the two last trimesters of pregnancy of the recommendations for additional dietary energy needs. 1.2 INTENDED USE OF THIS REPORT This report is briefer and less detailed than the reports of previous expert meetings and consultations. The commissioned background papers, which will be published in a peer-reviewed journal, complement the report with details on the sources, analysis and interpretation of the scientific information. In addition to a printed version, the report will be placed on the Internet for wider access and faster diffusion. This report is not meant merely to describe the energy expenditures and requirements of population groups. It intends to be prescriptive, in order to support and maintain health and good nutrition. The recommendations, however, are meant for well-nourished and healthy populations, as the correction of malnutrition – either deficit or excess – involves different energy requirements and dietary recommendations. The report is not meant to be prescriptive for individual subjects, some of whom may be at either extreme of a normal distribution. Although estimates of requirements are derived from measurements of individuals with specific characteristics such as age, gender, body size, presumed body composition and physical activity, the data have been pooled to give the average energy requirements of groups or classes of individuals who have similar characteristics, but on whom measurements have not been made. Consequently, application of these results to any one individual for clinical or other purposes may lead to errors of diagnosis and improper management. 1.3 POLICY IMPLICATIONS A science-based definition of human energy requirements is crucial for the control and prevention of undernutrition due to insufficient intake of food energy, which remains a major problem for many countries. It is also essential to efforts to curb the excessive intake of food energy that is a major determinant of nutrition-related chronic diseases, at present an important cause of worldwide morbidity and mortality among adults. Insufficient food energy intake is almost always accompanied by a deficient intake of most nutrients. Awareness of the consequences of insufficient energy intakes in children and adults has influenced health and food and agriculture policies around the world. More recently, the consequences of increasing obesity and nutrition-related chronic diseases have also been recognized as major factors for the health, food and agriculture sectors. These problems are increasing globally as a result of changes in diets and lifestyles that are reflected in changing food cultures and physical activity patterns among all segments of society, and not only among affluent groups or in the richest countries. Undernutrition early in life, followed by an inappropriate diet and low physical activity in childhood and adult life increases vulnerability to chronic non-communicable diseases. Low-income groups in urban areas are especially vulnerable to the risk of obesity owing to a positive energy balance. The current increased incidence of overweight and obesity among children and adults in most countries leads to rapidly rising projections of disability and premature death to nutrition-related chronic diseases. Prevention is the only feasible approach to control the double burden of under- and overnutrition. The cost of treating and managing the ensuing disabilities and diseases imposes an intolerable economic and health burden, especially for poorer countries. As inappropriate dietary intake and lack 2
  • 10. Introduction of physical activity are the main causes of nutritional problems, there is an urgent need for governments, in partnership with all relevant stakeholders, to integrate strategies that promote healthy diets and regular physical activity in all relevant policies and programmes, including those designed to fight undernutrition. Both undernutrition and obesity are preventable, as has been demonstrated by countries with successful programmes. In addition to health promotion, nutrition education and relevant agricultural and food policies, effective food and nutrition programmes must include community action to overcome the environmental, social and economic constraints that limit the improvement of access to food, and to promote better dietary quality and life style practices that encourage a physically active life. REFERENCES FAO. 1950. Calorie requirements: Report of the Committee on Calorie Requirements. FAO Nutritional Studies No. 5. Rome. FAO. 1957. Calorie requirements: Report of the Second Committee on Calorie Requirements. FAO Nutritional Studies No. 15. Rome. FAO/WHO. 1973. Energy and protein requirements: Report of a joint FAO/WHO ad hoc expert committee. FAO Nutrition Meetings Report Series No. 52. WHO Technical Report Series No. 522. Rome and Geneva. WHO. 1985. Energy and protein requirements: Report of a joint FAO/WHO/UNU expert consultation. WHO Technical Report Series No. 724. Geneva. 3
  • 11. Human energy requirements: Report of a Joint FAO/WHO/UNU Expert Consultation 2. PRINCIPLES AND DEFINITIONS Human energy requirements are estimated from measures of energy expenditure plus the additional energy needs for growth, pregnancy and lactation. Recommendations for dietary energy intake from food must satisfy these requirements for the attainment and maintenance of optimal health, physiological function and well-being. The latter (i.e. well-being) depends not only on health, but also on the ability to satisfy the demands imposed by society and the environment, as well as all the other energy-demanding activities that fulfil individual needs. Energy balance is achieved when input (i.e. dietary energy intake) is equal to output (i.e. total energy expenditure), plus the energy cost of growth in childhood and pregnancy, or the energy cost to produce milk during lactation. When energy balance is maintained over a prolonged period, an individual is considered to be in a steady state. This can include short periods during which the day- to-day balance between intake and expenditure does not occur. An optimal steady state is achieved when energy intake compensates for total energy expenditure and allows for adequate growth in children, and pregnancy and lactation in women, without imposing metabolic, physiological or behavioural restrictions that limit the full expression of a person’s biological, social and economic potential. Within certain limits, humans can adapt to transient or enduring changes in energy intake through possible physiological and behavioural responses related to energy expenditure and/or changes in growth. Energy balance is maintained, and a new steady state is then achieved. However, adjustments to low or high energy intakes may sometimes entail biological and behavioural penalties, such as reduced growth velocity, loss of lean body mass, excessive accumulation of body fat, increased risk of disease, forced rest periods, and physical or social limitations in performing certain activities and tasks. Some of these adjustments are important and may even increase the chances of survival in times of food scarcity. 2.1 DEFINITIONS An adequate, healthy diet must satisfy human needs for energy and all essential nutrients. Furthermore, dietary energy needs and recommendations cannot be considered in isolation of other nutrients in the diet, as the lack of one will influence the others. Thus, the following definitions are based on the assumption that requirements for energy will be fulfilled through the consumption of a diet that satisfies all nutrient needs. Energy requirement is the amount of food energy needed to balance energy expenditure in order to maintain body size, body composition and a level of necessary and desirable physical activity consistent with long-term good health. This includes the energy needed for the optimal growth and development of children, for the deposition of tissues during pregnancy, and for the secretion of milk during lactation consistent with the good health of mother and child. The recommended level of dietary energy intake for a population group is the mean energy requirement of the healthy, well-nourished individuals who constitute that group. Based on these definitions, a main objective for the assessment of energy requirements is the prescription of dietary energy intakes that are compatible with long-term good health. Therefore, the levels of energy intake recommended by this expert consultation are based on estimates of the requirements of healthy, well-nourished individuals. It is recognized that some populations have particular public health characteristics that are part of their usual, “normal” life. Foremost among these are population groups in many developing countries where there are numerous infants and children who suffer from mild to moderate degrees of malnutrition and who experience frequent episodes of infectious diseases, mostly diarrhoeal and respiratory infections. Special considerations are made in this report for such sub-populations. 4
  • 12. 2.1.1 Daily energy requirements and daily energy intakes Energy requirements and recommended levels of intake are often referred to as daily requirements or recommended daily intakes. These terms are used as a matter of convention and convenience, indicating that the requirement represents an average of energy needs over a certain number of days, and that the recommended energy intake is the amount of energy that should be ingested as a daily average over a certain period of time. There is no implication that exactly this amount of energy must be consumed every day, nor that the requirement and recommended intake are constant, day after day. Neither is there any biological basis for defining the number of days over which the requirement or intake must be averaged. As a matter of convenience, taking into account that physical activity and eating habits may vary on some days of the week, periods of seven days are often used when estimating the average daily energy expenditure and recommended daily intake. 2.1.2 Average requirement and inter-individual variation Estimates of energy requirements are derived from measurements of individuals. Measurements of a collection of individuals of the same gender and similar age, body size and physical activity are grouped together to give the average energy requirement – or recommended level of dietary intake – for a class of people or a population group. These requirements are then used to predict the requirements and recommended levels of energy intake for other individuals with similar characteristics, but on whom measurements have not been made. Although individuals in a given class have been matched for characteristics that may affect requirements, such as gender, age, body size, body composition and lifestyle, there remain unknown factors that produce variations among individuals. Consequently, there is a distribution of requirements within the class or population group (WHO, 1985) (Figure 2.1). FIGURE 2.1 Distribution of energy requirements of a population group or class of individuals* * It is assumed that individual requirements are randomly distributed about the mean requirement for the class of individuals, and that the distribution is Gaussian. Source. WHO, 1985. For most specific nutrients, a certain excess of intake will not be harmful. Thus, when dietary recommendations are calculated for these nutrients, the variation among individuals in a class or population group is taken into account, and the recommended level of intake is an amount that will meet or exceed the requirements of practically all individuals in the group. For example, the 5
  • 13. Human energy requirements: Report of a Joint FAO/WHO/UNU Expert Consultation 66 recommended safe level of intake for proteins is the average requirement of the population group, plus 2 standard deviations. This approach cannot be applied to dietary energy recommendations, because intakes that exceed requirements will produce a positive balance, which may lead to overweight and obesity in the long term. A high level of energy intake that assures a low probability of energy deficiency for most people (e.g. the average requirement plus 2 standard deviations) also implies a high probability of obesity for most people owing to a dietary energy excess (Figure 2.2). Therefore, in agreement with earlier reports, this expert consultation concluded that the descriptor of the dietary energy intake that could be safely recommended for a population group is the estimated average energy requirement of that group. FIGURE 2.2 Probability that a particular energy intake is inadequate or excessive for an individual* * Individuals are randomly selected among a class of people or a population group. The two probability curves overlap, so the level of energy intake that assures a low probability of dietary energy deficiency is the same level that implies a high probability of obesity owing to dietary energy excess. Source: WHO, 1985. 2.2 SOURCES OF DIETARY ENERGY Energy for the metabolic and physiological functions of humans is derived from the chemical energy bound in food and its macronutrient constituents, i.e. carbohydrates, fats, proteins and ethanol, which act as substrates or fuels. After food is ingested, its chemical energy is released and converted into thermic, mechanical and other forms of energy. This report refers to energy requirements that must be satisfied with an adequately balanced diet, and does not make specific recommendations for carbohydrates, fats or proteins. Reports from other FAO and WHO expert groups address those topics. Nevertheless, it should be noted that fats and carbohydrates are the main sources of dietary energy, although proteins also provide important amounts of energy, especially when total dietary energy intake is limited. Ethanol is not considered part of a food system, but its contribution to total energy intake cannot be overlooked, particularly among populations that regularly consume alcoholic beverages. Allowing for the mean intestinal absorption, and for the nitrogenous portion of proteins that cannot be completely oxidized, the average values of metabolizable energy provided by substrates in a mixed diet are 16.7 kJ (4 kcal) per 6
  • 14. Principles and definitions substrates determined by chemical analysis, or estimated from appropriate food composition tables. A recent related report from a FAO technical workshop provides more information on this topic (FAO, 2003). 2.3 COMPONENTS OF ENERGY REQUIREMENTS Human beings need energy for the following: Basal metabolism. This comprises a series of functions that are essential for life, such as cell function and replacement; the synthesis, secretion and metabolism of enzymes and hormones to transport proteins and other substances and molecules; the maintenance of body temperature; uninterrupted work of cardiac and respiratory muscles; and brain function. The amount of energy used for basal metabolism in a period of time is called the basal metabolic rate (BMR), and is measured under standard conditions that include being awake in the supine position after ten to 12 hours of fasting and eight hours of physical rest, and being in a state of mental relaxation in an ambient environmental temperature that does not elicit heat-generating or heat-dissipating processes. Depending on age and lifestyle, BMR represents 45 to 70 percent of daily total energy expenditure, and it is determined mainly by the individual’s age, gender, body size and body composition. Metabolic response to food. Eating requires energy for the ingestion and digestion of food, and for the absorption, transport, interconversion, oxidation and deposition of nutrients. These metabolic processes increase heat production and oxygen consumption, and are known by terms such as dietary-induced thermogenesis, specific dynamic action of food and thermic effect of feeding. The metabolic response to food increases total energy expenditure by about 10 percent of the BMR over a 24-hour period in individuals eating a mixed diet. Physical activity. This is the most variable and, after BMR, the second largest component of daily energy expenditure. Humans perform obligatory and discretionary physical activities. Obligatory activities can seldom be avoided within a given setting, and they are imposed on the individual by economic, cultural or societal demands. The term “obligatory” is more comprehensive than the term “occupational” that was used in the 1985 report (WHO, 1985) because, in addition to occupational work, obligatory activities include daily activities such as going to school, tending to the home and family and other demands made on children and adults by their economic, social and cultural environment. Discretionary activities, although not socially or economically essential, are important for health, well-being and a good quality of life in general. They include the regular practice of physical activity for fitness and health; the performance of optional household tasks that may contribute to family comfort and well-being; and the engagement in individually and socially desirable activities for personal enjoyment, social interaction and community development. Growth. The energy cost of growth has two components: 1) the energy needed to synthesize growing tissues; and 2) the energy deposited in those tissues. The energy cost of growth is about 35 percent of total energy requirement during the first three months of age, falls rapidly to about 5 percent at 12 months and about 3 percent in the second year, remains at 1 to 2 percent until mid-adolescence, and is negligible in the late teens. Pregnancy. During pregnancy, extra energy is needed for the growth of the foetus, placenta and various maternal tissues, such as in the uterus, breasts and fat stores, as well as for changes in maternal metabolism and the increase in maternal effort at rest and during physical activity. Lactation. The energy cost of lactation has two components: 1) the energy content of the milk secreted; and 2) the energy required to produce that milk. Well-nourished lactating women can derive part of this additional requirement from body fat stores accumulated during pregnancy. 2.4 CALCULATION OF ENERGY REQUIREMENTS The total energy expenditure of free-living persons can be measured using the doubly labelled water technique (DLW) or other methods that give comparable results. Among these, individually calibrated heart rate monitoring has been successfully validated. Using these methods, measurements of total energy expenditure over a 24-hour period include the metabolic response to food and the energy cost 7
  • 15. Human energy requirements: Report of a Joint FAO/WHO/UNU Expert Consultation of tissue synthesis. For adults, this is equivalent to daily energy requirements. Additional energy for deposition in growing tissues is needed to determine energy requirements in infancy, childhood, adolescence and during pregnancy, and for the production and secretion of milk during lactation. It can be estimated from calculations of growth (or weight gain) velocity and the composition of weight gain, and from the average volume and composition of breastmilk. 2.4.1 Factorial estimates of total energy expenditure When experimental data on total energy expenditure are not available, it can be estimated by factorial calculations based on the time allocated to activities that are performed habitually and the energy cost of those activities. Factorial calculations combine two or more components or “factors”, such as the sum of the energy spent while sleeping, resting, working, doing social or discretionary household activities, and in leisure. Energy spent in each of these components may in turn be calculated by knowing the time allocated to each activity, and its corresponding energy cost. As discussed in the following sections of this report, the experimental measurement of total energy expenditure and the assessment of growth and tissue composition allow sound predictions to be made regarding energy requirements and dietary recommendations for infants and older children around the world. Special considerations and additional calculations assist the formulation of recommendations for children and adolescents with diverse lifestyles. Total energy expenditure has also been measured in groups of adults, but this has been primarily in industrialized countries. Variations in body size, body composition and habitual physical activity among populations of different geographical, cultural and economic backgrounds make it difficult to apply the published results on a worldwide basis. Thus, in order to account for differences in body size and composition, energy requirements were initially calculated as multiples of BMR. They were then converted into energy units using a known BMR value for the population, or the mean BMR calculated from the population’s mean body weight. To account for differences in the characteristic physical activity of the associated lifestyles, energy requirements of adults were estimated by factorial calculations that took into account the times allocated to activities demanding different levels of physical effort. The extra needs for pregnancy and lactation were also calculated using factorial estimates for the growth of maternal and foetal tissues, the metabolic changes associated with pregnancy and the synthesis and secretion of milk during lactation. 2.4.2 Expression of requirements and recommendations Measurements of energy expenditure and energy requirement recommendations are expressed in units of energy (joules, J), in accordance with the international system of units. Because many people are still used to the customary usage of thermochemical energy units (kilocalories, kcal), both are used in this report, with kilojoules given first and kilocalories second, within parenthesis and in a different font (Arial 9). In tables, values for kilocalories are given in italic type.2 Gender, age and body weight are the main determinants of total energy expenditure. Thus, energy requirements are presented separately for each gender and various age groups, and are expressed both as energy units per day and energy per kilogram of body weight. As body size and composition also influence energy expenditure, and are closely related to basal metabolism, requirements are also expressed as multiples of BMR. 2 1 joule (J) is the amount of mechanical energy required to displace a mass of 1 kg through a distance of 1 m with an acceleration of 1 m per second (1 J = 1 kg × 1 m2 × 1 sec-2). Multiples of 1 000 (kilojoules, kJ) or 1 million (megajoules, MJ) are used in human nutrition. The conversion factors between joules and calories are: 1 kcal = 4.184 kJ, or conversely, 1 kJ = 0.239 kcal. 8
  • 16. Principles and definitions 2.5 RECOMMENDATIONS FOR PHYSICAL ACTIVITY A certain amount of activity must be performed regularly in order to maintain overall health and fitness,3 to achieve energy balance and to reduce the risk of developing obesity and associated diseases, most of which are associated with a sedentary lifestyle. This expert consultation therefore endorsed the proposition that recommendations for dietary energy intake must be accompanied by recommendations for an appropriate level of habitual physical activity. This report provides guidelines for desirable physical activity levels, and for the duration, frequency and intensity of physical exercise as recommended by various organizations with expertise in physical activity and health. It also emphasizes that appropriate types and amounts of physical activity can be carried out during the performance of either obligatory or discretionary activities and that recommendations must take into account the cultural, social and environmental characteristics of the target population. 2.6 GLOSSARY AND ABBREVIATIONS In addition to those defined in the preceding sections, the following terms and abbreviations are used in this report. They are consistent with the definitions used in other related WHO and FAO documents (FAO, 2003; James and Schofield 1990; WHO, 1995). Basal metabolic rate (BMR): The minimal rate of energy expenditure compatible with life. It is measured in the supine position under standard conditions of rest, fasting, immobility, thermoneutrality and mental relaxation. Depending on its use, the rate is usually expressed per minute, per hour or per 24 hours. Body mass index (BMI): The indicator of weight adequacy in relation to height of older children, adolescents and adults. It is calculated as weight (in kilograms) divided by height (in meters), squared. The acceptable range for adults is 18.5 to 24.9, and for children it varies with age. Doubly labelled water (DLW) technique: A method used to measure the average total energy expenditure of free-living individuals over several days (usually 10 to 14), based on the disappearance of a dose of water enriched with the stable isotopes 2H and 18O. Energy requirement (ER): The amount of food energy needed to balance energy expenditure in order to maintain body size, body composition and a level of necessary and desirable physical activity, and to allow optimal growth and development of children, deposition of tissues during pregnancy, and secretion of milk during lactation, consistent with long-term good health. For healthy, well-nourished adults, it is equivalent to total energy expenditure. There are additional energy needs to support growth in children and in women during pregnancy, and for milk production during lactation. Heart rate monitoring (HRM): A method to measure the daily energy expenditure of free-living individuals, based on the relationship of heart rate and oxygen consumption and on minute-by-minute monitoring of heart rate. Total energy expenditure (TEE): The energy spent, on average, in a 24-hour period by an individual or a group of individuals. By definition, it reflects the average amount of energy spent in a typical day, but it is not the exact amount of energy spent each and every day. Physical activity level (PAL): TEE for 24 hours expressed as a multiple of BMR, and calculated as TEE/BMR for 24 hours. In adult men and non-pregnant, non-lactating women, BMR times PAL is equal to TEE or the daily energy requirement. 3 The term “fitness” encompasses cardiorespiratory health, appropriate body composition (including fat distribution), muscular strength, endurance and flexibility. Fitness can generally be described as the ability to perform moderate to vigorous physical activity without becoming excessively tired. 9
  • 17. Human energy requirements: Report of a Joint FAO/WHO/UNU Expert Consultation Physical activity ratio (PAR): The energy cost of an activity per unit of time (usually a minute or an hour) expressed as a multiple of BMR. It is calculated as energy spent in an activity/BMR, for the selected time unit. REFERENCES FAO. 2003. Food energy – methods of analysis and conversion factors. Report of a technical workshop. FAO Food and Nutrition Paper No. 77. Rome. James, W.P.T. & Schofield, E.C. 1990. Human energy requirements. A manual for planners and nutritionists. Oxford, UK, Oxford Medical Publications under arrangement with FAO. WHO. 1985. Energy and protein requirements: Report of a joint FAO/WHO/UNU expert consultation. WHO Technical Report Series No. 724. Geneva. WHO. 1995. Physical status: The use and interpretation of anthropometry. Report of a WHO expert committee. WHO Technical Report Series No. 854. Geneva. 10
  • 18. Energy requirements of infants from birth to 12 months 3. ENERGY REQUIREMENTS OF INFANTS FROM BIRTH TO 12 MONTHS The principle of calculating energy requirements from total energy expenditure (TEE) plus the energy needs for growth applies to infants and children of all ages. However, the previous FAO/WHO/UNU expert consultation (WHO, 1985) estimated the energy requirements of infants from the observed intakes of healthy children growing normally, largely owing to the lack of sufficient information on total energy expenditure. For the last report, data on measurements of infants and children were compiled from studies of infants in Canada, Sweden, the United Kingdom and the United States (Whitehead, Paul and Cole, 1981). Results from developing countries were not included in the analysis “to ensure that the intakes represented those of groups of children who, on the average, were growing along the fiftieth percentile of the WHO reference standard”. An additional 5 percent was added to compensate for a possible methodological bias in the calculation of energy intakes. Scientific information generated in the intervening years has allowed the present consultation to base its estimates and recommendations for infants on energy expenditure plus the energy needs for growth. This assumes that the energy intake of infants is self-regulated and matches energy needs (Fomon, 1974; Dewey and Lönnerdal, 1986). In keeping with the principles followed by preceding expert groups, it was decided to base the analyses, conclusions and recommendations on results of studies carried out on healthy, well-nourished, non-stunted infants born at full term with adequate birth weight, and growing along the trajectory of the WHO reference standards (WHO, 1983). This permits the prescription of dietary recommendations consistent with the optimal growth of healthy, well-nourished infant populations. Special considerations must be made for groups with particular needs, such as undernourished infants and those with low weight or size at birth. 3.1 MEASUREMENT OF TOTAL ENERGY EXPENDITURE The use of the doubly labelled water (DLW) (2H218O) technique to calculate total production of carbon dioxide (CO2) over several days and, from this, total energy expenditure was originally developed for use in small mammals (Lifson, Gordon and McClintock, 1955), and its application was later validated in humans (Schoeller and van Santen, 1982; Klein et al., 1984; Coward et al., 1984). Although questions have been raised about the appropriateness of the assumptions used for the calculation of TEE, DLW is currently considered the most accurate technique for measuring TEE in free-living individuals. TEE measured by this method includes basal metabolism, the metabolic response to food, thermoregulatory needs, physical activity costs, and the energy cost to synthesize growing tissues. Consequently, energy requirements are calculated as the sum of TEE plus the energy deposited as protein and fat in growing tissues and organs. This consultation examined an analysis of 13 studies with DLW performed on a total of 417 healthy, well-nourished, non-stunted infants of from 0 to 12 months of age (Butte, 2001). Eleven investigations were carried out in the United Kingdom (Lucas et al., 1987; Roberts et al., 1988; Davies, Ewing and Lucas, 1989; Wells and Davies, 1995; Wells, Cole and Davies, 1996; Davies et al., 1997), the United States (Butte et al., 1990; Stunkard et al., 1999; Butte et al., 2000b) and the Netherlands (de Bruin et al., 1998), one in Chile (Salazar et al., 2000) and one in China (Jiang et al., 1998). Several studies conducted repeated measurements of TEE at intervals of two to three months, increasing the number of TEE data points to 854. One such study showed that the coefficient of variation among individuals was fairly uniform from three to 24 months of age, ranging from 15 to 21 percent for TEE/day (average: 18 percent), and from 13 to 17 percent for TEE/kg/day (average: 15 percent) (Butte et al., 2000b). The average inter-individual variation was similar to that observed among older children (19 percent for TEE/day, and 17 percent for TEE/kg/day; see section 4.1). 3.2 EQUATIONS TO PREDICT ENERGY EXPENDITURE Longitudinal measurements of TEE with DLW at three-month intervals for the first two years of life on 76 healthy infants (40 breastfed and 36 formula-fed) showed that there is a good linear relationship 11
  • 19. Human energy requirements: Report of a Joint FAO/WHO/UNU Expert Consultation between TEE and body weight (Butte et al., 2000b). TEE was significantly affected by age, gender, weight and length. Age, weight and height were all good predictors of TEE, with a slight advantage for weight. Because the three parameters were highly correlated (r = 0.91 – 0.96), and there were no independent effects of age, gender and length when weight was used as the predictor, the latter was used to develop the following equation (Butte, 2001), which is graphically displayed in Figure 3.1. TEE (MJ/day) = – 0.416 + 0.371 kg; n = 320, r = 0.85, see = 0.456 MJ/day (109 kcal/day) TEE (kcal/day) = – 99.4 + 88.6 kg (n = number of observations; see = standard error of estimate) FIGURE 3.1 Linear relationship and 95 percent confidence and prediction intervals of equation to predict TEE from body weight in healthy infants, one to 24 months old 6000 Linear regression 1400 95% Confidence interval J 5000 J JJ JJ J J 1200 95% Prediction interval J J J J J J J J J J J J J J J J J J J J 1000 TEE (kcal/d) J J J TEE (kJ/d) JJ J J J J 4000 J J J J J JJJ J JJ J J J J JJ J J JJ J J J J J J J J J J J J J J J JJ J JJ J JJ JJ JJ J J J J J JJ J J J J J JJ JJJ JJ J JJJ J J J J J J J J JJ J JJ J J J J JJ J J J J J J J J J 800 JJ JJ J J J JJ J 3000 J J J JJ J J J JJ J J J J J J JJJ J J J J J J J J J JJJJ J J J J J J J J J J JJ J J J JJ JJ JJ J JJ J J J J J J JJ J J JJ J JJ 600 J J J JJ J J J JJJ J J J JJ JJ J JJ JJ J J J J J JJ J JJJ JJ J J J 2000 J J J JJ JJ J J J J J J J J J JJ J J J J J J J J J JJ J J J J J JJ J JJJ JJ J JJ J J J 400 J J J J J J JJ JJ J 1000 200 0 0 4 6 8 10 12 14 Weight (kg) TEE (MJ/d) = – 0.416 + 0.371 kg; n = 320, r = 0.85, see = 0.456 MJ/d (109 kcal/d). TEE (kcal/d) = – 99.4 + 88.6 kg. Source: Butte, 2001. The relationship between TEE and weight in the 13 studies mentioned in Section 3.1 was explored using the mean values for TEE and body weight. Some studies included longitudinal or cross- sectional data at various ages throughout infancy, or from groups of either breastfed or formula-fed infants. A total of 40 sets of TEE and body weight values, weighted for sample size, gave the following linear regression equation, which does not differ significantly from that shown above: TEE (MJ/day) = – 0.399 + 0.369 kg; n = 40, r = 0.99, see = 0.527 MJ/day (126 kcal/day) TEE (kcal/day) = – 95.4 + 88.3 kg As the equation was derived from the mean values of each study, the regression coefficient and standard error of estimate (see) do not reflect individual variation. 3.2.1 Breastfed and formula-fed infants Four studies with breastfed and formula-fed infants showed that the formula-fed infants had higher TEE during the first year of life (Butte et al., 1990; Butte et al., 2000b; Jiang et al., 1998; Davies et al., 1990). Compared with their breastfed counterparts, formula-fed infants had on average 12, 7, 6 and 3 percent higher TEE at three, six, nine and 12 months of age, respectively. At 18 and 24 months, there was no difference between infants who still received breastmilk and those who did not (Butte, 2001). The equations to predict TEE from body weight are as follows: 12
  • 20. Energy requirements of infants from birth to 12 months Breastfed: TEE (MJ/day) = – 0.635 + 0.388 kg; n = 195, r = 0.87, see = 0.453 MJ/day (108 kcal/day) TEE (kcal/day) = – 152.0 + 92.8 kg Formula-fed: TEE (MJ/day) = – 0.122 + 0.346 kg; n = 125, r = 0.85, see = 0.463 MJ/day (110 kcal/day) TEE (kcal/day) = – 29.0 + 82.6 kg 3.3 ENERGY NEEDS FOR GROWTH Growth is a sensitive indicator of whether an infant’s energy requirements are satisfied. Energy demands for growth constitute about 35 percent of the total energy requirement during the first three months of life (40 percent in the first month), this proportion is halved in the next three months (i.e. to about 17.5 percent), and further reduced to one-third of that during the ensuing six months (i.e. to less than 6 percent) and to only 3 percent at 12 months. Energy for growth falls to less than 2 percent of daily requirements in the second year, remains between 1 and 2 percent until mid-adolescence, and gradually disappears by 20 years of age. Energy needs for growth have two components: 1) the energy used to synthesize growing tissues, which is part of the total energy expenditure measured with DLW; and 2) the energy deposited in those tissues, basically as fat and protein, because carbohydrate content is insignificant. Hence, energy requirements in infancy can be calculated by adding the energy deposited in growing tissues to TEE. Much previous knowledge on the energy cost of growth was based on studies in pre-term infants or in children recovering from malnutrition, and used energy balance and the two-component body composition techniques (WHO, 1985; Butte, Wong and Garza, 1989). Methodological advances have allowed a better assessment of body composition changes during infancy through serial measurements of total body electrical conductivity (de Bruin et al., 1998), or with a multi-component body composition model based on measurements of total body water, total body potassium and bone mineral content (Butte et al., 2000a). This permits calculation of the gains in protein and fat, as well as of the corresponding energy deposition assuming that the energy equivalents of protein and fat are 23.6 and 38.7 kJ/g (5.65 and 9.25 kcal/g), respectively. As Table 3.1 shows, energy accrued per gram of weight gain decreased from approximately 26 kJ (6.3 kcal) in the first three months of life to about 10 kJ (2.3 kcal) at nine to 12 months. TABLE 3.1 Protein, fat and energy deposition during growth in the first year of life Age Protein gain Fat mass gain Weight gain Energy accrued in normal growth* months g/d g/d g/d kJ/g kcal/g Boys 0–3 2.6 19.6 32.7 25.1 6.0 3–6 2.3 3.9 17.7 11.6 2.8 6–9 2.3 0.5 11.8 6.2 1.5 9–12 1.6 1.7 9.1 11.4 2.7 Girls 0–3 2.2 19.7 31.1 26.2 6.3 3–6 1.9 5.8 17.3 15.6 3.7 6–9 2.0 0.8 10.6 7.4 1.8 9–12 1.8 1.1 8.7 9.8 2.3 * Energy equivalents: 1 g protein = 23.6 kJ (5.65 kcal); 1 g fat = 38.7 kJ (9.25 kcal). Source: Butte et al., 2000a. 13
  • 21. TABLE 3.2 14 Energy requirements of infants during the first year of life* Age Weight Weight gain Total energy expenditurea Energy depositionb Daily energy requirementc months kg g/d MJ/d kcal/d MJ/d kcal/d MJ/d kcal/d kJ/kg/d kcal/kg/d Boys 0–1 4.58 35.2 1.282 306 0.884 211 2.166 518 473 113 1–2 5.50 30.4 1.623 388 0.764 183 2.387 570 434 104 2–3 6.28 23.2 1.912 457 0.582 139 2.494 596 397 95 3–4 6.94 19.1 2.157 515 0.224 53 2.380 569 343 82 4–5 7.48 16.1 2.357 563 0.189 45 2.546 608 340 81 5–6 7.93 12.8 2.524 603 0.150 36 2.674 639 337 81 6–7 8.30 11.0 2.661 636 0.069 17 2.730 653 329 79 7–8 8.62 10.4 2.780 664 0.065 16 2.845 680 330 79 8–9 8.89 9.0 2.880 688 0.057 14 2.936 702 330 79 9–10 9.13 7.9 2.969 710 0.089 21 3.058 731 335 80 10–11 9.37 7.7 3.058 731 0.087 21 3.145 752 336 80 11–12 9.62 8.2 3.150 753 0.093 22 3.243 775 337 81 Girls 0–1 4.35 28.3 1.197 286 0.746 178 1.942 464 447 107 1–2 5.14 25.5 1.490 356 0.672 161 2.162 517 421 101 2–3 5.82 21.2 1.742 416 0.559 134 2.301 550 395 94 3–4 6.41 18.4 1.960 469 0.285 68 2.245 537 350 84 4–5 6.92 15.5 2.149 514 0.239 57 2.389 571 345 83 5–6 7.35 12.8 2.309 552 0.199 47 2.507 599 341 82 6–7 7.71 11.0 2.442 584 0.083 20 2.525 604 328 78 7–8 8.03 9.2 2.561 612 0.069 17 2.630 629 328 78 8–9 8.31 8.4 2.665 637 0.063 15 2.728 652 328 78 Human energy requirements: Report of a Joint FAO/WHO/UNU Expert Consultation 9–10 8.55 7.7 2.754 658 0.074 18 2.828 676 331 79 10–11 8.78 6.6 2.839 679 0.063 15 2.902 694 331 79 11–12 9.00 6.3 2.920 698 0.060 14 2.981 712 331 79 * Calculated from linear regression analysis of total energy expenditure on weight, plus allowance for energy deposition in tissues during growth. a TEE (MJ/d) = – 0.416 + 0.371 kg (section 3.2). b Weight gain × energy accrued in normal growth (Table 3.1). c Requirement = total energy expenditure + energy deposition. Sources: Butte, 2001. Weight and weight gain data from WHO, 1994.
  • 22. Energy requirements of infants from birth to 12 months 3.4 CALCULATION OF ENERGY REQUIREMENTS Table 3.2 shows the average energy requirements of infants from one to 12 months of age, combining the needs of breastfed and formula-fed infants. TEE was calculated with the predictive linear equations described in section 3.2 and the median weight for age of the WHO pooled breastfed data set (WHO, 1994). The rate of median weight gain at monthly intervals was calculated from the same source. Energy deposited in growing tissues was estimated by multiplying the monthly weight gain by the mean energy accrued in each three-month period (Table 3.1). The sum of TEE and energy deposition is the mean daily energy requirement (in MJ or kcal). It is calculated as energy units per kilogram of body weight, dividing the daily requirement by the median weight at each month of age. Breastmilk is the best food for infants, and exclusive breastfeeding is strongly recommended during the first six months of life, followed by a combination of breastmilk and complementary foods throughout infancy. As TEE is lower among breastfed than formula-fed infants during the first year of life, the energy requirements of breastfed infants are also lower. This is illustrated in Table 3.3, in which requirements are calculated for breastfed and formula-fed infants with the same body weights using the predictive equations described in section 3.2.1. For the purpose of simplicity, the values have been rounded off to the closest 5 kJ/kg/day, or 1 kcal/kg/day. These figures are consistent with the fact that a healthy woman can produce enough milk to provide the energy required by a healthy, exclusively breastfed infant of up to six months of age. TABLE 3.3 Energy requirements of breastfed, formula-fed and all infants* Age Breastfeda Formula-fedb All (breast- and formula-fed)c Months Boys Girls Mean Boys Girls Mean Boys Girls Mean kJ/kg/d 1 445 415 430 510 490 500 475 445 460 2 410 395 405 460 455 460 435 420 430 3 380 375 380 420 420 420 395 395 395 4 330 335 330 360 370 365 345 350 345 5 330 330 330 355 365 360 340 345 345 6 325 330 330 350 355 355 335 340 340 7 320 315 320 340 340 340 330 330 330 8 320 320 320 340 340 340 330 330 330 9 325 320 320 340 340 340 330 330 330 10 330 325 325 340 340 340 335 330 335 11 330 325 325 340 340 340 335 330 335 12 330 325 330 345 340 340 335 330 335 kcal/kg/d 1 106 99 102 122 117 120 113 107 110 2 98 95 97 110 108 109 104 101 102 3 91 90 90 100 101 100 95 94 95 4 79 80 79 86 89 87 82 84 83 5 79 79 79 85 87 86 81 82 82 6 78 79 78 83 85 84 81 81 81 7 76 76 76 81 81 81 79 78 79 8 77 76 76 81 81 81 79 78 79 9 77 76 77 81 81 81 79 78 79 10 79 77 78 82 81 81 80 79 80 11 79 77 78 82 81 81 80 79 80 12 79 77 78 82 81 81 81 79 80 * Numbers rounded to the closest 5 kJ/kg/d, and 1 kcal/kg/d, using the mean body weight and energy deposition in Table 3.1 and the following predictive equations for TEE: a TEE (MJ/kg/d) = (– 0.635 + 0.388 weight) / weight. b TEE (MJ/kg/d) = (– 0.122 + 0.346 weight) / weight. c TEE (MJ/kg/d) = (– 0.416 + 0.371 weight) / weight. 15
  • 23. Human energy requirements: Report of a Joint FAO/WHO/UNU Expert Consultation 3.4.1 Comparison with previous requirements Compared with the values in the 1985 FAO/WHO/UNU report, energy requirements proposed by this consultation are about 12 percent lower in the first three months of life, 17 percent lower from three to nine months, and 20 percent lower from nine to 12 months (Table 3.4 and Figure 3.2). The requirements for breastfed infants are 17, 20 and 22 percent lower than the 1985 estimates at ages 0 to three, three to nine and nine to 12 months, respectively. That the 1985 consultation overestimated requirements of this group had already been suggested from an analysis of 3 573 data points of energy intakes of well-nourished infants recorded after 1980 (Butte, 1996). TABLE 3.4 Comparison of present estimates of energy requirements (kJ/kg/d) of infants with those calculated in the previous (1985) FAO/WHO/UNU report Age Present estimates 1985 % difference from 1985 months All infants Breastfed estimates All infants Breastfed 0–1 460 430 519 -11 -17 1–2 430 405 485 -11 -16 2–3 395 380 456 -13 -17 3–4 345 330 431 -20 -23 4–5 345 330 414 -17 -20 5–6 340 330 404 -16 -18 6–7 330 320 397 -17 -19 7–8 330 320 395 -16 -19 8–9 330 320 397 -17 -19 9–10 335 325 414 -19 -21 10–11 335 325 418 -20 -22 11–12 335 330 437 -23 -24 3.4.2 Basal metabolic rate and physical activity level The 1981 FAO/WHO/UNU expert consultation estimated the energy requirements of adults as multiples of BMR (WHO, 1985). This was later called “physical activity level” (PAL) in a manual commissioned by FAO for the calculation of human energy requirements. PAL is defined as the total energy required over 24 hours divided by the basal metabolic rate over 24 hours (James and Schofield, 1990). The 2001 expert consultation upheld this approach to estimating requirements for adults (section 5). However, the approach must be used with caution or avoided altogether in relation to the energy requirements of infants and young children, as PAL values may cause confusion owing to differences in the factors that determine energy requirements among children and among adults. In non-pregnant, non-lactating women energy requirements are equal to TEE. In children, however, energy requirements are equal to TEE plus energy accrued or deposited during growth (Eg). These differences are quantitatively small after two years of age, when Eg represents less than 1 or 2 percent of the total energy requirement of the child; but they are increasingly larger at less than two years of age. For example, Eg is about 40 and 23 percent of the energy requirement in the first and third months of life, respectively. Consequently, energy requirement expressed as a function of BMR is much higher (i.e. > 2.0 at one month of age and > 1.7 at three months) in comparison with a PAL value (which is based on measured total energy expenditure) of 1.2 and 1.3 respectively. BMR of term infants has been studied extensively producing variable results that range from 180 to 250 kJ/kg/day (43 to 60 kcal/kg/day) (Butte, 2001). This high variability has been attributed to biological differences, mainly in body composition at different stages of infancy, and to differences in methods and experimental conditions. For example, some investigators measured “basal” metabolism in infants who were sleeping spontaneously or under the effect of a sedative, which decreases BMR, and others did the measurements in the fed state, which increases BMR. The 1981 expert consultation endorsed the use of predictive equations to estimate the BMR of children under three years of age, derived from approximately 300 data points obtained by a variety of investigators using different methods and under diverse conditions (Schofield, Schofield and James, 1985). These equations 16