
Empfohlen
Weitere ähnliche Inhalte
Was ist angesagt?
Was ist angesagt? (20)
Ähnlich wie Zuvari cements working capital management
Ähnlich wie Zuvari cements working capital management (20)
Kürzlich hochgeladen
Kürzlich hochgeladen (20)
Zuvari cements working capital management
- 1. 1. INTRODUCTION WORKING CAPITAL MANAGEMENT Any firm, from time to time, employs its short-term assets as well as short-term financing sources to carry out its day to day business. It is this management of such assets as well as liabilities which is described as working capital management. Working capital management is a quintessential part of financial management as a subject. It can also be compared with long-term decision-making the process as both of the domains deal with the analysis of risk and profitability. 1) Definition of Working Capital Working capital is formally arrived at by subtracting the current liabilities from current assets of a firm on the day the balance sheet is drawn up. Working capital is also represented by a firm’s net investment in current assets necessary to support its everyday business. Working capital frequently changes its form and is sometimes also referred to as circulating capital. According to Gretsenberg: “circulating capital means current assets of a company that are changed in the ordinary course of business from one form to another.” 2) Types of working capital Working capital, as mentioned above, can take different forms. For example, it can take the form of cash and then change to inventories and/or receivables and back to cash. • Gross and Net Working Capital: The total of current assets is known as gross working capital whereas the difference between the current assets and current liabilities is known as the net working capital. • Permanent Working Capital: This type of working capital is the minimum amount of working capital that must always remain invested. In all cases, some amount of cash, stock and/or account receivables are always locked in. These assets are necessary for the firm to carry out its day to day business. Such funds are drawn from long term sources and are necessary for running and existence of the business. •Variable Working Capital: Working capital requirements of a business firm might increase or decrease from time to time due to various factors. Such variable funds are drawn from short-term sources and are referred to as variable working capital.
- 2. 3) Objectives of working capital management The main objectives of working capital management are: • Maintaining the working capital operating cycle and to ensure its smooth operation. Maintaining the smooth operation of the operating cycle is essential for the business to function. The operating cycle here refers to the entire life cycle of a business. From the acquisition of the raw material to the smooth production and delivery of the end products – working capital management strives to ensure smoothness, and it is one of the main objectives of the concept. • Mitigating the cost of capital. Minimizing the cost of capital is another very important objective that working capital management strives to achieve. The cost of capital is the capital that is spent on maintaining the working capital. It needs to be ensured that the costs involved for maintenance of healthy working capital are carefully monitored, negotiated and managed. • Maximising the return on current asset investments. Maximising the return on current investments is another objective of working capital management. The ROIon currently invested assets should be greater than the weighted average cost of the capital so that wealth maximization is ensured. THE WORKING CAPITAL CYCLE The working capital cycle refers to the minimum amount of time which is required to convert net current assets and net current liabilities into cash. From a more simplistic viewpoint, working capital cycle is the amount of time between the payment for goods supplied and the final receipt of cash accumulated from the sale of the same goods. There are mainly the following elements of which the working capital cycle is comprised of: Cash The cash refers to the funds available for the purchase of goods. Maintaining a healthy level of liquidity with some buffer is always a best practice. It is extremely important to maintain a reserve fund which can be utilized when: •There is a shortage of cash inflow for some reason. In the absence of reserve cash, the day to day business will get hampered. •Some new opportunity springs up. In such a case, the absence of reserve cash will pose a hindrance.
- 3. •In case of any contingency, absence of a reserve fund can cripple the company and poses a threat to the solvency of the firm. Creditors and Debtors • The creditors refer to the accounts payable. It refers to the amount that has to be paid to suppliers for the purchase of goods and /or services. • Debtors refer to the accounts receivables. It refers to the amount that is collected for providing goods and/or services. Inventory Inventory refers to the stock in hand. Inventories are an integral component of working capital and careful planning, and proper investment is necessary to maintain the inventory in a healthy state of affairs. Management of inventory has two aspects and involves a trade-off between cost and risk factors. Maintaining a sizable inventory has its accompanying costs that include locking of funds, increased maintenance and documentation cost and increased cost of storage. Apart from these things, there is also a chance of damage to the stored goods. On the other hand, maintaining a small inventory can disrupt the business lifecycle and can have serious impacts on the delivery schedule. As a result, it is extremely important to maintain the inventory at optimum levels which can be arrived at after careful analysis and a bit of experimentation. Properties of a healthy working capital cycle It is essential for the business to maintain a healthy working capital cycle. The following points are necessary for the smooth functioning of the working capital cycle: •Sourcing of raw material: Sourcing of raw material is the beginning point for most businesses. It should be ensured that the raw materials that are necessary for producing the desired goods are available at all times. In a healthy working capital cycle, production ideally should never stop because of the shortage of raw materials. •Production planning: Production planning is another important aspect that needs to be addressed. It should be ensured that all the conditions that are necessary for the production to start are met. A carefully constructed plan needs to be present in order to mitigate the risks and avert unforeseen issues. Proper planning of production is essential for the production of goods or services and is one of the basic principles that must be followed to achieve smooth functioning of the entire production lifecycle.
- 4. •Selling: Selling the produced goods as soon as possible is another objective that should be pursued with utmost urgency. Once the goods are produced and are moved into the inventory, the focus should be on selling the goods as soon as possible. • Payouts and collections: The accounts receivables need to be collected on time in order to maintain the flow of cash. It is also extremely important to ensure timely payouts to the creditors to ensure smooth functioning of the business. • Liquidity: Maintaining the liquidity along with some room for adjustments is another important aspect that needs to be kept in mind for the smooth functioning of the working capital cycle. APPROACHES TO WORKING CAPITAL MANAGEMENT The short-term interest rates are, in most cases, cheaper compared to their long-term counterparts. This is due to the amount of premium which is higher for short term loans. As a result, financing the working capital from long-term sources means more cost. However, the risk factor is higher in case of short term finances. In case of short-term sources, fluctuations in refinancing rates are a major cause for concern, and they pose a major threat to business. There are mainly three strategies that can be employed in order to manage the working capital. Each of these strategies takes into consideration the risk and profitability factors and has its share of pros and cons. The three strategies are: •The Conservative Approach: As the name suggests, the conservative strategy involves low risk and low profitability. In this strategy, apart from the permanent working capital, the variable working capital is also financed from the long-term sources. This means an increased cost capital. However, it also means that the risks of interest rate fluctuations are significantly lower. •The Aggressive Approach: The main goal of this strategy is to maximize profits while taking higher risks. In this approach, the entire variable working capital, some parts or the entire permanent working capital and sometimes the fixed assets are funded from short-term sources. This results in significantly higher risks. The cost capital is significantly decreased in this approach that maximizes the profit. •The Moderate or the Hedging Approach: This approach involves moderate risks along with moderate profitability. In this approach, the fixed assets and the permanent working capital are financed from long-term sources whereas the variable working capital is sourced from the short-terms sources.
- 5. SIGNIFICANCE OF ADEQUATE WORKING CAPITAL Maintenance of adequate working capital is extremely important because of the following factors: • Adequate working capital ensures sufficient liquidity that ensures the solvency of the organisation. • Working capital ensured prompt and on-time payments to the creditors of the organisation that helps to build trust and reputation. • Lenders base their decisions for approving loans based on the credit history of the organisation. A good credit history can not only help an organisation to get fast approvals but also can result in reduced interest rates. • Earning of profits is not a sufficient guarantee that the company can pay dividends in cash. Adequate working capital ensures that dividends are regularly paid. • A firm maintaining adequate working capital can afford to buy raw materials and other accessories as and when needed. This ensures an uninterrupted flow of production. Adequate working capital, therefore, contributes to the fuller utilisation of resources of the enterprise. FACTORS FOR DETERMINING THE AMOUNT OF WORKING CAPITAL NEEDED Factoring out the amount of working capital needed for running a business is an extremely important as well as difficult task. However, it is extremely critical for any firm to estimate this figure so that it can operate smoothly and be fully functional. There are several factors that need to be considered before arriving at a more or less accurate figure. The following are some of those factors that determine the amount of liquid cash and assets required for any firm to operate smoothly: • Nature of business: A trading company requires large working capital. Industrial companies may require lower working capital. A banking company, for example, requires the maximum amount of working capital. Basic and key industries, public utilities, etc. require low working capital because they have a steady demand and continuous cash-inflow to meet current liabilities. • Size of the business unit: The amount of working capital depends directly upon the volume of business. The greater the size of a business unit, the larger will be the requirements of working capital.
- 6. •Terms of purchase and terms of sale: Use of trade credit may lead to lower working capital while cash purchases will demand larger working capital. Similarly, credit sales will require larger working capital while cash sales will require lower working capital. •Turnover of inventories: If inventories are large and their turnover is slow, we shall require larger capital but if inventories are small and their turnover is quick, we shall require lower working capital. •Process of manufacture: Long-running and more complex process of production requires larger working capital while simple, short period process of production requires lower working capital. •Importance of labour: Capital intensive industries e.g. mechanized and automated industries generally require less working capital while labour intensive industries such as small scale and cottage industries require larger working capital.
- 7. 2. COMPANY PROFILE ZUVARI CEMENTS LIMITED Strong foundations for a company of strength. Zuari entered the Cement business in 1994 to operate the Texmaco Cement Plant. In 1995, Texmaco's Plant at Yerraguntla was taken over by Zuari and a Cement Division was formed. The fledging unit came into its own in the year 2001 when Zuari Industries entered into a Joint Venture with the Italcementi Group, the 5th largest producer of Cement in the world, Zuari Cement Limited was born. Zuari Cement took over Sri Vishnu Cement Limited in 2002. Today, the Company is amongst the topmost cement produces in South India. Cement Plant Area: Telangana Annual Production: 3.5 million tonnes of cement Owner: Zuari Cement Limited Shareholders: Italcementi Group Activity Since: 1986 Contact Coordinates: 16.831664,80.036619 Address: PO Dondapadu, Nalgonda District, 508 246 Telangana Email: svclspm@zcltd.com Phone: +91 (8683) 235 107 Web: http://www.zuaricements.com Wikipedia: http://en.wikipedia.org/wiki/Italcementi
- 8. Zuari and Italcementi. The strength of two Zuari Cement is one of the leading cement producers in South India.A fully owned subsidiary of the Italcementi Group, Commitment to customer satisfaction has seen Zuari Cement grow from a modest 0.5 million tonne capacity in 1995 to almost 6 million tones in 2010,and earned a place among the most reliable cement producers in the country. Italcementi Group History Founded in 1864, Italcementi was quoted for the first time on the stock markets, at the Milan Stock Exchange, in 1925, under the name of "Societa Bergamasca per la Fabbricazione del Cemento e della Calce Idraulica" and has been operating since 1927 under the name of Italcementi Spa. Thanks to a careful plan of investments and take-overs of other cement producers, the company expanded, quickly reaching a strong position on the market and becoming the leading cement manufacturer in Italy. After several acquisitions abroad, in 1992 Italcementi achieved important international status with its take-over of Ciments Français, one of the main global cement producer. In 1997 Italcementi consolidated its verticalisation strategy with the acquisition of Calcestruzzi, thus becoming Italian leader in the ready-mixed concrete sector. In March 1997, all the international companies of the Group gathered under one single corporate identity. Since 1998 Italcementi Group has been pursuing its internationalisation strategy by acquiring new cement works in Bulgaria, Kazakhstan, Thailand, Morocco, India, Egypt and the United States.
- 9. CEMENT INDUSTRIES IN INDIA Introduction India, being the second largest cement producer in the world after China with a total capacity of 151.2 Million Tones (MT), has got a huge Cement Company. With the government of India giving boost to various infrastructure projects, housing facilities and road networks, the cement industry in India is currently growing at an enviable pace. More growth in the Indian cement industry is expected in the coming years. The cement industry in India is dominated by around 20 companies, which account for almost 70% of the total cement production in India. India's cement industry is a vital part of its economy, providing employment to more than a million people, directly or indirectly. Ever since it was deregulated in 1982, the Indian cement industry has attracted huge investments, both from Indian as well as foreign investors. India has a lot of potential for development in the infrastructure and construction sector and the cement sector is expected to largely benefit from it. Some of the recent major initiatives such as development of 98 smart cities are expected to provide a major boost to the sector. Expecting such developments in the country and aided by suitable government foreign policies, several foreign players such as Lafarge-Holcim, Heidelberg Cement, and Vicat have invested in the country in the recent past. A significant factor which aids the growth of this sector is the ready availability of the raw materials for making cement, such as limestone and coal.
- 10. Market Size The housing sector is the biggest demand driver of cement, accounting for about 67 per cent of the total consumption in India. The other major consumers of cement include infrastructure at 13 per cent, commercial construction at 11 per cent and industrial construction at 9 per cent. India’s total cement production capacity is nearly 425 million tonnes, as of September 2017. The growth of cement industry is expected to be 6-7 per cent in 2017 because of the government’s focus on infrastructural development. The industry is currently producing 280 MT for meetings its domestic demand and 5 MT for exports requirement. The country's per capita consumption stands at around 225 kg. The Indian cement industry is dominated by a few companies. The top 20 cement companies account for almost 70 per cent of the total cement production of the country. A total of 210 large cement plants account for a cumulative installed capacity of over 350 million tonnes, with 350 small plants accounting for the rest. Of these 210 large cement plants, 77 are located in the states of Andhra Pradesh, Rajasthan and Tamil Nadu.
- 11. Investments On the back of growing demand, due to increased construction and infrastructural activities, the cement sector in India has seen many investments and developments in recent times. According to data released by the Department of Industrial Policy and Promotion (DIPP), cement and gypsum products attracted Foreign Direct Investment (FDI) worth US$ 5.25 billion between April 2000 and December 2017. Some of the major investments in Indian cement industry are as follows: Ultratech Cement has purchased a 98.47 per cent stake in Binani Cements for Rs 7,266 crore (US$ 1.12 billion). The deal will help Ultratech achieve greater capacity and markets its product in north-India. JK Cement is planning to invest Rs 1,500 crore (US$ 231.7 million) over the next 3 to 4 years to increase its production capacity at its Mangrol plant from 10.5 MTPA to 14 MTPA. Government Initiatives In order to help the private sector companies thrive in the industry, the government has been approving their investment schemes. Some such initiatives by the government in the recent past are as follows: The State Government of Chattisgarh has auctioned one block of Limestone (Kesla II) in Raipur District having estimated reserves of 215 million tonnes valued at Rs 10,367 crore (US$ 1.61 billion), and would earn a cumulative revenue of Rs 11,894 crore (US$ 1.85 billion) to State Government over the lease period. In Budget 2018-19, Government of India announced setting up of an Affordable Housing Fund of Rs 25,000 crore (US$ 3.86 billion) under the National Housing Bank (NHB) which will be utilised for easing credit to homebuyers. The move is expected to boost the demand of cement from the housing segment.
- 12. Road Ahead The eastern states of India are likely to be the newer and virgin markets for cement companies and could contribute to their bottom line in future. In the next 10 years, India could become the main exporter of clinker and gray cement to the Middle East, Africa, and other developing nations of the world. Cement plants near the ports, for instance the plants in Gujarat and Visakhapatnam, will have an added advantage for exports and will logistically be well armed to face stiff competition from cement plants in the interior of the country. Due to the increasing demand in various sectors such as housing, commercial construction and industrial construction, cement industry is expected to reach 550-600 Million Tonnes Per Annum (MTPA) by the year 2025. A large number of foreign players are also expected to enter the cement sector, owing to the profit margins and steady demand. In future, domestic cement companies could go for global listings either through the FCCB route or the GDR route. With help from the government in terms of friendlier laws, lower taxation, and increased infrastructure spending, the sector will grow and take India’s economy forward along with it. An Overview of Cement Industry The history of the cement industry in India dates back to the 1889 when a Kolkata- based company started manufacturing cement from Argillaceous. But the industry started getting the organized shape in the early 1900s. In 1914, India Cement Company Ltd was established in Porbandar with a capacity of 10,000 tons and production of 1000 installed. The World War I gave the first initial thrust to the cement industry in India and the industry started growing at a fast rate in terms of production, manufacturing units, and installed capacity. This stage was referred to as the Nascent Stage of Indian Cement Company. In 1927, Concrete Association of India was set up to create public awareness on the utility of cement as well as to propagate cement consumption. The cement industry in India saw the price and distribution control system in the year 1956, established to ensure fair price model for consumers as well as manufacturers. Later in 1977, government authorized new manufacturing units (as well as existing units going for capacity enhancement) to put a higher price tag for their products. A couple of years later,
- 13. government introduced a three-tier pricing system with different pricing on cement produced in high, medium and low cost plants. Cement Company, in any country, plays a major role in the growth of the nation. Cement industry in India was under full control and supervision of the government. However, it got relief at a large extent after the economic reform. But government interference, especially in the pricing, is still evident in India. In spite of being the second largest cement producer in the world, India falls in the list of lowest per capita consumption of cement with 125 kg. The reason behind this is the poor rural people who mostly live in mud huts and cannot afford to have the commodity. Despite the fact, the demand and supply of cement in India has grown up. In a fast developing economy like India, there is always large possibility of expansion of cement industry. Technology Up-gradation Cement industry in India is currently going through a technological change as a lot of upgradation and assimilation is taking place. Currently, almost 93% of the total capacity is based entirely on the modern dry process, which is considered as more environment-friendly. Only the rest 7% uses old wet and semi-dry process technology. There is also a huge scope of waste heat recovery in the cement plants, which lead to reduction in the emission level and hence improves the environment. Major Players in Indian Cement Industry There are a number of players prevailing in the cement industry in India. However, there are around 20 big names that account for more than 70% of the total cement production in India. The total installed capacity is distributed over around 129 plants, owned by 54 major companies across the nation.
- 14. Following are some of the major names in the Indian cement industry: Mergers and Acquisitions in Cement Industry in India UltraTech Cement is going to absorb its sister concern Samruddhi Cement to become biggest cement company in India. World's leading foreign funds like HSBC, ABN Amro, Fidelity, Emerging Market Fund and Asset Management Fund have together bought 7.5% of India Cements (ICL) at a cost of US$ 124.91 million. Cimpor, a Cement company of Portugal, has bought 53.63% stake that Grasim Industries had in Shree Digvijay Cement. French cement company Vicat SA bought 6.67% share of Sagar Cement at a cost of US$ 14.35 million. Holcim now holds 56% stake of Ambuja Cement. Previously it held 22% of stake. The company utilized various open market transactions to increase its stakes. It invested US$ 1.8 billion for that.
- 15. Recent Investments in the Indian Cement Industry In a recent announcement, the second largest cement company in South India, Dalmia Cement declared that it's going to invest more than US$ 652.6 million in the next 2-3 years to add 10 MT capacity. Anil Ambani-led Reliance Infrastructure is going to build up cement plants with a total capacity of yearly 20 MT in the next 5 years. For this, the company will invest US$ 2.1 billion. India Cements is going to set up 2 thermal power plants in Andhra Pradesh and Tamil Nadu at a cost of US$ 104 billion. Anil Ambani-led Reliance Cementation is also going to set up a 5 MT integrated cement plant in Maharashtra. It will invest US$ 463.2 million for that. Jaiprakash Associates Ltd has signed a MoU with Assam Mineral Development Corporation Limited to set up a 2 MT cement plant. The estimated project cost is US$ 221.36 million. Rungta Mines (RML) is also planning to invest US$ 123 million for setting up a 1 MT cement plant in Orissa.
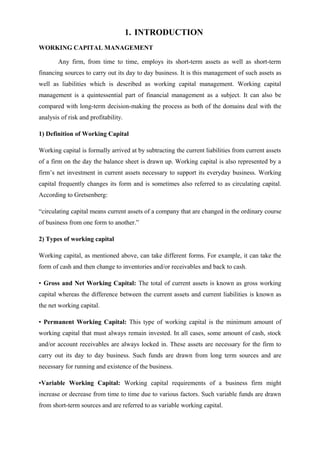
- 16. MANUFACTURING PROCESS The basic raw-materials required for manufacturing cement are lime-stone, iron-ore, laterite, slag, fly ash and gypsum. Limestones of the size 1 Sq.m to 2 Sq.m are obtained from mine by drilling and blasting. These lumps are then loaded into Dumpers through excavators and are transported to the crusher. Before entering crusher the usable material coming alone with the limestone are screened out by means of Grizzly Feeders, thus allowing only limestone to pass through the crusher. The material is crushed to a size of 80 mm by impactor type of crusher and then transported for Pre blending stock pile. From this stock pile, the material is reclaimed to a separate hopper . Laterite and iron- ore, the other two raw-materials are stored in separate hoppers. The three components according to the required proportions are fed into Raw Mill for grinding. The finished fine ground material is termed “Raw Meal”. This Raw Meal is stored in a continuous flow Silo for homogeneous blending. The material from C.F.Silo is extracted and fed to Kiln through Pre Heaters by means of an Air lift. This material is pre heated and calcinated to nearly 900 C . The material is again burnt in kiln to a temperature of 1400 C into a modular form which is called “Clinker”. The major fuel used for heating is Coal and pet coke. Fuel is stored in Gantry, from where it is conveyed to a crusher to reduce the size and stored in Intermediate Hopper. From the hopper the fuel is transported to Coal Mill where it is ground to fine powder. This powder is stored in the Bins from where it is extracted for firing. Rise husk is also used as fuel. Clinker from the Silos is extracted and ground in Cement Mill along with the prescribed quantum of gypsum to make ‘Ordinary Portland Cement (OPC)’. Slag is pulverised in a vertical roller mill and stored in a separate silo. The ground OPC is mixed with fly ash and /or pulverised slag in a paddle mixer. The finished product thus obtained is “Portland Slag Cement/Pozzolana Portland Cement”. Cement is stored in silo and is extracted at the time of packing of or sold as bulk cement. The packed cement is loaded in Lorries through Belt conveyors and bulk cement is loaded by using compressed
- 17. Fig.1. Manufacturing Process Fig.2.Klin System
- 18. 3. CONCEPTUAL FRAME WORK Working capital management is the way a company manages the relationship between assets and liabilities in the short term. Simply put, working capital management is how a company manages its money for day to day operations as well as any immediate debt obligations. When managing working capital, the company has to manage accounts receivable, accounts payable, inventory, and cash. The goal of working capital management is to have adequate cash flow for continued operations and have the most productive usage of resources. The capital required for a business may be classified into Fixed capital Working capital Fixed capital required for a acquisition of a long term assets which are called fixed assets is termed as fixed capital, the amounts invested in these assets get blocked up for a long period. Examples are land, buildings, plant and machinery, furniture etc. These assets are purchased to facilitate production and sale, they are not respected to be converted into cash. Working capital business also requires funds for purchasing raw materials for paying day to day expenses such as wages, salaries, rent, taxes, electricity bills etc. Goods purchased must be paid for in cash but the firm cannot immediately sell them and get cash because there is a time gap between purchased and sale funds required for purchase of raw materials and to meet the day to day expenses is called the working capital of a firm. Concepts of working capital: The term working capital is understood in two different ways Gross working capital Net working capital To understand the concepts of working capital it is necessary to understand what are current assets and current liabilities. Current assets are those assets which can be easily converted into cash within the period of one year and those which are required to meet the day to day operations they include cash and bank balances, marketable securities, sundry debtors, bills
- 19. receivables, work in progress, finished goods, prepaid expenses, income accrued but not received etc. Current liabilities refer to those liabilities, which the amounts due to be paid to creditors with in twelve months. Gross working capital is the sum total of all the current assets of the company. Net working capital is the difference between current assets and current liabilities. Net working capital = Current assets – Current liabilities As the current liabilities are expected to be repaid within one year, the currents should be larger than the current liabilities so that they can be repaid on time. The excess of current assets over current liabilities i.e. the net working capital indicates the part of current assets financed by long term sources. APPROACHES OF WORKING CAPITAL MANAGEMENT Working capital Aggressive Moderate conservative a) Aggressive: Here investment in working capital is kept at minimal investment in current assets which means the entity doesn’t hold lower level of inventory, follow strict credit policy, keeps less cash balance etc. The advantage of this approach is that lower level of fund is tied in the working capital which results in lower working cost. In the long run firm stays behind the competitors b) Conservative: Here in this approach of organisation used to invest high capital in current assets. Organisations used to keep inventory high level, follows liberal credit policies, and cash balance as high as to meet any current liabilities immediately. The advantages of this approach are higher sales volume, increased demand due to liberal credit policy and increase good will among the suppliers due to payment in short time. The disadvantages are increased cost of capital, higher risk of bad debts, shortage o liquidity in long run to longer operating cycles.
- 20. c) Moderate: This approach is in between the above two approaches. Under this approach a balance between the risk and return is maintained to gain more by using the funds in very efficient manner. CURRENT ASSET TO FIXED ASSET RATIO: Te finance manager is required to determine the optimum level of current assets so that the shareholders value is maximised. A firms needs fixed and current assets to support a particular level of output, as the firm output and sales increase the need for current assets also increased. The level of current assets can be measured by creating a relationship between current assets and fixed assets. Assuming constant level of fixed assets, a higher ratio indicates a conservative current assets policy and a lower ratio means an aggressive current assets policy assuming all factors to be constant. A conservative policy implies greater liquidity and lower risk whereas an aggressive policy indicates higher risk and poor liquidity. Moderate current policy will fall in the middle of
- 21. conservative and aggressive policies. The current assets policy of the most of the firms may fall between these two extreme policies. DETERMINANTS OF WORKING CAPITAL Determinants of working capital are as follows: 1. Nature and Size of Business: The working capital requirements of a firm are basically influenced by the nature if business. Trading and financial firms have very less investment in fixed assets, by required large some of money to be invested in working capital e.g. Retailer stores must carry large stocks of variety of goods to satisfy the varied and continuous demand of their customers. 2. Business Fluctuations: Most firms experience seasonal and cyclical fluctuations in the demand for their products and services. These business variations affect the working capital requirement when there is an upward swing in the (company) economy sales will increase, correspondingly the firm’s investment in inventories and book debts will also increase. Under boom additional investment in fixed assets may be made by some firms. 3. Product policy: We just notes that a strategy if constant productions may be maintained in order to resolve the working capital problems arising due to seasonal changes in the demand for the firm’s product. A steady production policy will cause inventories to accumulate during the off-season periods and the firm will be exposed to greater inventory costs. 4. Firm’s Credit Policy: The credit policy of the firms affects working capital by influencing the level of book debts. A liberal credit policy without rating the credit worthiness of the customers will be determine centre to the firm and will create a problem of collecting funds later on. The firms should be prompt in collecting funds.
- 22. 5. Availability of credit: The working capital requirements of a firm are also attested by the availability of credit. A firm will needs less working capital if liberal credit terms are available to it. Similarly the availability of credit form banks also influences the working capital needs of the firm. A firm which can get bank credit easily on favourable conditions will operate with less working capital. 6. Growth and Expansion Activities: The working capital needs or requirements of a firm will also influence by the growth and expansion activities i.e. Grows in terms of sales or fixed assets. It is difficult to precisely determine the relationship between volume of sales and the working capital needs. The critical fact however that is the need for increased working capital funds does not follow growth in business activities but precedes it. 7. Profit Margin and Appropriation: Profit margin as well as profit appropriation is varying from business to business. Some firm’s entry dominant position, due to quality product or good marketing management or monopoly power in the market trend earns a higher profit margin. 8. Price Level Changes: Price level changes are also influences the working capital requirements of a firm. The increasing shift in price level makes the function of financial manager difficult. He should anticipate the offer of the poise level changes on working capital requirements of the firm. Generally rising price level will require a firm to maintain higher amount of working capital. 9. Operating Efficiency: Operating efficiency of the firm relates to the optimum utilization of resources as minimum costs. The firm will be effective contributing to its working capital if it is efficient in controlling the operating costs. The use of working capital is improve and pace of cash cycle is accelerated with operating efficiency. Better utilization of resources improves profitability.
- 23. ADEQUATE WORKING CAPITAL: The working capital should be adequate. That means it should not be neither excessive nor in sufficient. It should be optimal or adequate. Advantages of adequate working capital Working capital is the lifeblood and nerve centre of business. Just as circulation of blood is essential in the human body for maintaining life, working .capital is very essential to maintain the smooth running of a business. No business can run successfully without an adequate amount of working capital. The main advantages of maintaining adequate amount of working capital are as follows: 1. Solvency of the business: Adequate working capita! helps in maintaining solvency of the business by providing uninterrupted flow of production. 2. Goodwill: sufficient working capital enables a business concern to make prompt payments and hence helps in creating and maintaining goodwill. 3. Easy loans: A concern having adequate working capital, high solvency and good credit standing can arrange loans from banks and others on easy and favourable terms. 4. Cash Discounts: adequate working capital also enables a concern to avail a cash discounts on the purchases and hence it reduces cost 5. Regular payment of salaries & wages and other day-to-day commitments company which has ample working capital can make regular payment of salaries, wages and other day-to-day commitments which raises the morale of its employees, increases their efficiency, reduces wastage's and costs and enhances production and profits. 6. Supply of raw materials and continuous production. 7. Quick and regular return on Investments: Every Investor wants a quick and regular return on investments. Sufficient of working capital enables a concern to pay
- 24. quick and regular dividends to its investors, as there may not be much pressure to plough back profits. This gains the confidence of its investors and creates a favourable market to raise additional funds in the future. INADEQUATE WORKING CAPITAL: The working capital which is less than the requirement is called inadequate working capital. Due to this inadequate working capital company faces some problems .So Company has to maintain sufficient working capital Disadvantages of inadequate working capital: The following are the disadvantages. • It stagnates growth. It becomes difficult for the firm to undertake profitable projects for non availability of working capital funds. • Difficult to implement operating plans and achieve the firm’s profit target. • Operating-in-efficiency creep in when it becomes difficult to meet day to day commitments. • Fixed assets are not efficiently utilized. • The firm loses its reputation when it is not in position to honour its short term obligations. EXCESSIVE WORKING CAPITAL: The working capital which is more than the requirement is called as excessive working capital. Disadvantages of excessive working capital Every business concern should have adequate working capital to run its business operations. It should have neither redundant or excessive working capital nor inadequate nor shortage of working capital. Both excessive as well as short working capital positions are bad for any business.
- 25. 1. Excessive working capital means idle funds which earn no profits for the business and hence the business cannot earn a proper rate of return on its investments. 2. When there is redundant working capital, it may lead to unnecessary purchasing and accumulation of inventories causing more chances of theft, waste and losses. 3. Excessive working capital implies excessive debtors and defective credit policy, which may cause higher incidence of bad 4. It may result into overall inefficiency in the organization. 5. When there is an excessive working capital relation with the banks and other financial institutions may not be maintained. 6. Due to low rate of return on investments the value of shares may also fall WORKING CAPITAL CYCLE/OPERATING CYCLE AND LIQUIDITY MANAGEMENT The duration of time required to complete the following sequence of events. In case of a manufacturing firm, is called an “operating cycle” or “working capital” cycle. 1. Conversion of cash in to raw materials. 2. Conversion of raw materials into work in process. 3. Conversion of work in process in to the finished goods. 4. Conversion of finished goods in it debtors and bills receivables through sale. 5. Conversion of debtors and bills receivables in to cash.
- 26. Most business cannot finance the operating cycle (accounts receivable days +inventory days) with accounts payable financing alone consequently, working capital financing is needed. This shortfall is typically covered by the net profits generated internally or externally borrowed funds are by combination of the two. The faster a business expands the more cash it will need for working capital and investments. The cheapest and best and best sources of cash exist as working capital right with in business. Good management of working capital will generate cash which will help improve profits and reduce risks. The determination of operating capital cycle helps in the forecast, control and management of working capital. The length of operating cycle is the indicator of performance of management. The net operating cycle represents the time interval for which the firm has to negotiate for working capital from its bankers. It enables to determine accurately the amount of working capital needed for the continuous operation of business activities. The duration of working capital cycle may vary depending on the nature of the business. In equation form of working capital cycle/operating cycle can be expressed as follows: Operating cycle = R + W + F + D – C Where R = Raw material storage period W = Working-in-progress holding period F = Finished goods storage period D = Debtors collection period C = Credit period allowed by creditors Operating Cycle of Non-manufacturing Firm: Cash Stock of finished goods Debtors
- 27. Operating cycle of service a financial firm: Some service and financial concerns may not have any inventory at our, such, firms have shortest operating cycle such as shown in above fissure. As will as the non-manufacturing phase. Rather they will have direct conversion of cash into stock of finished goods in to debtors and them into cash. Estimation of current assets: The various constituents of current assets and current liabilities have a direct bearing on the computation of working capital and the operating cycle. The holding period of various constituents of current assets and current liabilities cycle may either contract or expand the net operating cycle period. Shorter the operating cycle period, lower will be the requirement of working capital and vice- versa. Estimation of current liabilities: Current liabilities are deducted from the current assets to get working capital. Hence the amount of working capital is lower to the extent of current liabilities arising from the normal course of period. A company’s working capital is the capital necessary for it to function on a daily basis, as it requires a certain amount of cash on hand to cover unexpected costs, make regular payments and buy raw materials used in production. Working capital is the difference between the company’s current assets and current liabilities. The working capital ratio, calculated by dividing current assets by current liabilities, indicates to analysts the company’s liquidity, or whether it has cash flow adequate enough to meet all of its short-term liabilities and expenses. Creditors Cash Debtors
- 28. For a company liquidity essentially measures its ability to pay off its liabilities when they are due, or how easily and effectively the company can access the money it needs to cover its debts. Working capital reflects the liquid assets a company utilizes to make such debt payments. The firm's ability to pay short-term debt and expenses (aka current liabilities) within the one-year operating cycle is its liquidity. Balance Sheet asset accounts are listed in order of liquidity. The first category of current assets addresses items that can be converted into cash within the normal one-year operating cycle. Total assets are funded through liabilities or stockholders' equity. Current liabilities, which must be paid within one year, are paid out of current assets. Noteworthy current assets, in addition to cash, include Marketable Securities, Accounts Receivable, Inventory, finished goods, Prepaid Expenses, Investments and Plant and Equipment less Accumulated Depreciation. Liabilities revert from current liabilities to long- term debt, if not satisfied within one year. Short-term liability obligations include Accounts Payable, Short-Term Debt, and Accrued Expense. A significant amount of working capital indicates healthy levels of liquidity. CASH CONVERSION CYCLE (CCC) The Cash Conversion Cycle, or cash cycle, is a measure of working capital efficiency relative to the firm's short-term financial plan. The Cash Conversion Cycle measures the average number of days working capital is tied up in operations. The Cycle: 1. Starts with ordering materials for inventory (DIO) production on credit (no immediate cash flow) 2. Wages will accrue (not fully-paid at the time work is performed) 3. The finished product is sold on credit 4. The company pays for materials and wages (accounts payable (DPO) – net cash outflow must be financed, since it is paid before receiving any cash profit from sales 5. The cycle is completed when receivables have been collected, the company can pay off its credit used to finance production, and optimistically, a profit is realized. A firm's liquidity is calculated using current assets and current liabilities.
- 29. • Low liquidity indicates poor management or financial problems. • A relatively high liquidity ratio is good. • Too high liquidity ratio indicates excess funds, which incur an opportunity cost that could be invested to gain a higher return. The firm's liquidity may be calculated using the liquidity ratios and working capital ratios. LIQUIDITY RATIOS: The liquidity ratio, then, is a computation that is used to measure a company's ability to pay its short-term debts. There are three common calculations that fall under the category of liquidity ratios. The current ratio is the most liberal of the three. It is followed by the acid ratio, and the cash ratio. These three ratios are often grouped together by financial analysts when attempting to accurately measure the liquidity of a company. 1. Current Ratio: Current ratio evaluates the ability of a company to pay short term obligations using current assets such as cash, marketable securities, current receivables, inventory, and prepayments. Current ratio can be used to take rough measurement of company’s financial health. The higher the current ratio the more capable the company is of its obligations, as it has the larger proportion of asset value relative to the value of its liabilities. While a current ratio below 1 show that a company is not in good financial health, it doesn’t necessarily mean that it will go bankrupt, they are many ways to access financing. Current ratio is obtained when current liabilities are divided with current assets.
- 30. Current ratio = current assets/ current liabilities Acceptable ratio of current ratio is 2:1 2. Acid test Ratio / Quick Ratio: This ratio is also referred to as the quick ratio. The purpose of this ratio is to measure how well a company can meet its short-term obligations with its most liquid assets. Remember, liquid assets are those that can be quickly turned into cash. Most of the current assets are highly liquid with the exception of inventory, which often takes a longer amount of time to turn into cash. It adjusts the current ratio to eliminate the all assets which are not already in cash or near from cash. The formula for calculating the acid ratio is: Quick Ratio = current assets - Inventory Current liabilities Acceptable quick ratio is 1:1, less than acceptable ratio indicates danger signal. 3. Cash Ratio: Cash ratio also known as Absolute liquidity ratio. Measures the ability of a company to pay its current liabilities using cash and marketable securities. Marketable securities are short-term debt instruments that are as good as cash. It eliminates unknown surrounding receivables. The calculation of cash ratio is as follows: Cash Ratio = cash + Marketable securities Current Liabilities WORKING CAPITAL RATIOS:
- 31. Working capital ratios or activity ratios are financial analysis tools used to measure a business' ability to convert its assets into cash. The faster a business is able to convert its assets into cash or sales, the more efficient it runs. Activity ratios become more meaningful when compared to industry-average activity ratios. Different industries have different industry-average activity ratios. It includes Working capital turnover ratios, fixed asset turnover ratio and Capital turnover ratio 1. Working Capital turnover Ratio: Working capital turnover Ratio indicates the efficient utilization of working capital in generating sales. It is calculated as follows: Working capital turnover Ratio = Sales / Working Capital Working capital turnover ratio is segregated into three ratios such as Inventory turnover ratio, Debtors turnover Ratio, Creditors turnover Ratio. a) Inventory turnover ratio: This ratio is also known as stock turnover ratio. It establishes the relationship between sales during the period and average inventory held Average inventory= opening stock + closing stock 2 A low ratio indicates that the inventory is not used or sold or lost or stays in warehouse for long-time. b) Debtor turnover Ratio: This ratio throws light on collection and credit policies of the firm. It is a technique used to measure how quickly a company is able to collect money that is owed by its customers. The higher the ratio becomes, the more efficient management is in collecting credit sales. A low ratio implies poor credit and collection performance. It is calculated as follows: Debtor turnover Ratio=sales/average receivables Receivables pertain to credit sales. It is recommended to calculate with reference to credit sales alone Debtor turnover Ratio = credit sales/ average receivable.
- 32. c) Credit turnover Ratio: This ratio shows the velocity of net payment by the firm. Turnover ratio is most often calculated on annual basis, though this can be broken down to find quarterly or monthly accounts receivable turnover as well. Credit turnover Ratio: credit purchases/average account payables Low ratio indicates liberal credit terms granted by the suppliers where as high ratio shows that accounts are settled rapidly. 2. Fixed asset Turnover Ratio: It is the ratio of sales to the value of fixed assets. It indicates how well the business using its fixed assets to generate sales Fixed asset turnover ratio = net sales/ average net fixed assets The higher the ratio the better because a high ratio indicates the business has less money tied up in fixed assets for each unit of sales revenue. A low ratio may indicate that the business is over invested in plant, equipment, or other fixed assets 3. Capital turnover ratio: This ratio shows how efficiently the sales are generated from the capital by the firm. This ratio helps the investors or the creditors to determine the ability of the firm to generate revenue and act as a key decision factor for lending more money to asking firm. Higher the ratio better the utilisation of capital employ and shows the ability of firm to generate maximum profits with the minimum amount of capital employed. Capital turnover ratio = net sales/capital employed Capital employed = Net worth + long term borrowers. 4. DATA ANALYSIS & INTERPRETATION 1. Total Working Capital: Net Working Capital= Current Assets – Current Liabilities Year Current assets current liabilities Working capital increase/decrease
- 33. 2013-14 1251.83 1612.4 -360.57 94.57 2014-15 1249.54 1704.68 -455.14 -211.59 2015-16 1199.67 1443.22 -243.55 -57.68 2016-17 1303.78 1489.65 -185.87 -185.87 INTERPRETATION: From the above table it is clear that working capital for all the 4yrs shows negative sign, as it indicates current liabilities exceeds current assets. Zuari cementcurrent assets substantially decrease as a result of a large one-time cash payment, or current liabilities due to significant credit extensions resulting in an account payable as the working capital turns into –ve, it means the company is not able to meet the short-term obligations. 2. Total Current Ratio: Current Ratio = Current Assets / Current Liabilities
- 34. Year Current assets current liabilities current ratio increase/decrease 2013-14 1251.83 1612.4 0.77637683 0.043371221 2014-15 1249.54 1704.68 0.733005608 -0.098239801 2015-16 1199.67 1443.22 0.83124541 -0.043980315 2016-17 1303.78 1489.65 0.875225724 0.875225724 INTERPRETATION: From the above table it is clear that current liabilities >current assets so the result may turn into <1 it indicates the company is not in good financial health and it is not able to pay off its short –term liabilities with its current assets. 3. Total Quick Ratio: Quick Ratio = (Current Assets – Inventory) / Current Liabilities
- 35. Year Current assets current liabilities Inventory Quick ratio Increase/Decrease 2013-14 1251.83 1612.4 594.75 0.407516745 0.076656994 2014-15 1249.54 1704.68 685.53 0.330859751 -0.139678351 2015-16 1199.67 1443.22 520.58 0.470538102 -0.035359256 2016-17 1303.78 1489.65 550.17 0.505897358 0.505897358 INTERPRETATION: Quick-ratio is an indicator of a company’s short-term liquidity. From the above table it is clear that Zuari cementcurrent assets are not as equal as current liabilities, so it is difficult on the part of the company to pay its current liabilities when they come due with only quick assets. 4. Total Inventory Turnover Ratio: Inventory Turnover Ratio = Net Sales / Average Inventory Average inventory = (Opening stock + Closing Stock) / 2 Inventory Turnover Ratio in Days = 365 / Inventory Turnover Ratio
- 36. Year Sales opening stock closing stock average inventory ITR in times ITR in days 2013-14 3830.8 82.95 132.25 107.6 35.60223048 10.25216665 2014-15 3683.51 132.95 113.46 123.205 29.89740676 12.2084167 2015-16 3644.89 113.46 110.47 111.965 32.55383379 11.21219708 2016-17 3595.75 110.47 104.31 107.39 33.48309899 10.90102204 INTERPRETATION: Inventory turnover ratio shows how many times a company’s inventory is sold and replaced over a period of time. The days in the period can then be divided by inventory turnover formula to calculate the days it takes to the inventory on hand. This means, from the above table we can say that inventory turns 33 times a year, and is on hand approximately 11 days in the year 2016-17 similarly 35,29 and 32 times a year and is on hand approximately 10,12 and 11 days in the years 2014,2015 and 2016 respectively. 5. Total Working Capital turnover Ratio: Working Capital Turnover Ratio = Net Sales / Working Capital
- 37. Year Sales Working capital WC Turnover Ratio 2013-14 3830.8 -360.57 10.62428932 2014-15 3683.51 -455.14 8.093136178 2015-16 3644.89 -243.55 14.9656744 2016-17 3595.75 -185.87 19.3455103 INTERPRETATION: The working capital turnover ratio is used to analyze the relationship between the sales generated from the operations and utilizes its working capital for supporting a given level of sales. From the above table it is clear that there is an increase in Working capital due to increase in current assets, so the Working Capital Turnover Ratio Increases through year by year. 6. Total Fixed Asset Turnover Ratio: Total Fixed Asset Turnover Ratio = Net Sales / Total Fixed Assets
- 38. Year Sales Total Fixes Assets FA Turnover Ratio 2013-14 3830.8 4750.55 0.806390839 2014-15 3683.51 4995.3 0.737395151 2015-16 3644.89 5138.18 0.709373747 2016-17 3595.75 5051.74 0.711784454 v INTERPRETATION: The fixed assets turnover ratio is, in general, used by analysts to measure operating performance. The ratio specifically measures how able a company is to generate net sales from fixed asset investments, it indicates the company how effectively used its investment in fixed assets to generate revenue. From the above table it is clear that Sales are decreasing even though there is an increase in fixed assets from the years 2012-16. 7. Total Capital Turnover Ratio: Total Capital Turnover Ratio = Cost of Sales / Capital Employed
- 39. Capital Employed = Total Assets – Current Liabilities Year Sales Total Assets current liabilities Capital Employed Capital Turnover Ratio 2013-14 3830.8 6471.38 1612.4 4858.98 0.788395918 2014-15 3683.51 6868.56 1704.68 5163.88 0.713322153 2015-16 3644.89 7070.28 1443.22 5627.06 0.647743226 2016-17 3595.75 7024.85 1489.65 5535.2 0.64961519 INTERPRETATION: The Capital turnover ratio helps the investors or creditors to determine the ability of a firm to generate revenues from the capital employed and act as a key decision factor for lending more money to the asking firm. STATEMENT SHOWING COMPARATIVE BALANCE SHEET OF ZUARI CEMENT (2014-15) Rs crores Rs Crores Particulars 2013 2014 Increase/decrease Change in %
- 40. I. EQUITY & LIABILITIES Shareholders’ Funds Share Capital 23.8 23.80 0.00 0 Reserves and Surplus 2,346.96 2458.28 -111.32 -4.743157105 Total 2,370.76 2,482.08 -111.32 -4.695540671 Non Current Liabilities Long Term Borrowings 1,393.06 1420.35 -27.29 -1.958996741 Deferred Tax Liabilities 716.36 737.37 -21.01 -2.932882908 Other Long Term Liabilities 338.42 383.47 -45.05 -13.311861 Long Term Provisions 40.38 40.61 -0.23 -0.569588905 Total 2,488.22 2681.8 -193.58 -7.779858694 Current Liabilities Short Term Borrowings 588.08 723.62 -135.54 -23.04788464 Trade Payables 143.08 187.66 -44.58 -31.15739446 Other Current Liabilities 734.35 729.18 5.17 0.704023967 Short Term Provisions 146.89 64.22 82.67 56.28020968 Total 1,612.40 1704.68 -92.28 -5.723145621 Total Liabilities 6,471.38 6868.56 -397.18 -6.137485359 II. ASSETS Non-Current Assets Fixed Assets Tangible Assets 4,513.40 4521.91 -8.51 -0.188549652 Intangible Assets 80.15 119.16 -39.01 -48.67124142 Capital Work in Progress 147.96 349.52 -201.56 -136.226007 Intangible Assets Under Development 9.04 4.72 4.32 47.78761062 Non Current Investments 265.77 283.41 -17.64 -6.637317982 Long term Loans and Advances 201.74 338.68 -136.94 -67.8794488 Other Non Current Assets 1.49 1.62 -0.13 -8.724832215 Total 5219.55 5619.02 -399.47 -7.653341763 Current Assets Inventories 594.75 685.53 -90.78 -15.26355612 Trade Receivables 302.81 303.96 -1.15 -0.379776097 Cash and Bank Balances 53.96 44.61 9.35 17.32765011 Short Term Loans and Advances 298.72 206.59 92.13 30.84159079 Other Current Assets 1.59 8.85 -7.26 -456.6037736 Total 1251.83 1249.54 2.29 0.182932187 Total Assets 6471.38 6868.56 -397.18 -6.137485359 INTERPRETATION:
- 41. 1. The comparative balance sheet of Zuari cement for the year 2014-15of March reveals the following facts. 2. The liquidity position of Zuari cement for the year 2014-15shows that there is a decrease in working capital. 3. Where the total current Liabilities are greater than Current assets, working capital indicates negative sign. Hence the position is not satisfactory. 4. The comparative balance sheet of Zuari cement for the year ending March 2014 reveals that there is increase in fixed assets and long term liabilities. 5. The final position of Zuari cement is satisfactory. Because the liquidity position of Zuari cement is better. STATEMENT SHOWING COMPARATIVE BALANCE SHEET OF ZUARI CEMENT(2015-16) Rs in crores Rs in Crores
- 42. Particulars Rs in crores 2014 RS in Crores 2015 Increase/decrease Change in % I. EQUITY & LIABILITIES Shareholders’ Funds Share Capital 23.80 23.81 -0.01 -0.042016807 Reserves and Surplus 2458.28 2621.38 -163.10 -6.634720211 Total 2,482.08 2645.19 -163.11 -6.571504545 Non Current Liabilities Long Term Borrowings 1420.35 1710.02 -289.67 -20.39426902 Deferred Tax Liabilities 737.37 827.06 -89.69 -12.16350001 Other Long Term Liabilities 383.47 404.89 -21.42 -5.585834615 Long Term Provisions 40.61 39.9 0.71 1.748337848 Total 2681.8 2981.87 -300.07 -11.18912671 Current Liabilities Short Term Borrowings 723.62 553.61 170.01 23.4943755 Trade Payables 187.66 219.75 -32.09 -17.1000746 Other Current Liabilities 729.18 547.44 181.74 24.92388711 Short Term Provisions 64.22 122.42 -58.20 -90.62597322 Total 1704.68 1443.22 261.46 15.337776 Total Liabilities 6868.56 7070.28 -201.72 -2.936860128 II. ASSETS Non-Current Assets Fixed Assets Tangible Assets 4521.91 4763.91 -242.00 -5.351720844 Intangible Assets 119.16 111.61 7.55 6.336018798 Capital Work in Progress 349.52 257.52 92.00 26.32181277 Intangible Assets Under Development 4.72 5.14 -0.42 -8.898305085 Non Current Investments 283.41 355.83 -72.42 -25.55308564 Long term Loans and Advances 338.68 374.54 -35.86 -10.58816582 Other Non Current Assets 1.62 2.06 -0.44 -27.16049383 Total 5619.02 5870.61 -251.59 -4.47747116 Current Assets Inventories 685.53 520.58 164.95 24.06167491 Trade Receivables 303.96 380.22 -76.26 -25.08882748 Cash and Bank Balances 44.61 61.85 -17.24 -38.64604349 Short Term Loans and Advances 206.59 233.76 -27.17 -13.15165303 Other Current Assets 8.85 3.26 5.59 63.16384181 Total 1249.54 1199.67 49.87 3.991068713 Total Assets 6868.56 7070.28 -201.72 -2.936860128 INTERPRETATION:
- 43. 1. The comparative balance sheet of Zuari cement for the year 2015-16 of March reveals the following facts. 2. The liquidity position of Zuari cement for the year 2015-16 shows that there is an increase in working capital. 3. Where the total current Liabilities are greater than Current assets, working capital indicates negative sign. Hence the position is not satisfactory. 4. The comparative balance sheet of Zuari cement for the year ending March 2014 reveals that there is increase in fixed assets and long term liabilities. 5. The final position of Zuari cement is satisfactory. Because the liquidity position of Zuari cement is better. STATEMENT SHOWING COMPARATIVE BALANCE SHEET OF ZUARI CEMENT(2016-17)
- 44. Particulars Rs in crores 2015 RS in Crores 2016 Increase/decrease Change in % I. EQUITY & LIABILITIES Shareholders’ Funds Share Capital 23.81 23.81 0.00 0 Reserves and Surplus 2621.38 3049.46 -428.08 -16.33032983 Total 2645.19 3073.27 -428.08 -16.18333655 Minority Intrest 0.61 0.7 -0.09 -14.75409836 Non Current Liabilities Long Term Borrowings 1710.02 1070.98 639.04 37.37032315 Deferred Tax Liabilities 827.06 852.77 -25.71 -3.108601552 Other Long Term Liabilities 404.89 520.27 -115.38 -28.49662871 Long Term Provisions 39.9 17.21 22.69 56.86716792 Total 2981.87 2461.23 520.64 17.46018438 Current Liabilities Short Term Borrowings 553.61 701.66 -148.05 -26.74265277 Trade Payables 219.75 209.25 10.50 4.778156997 Other Current Liabilities 547.44 552.18 -4.74 -0.865848312 Short Term Provisions 122.42 26.56 95.86 78.30419866 Total 1443.22 1489.65 -46.43 -3.217111736 Total Liabilities 7070.28 7024.85 45.43 0.64254881 II. ASSETS Non-Current Assets Fixed Assets Tangible Assets 4763.91 4852.8 -88.89 -1.865904268 Intangible Assets 111.61 79.52 32.09 28.75190395 Capital Work in Progress 257.52 138.31 119.21 46.29155017 Intangible Assets Under Development 5.14 8.53 -3.39 -65.95330739 Non Current Investments 355.83 367.27 -11.44 -3.215018408 Long term Loans and Advances 374.54 271 103.54 27.64457735 Other Non Current Assets 2.06 3.64 -1.58 -76.69902913 Total 5870.61 5721.07 149.54 2.547265105 Current Assets Inventories 520.58 550.17 -29.59 -5.684044719 Trade Receivables 380.22 468.48 -88.26 -23.21287676 Cash and Bank Balances 61.85 91.13 -29.28 -47.34033953 Short Term Loans and Advances 233.76 192.26 41.50 17.7532512 Other Current Assets 3.26 1.74 1.52 46.62576687 Total 1199.67 1303.78 -104.11 -8.678219844 Total Assets 7070.28 7024.85 45.43 0.64254881 INTERPRETATION:
- 45. 1. The comparative balance sheet of Zuari cement for the year 2016-17 of March reveals the following facts. 2. The liquidity position of Zuari cement for the year 2016-17 shows that there is an increase in working capital. 3. Where the total current Liabilities are greater than Current assets, working capital indicates negative sign. Hence the position is not satisfactory. 4. The comparative balance sheet of Zuari cement for the year ending March 2014 reveals that there is increase in fixed assets and long term liabilities. 5. The final position of Zuari cement is satisfactory. Because the liquidity position of Zuari cement is better. STATEMENT SHOWING COMMONSIZE BALANCE SHEET OF ZUARI CEMENT(2014-15)
- 46. Rs in crores % change Rs in Crores % change Particulars 2014 2015 I. EQUITY & LIABILITIES Shareholders’ Funds Share Capital 23.8 0.36777318 23.80 0.3465064 Reserves and Surplus 2,346.96 36.26676227 2458.28 35.79032577 Total 2,370.76 36.63453545 2,482.08 36.13683217 Non Current Liabilities Long Term Borrowings 1,393.06 21.52647503 1420.35 20.67900695 Deferred Tax Liabilities 716.36 11.06966366 737.37 10.735438 Other Long Term Liabilities 338.42 5.229487374 383.47 5.58297518 Long Term Provisions 40.38 0.623978193 40.61 0.591244744 Total 2,488.22 38.44960426 2681.8 39.04457412 Current Liabilities Short Term Borrowings 588.08 9.087397124 723.62 10.53525047 Trade Payables 143.08 2.210965822 187.66 2.732159288 Other Current Liabilities 734.35 11.34765691 729.18 10.61619903 Short Term Provisions 146.89 2.269840436 64.22 0.934984917 Total 1,612.40 24.9158603 1704.68 24.81859371 Total Liabilities 6,471.38 100 6868.56 100 II. ASSETS Non-Current Assets Fixed Assets Tangible Assets 4,513.40 69.74401132 4521.91 65.83490572 Intangible Assets 80.15 1.238530267 119.16 1.734861456 Capital Work in Progress 147.96 2.286374776 349.52 5.088693991 Intangible Assets Under Development 9.04 0.139691998 4.72 0.068718916 Non Current Investments 265.77 4.106852016 283.41 4.12619239 Long term Loans and Advances 201.74 3.117418541 338.68 4.930873429 Other Non Current Assets 1.49 0.023024455 1.62 0.02358573 Total 5219.55 80.65590338 5619.02 81.80783163 Current Assets Inventories 594.75 9.19046633 685.53 9.980694643 Trade Receivables 302.81 4.679218343 303.96 4.425381739 Cash and Bank Balances 53.96 0.833825243 44.61 0.649481114 Short Term Loans and Advances 298.72 4.616016986 206.59 3.007762908 Other Current Assets 1.59 0.024569721 8.85 0.128847968 Total 1251.83 19.34409662 1249.54 18.19216837 Total Assets 6471.38 100 6868.56 100 INTERPRETATION:
- 47. The above table represents the Common size Balance sheet of Zuari cementin the year 2014-15. It is used to analyse the working capital position based on Current Assets and Current Liabilities. We can also interpret the sales based on Total fixed Assets and revenue along with Current Liabilities. By this we can say whether capital structure is safe or not. STATEMENT SHOWING COMMONSIZE BALANCE SHEET OF ZUARI CEMENT(2015-16) Rs in crores % change Rs in Crores % change
- 48. Particulars Rs in crores 2015 RS in Crores 2016 I. EQUITY & LIABILITIES Shareholders’ Funds Share Capital 23.80 0.3465064 23.81 0.336761769 Reserves and Surplus 2458.28 35.79032577 2621.38 37.07604225 Total 2,482.08 36.13683217 2645.19 37.41280402 Non Current Liabilities Long Term Borrowings 1420.35 20.67900695 1710.02 24.18602941 Deferred Tax Liabilities 737.37 10.735438 827.06 11.69769797 Other Long Term Liabilities 383.47 5.58297518 404.89 5.726647318 Long Term Provisions 40.61 0.591244744 39.9 0.564334086 Total 2681.8 39.04457412 2981.87 42.17470878 Current Liabilities Short Term Borrowings 723.62 10.53525047 553.61 7.830100081 Trade Payables 187.66 2.732159288 219.75 3.108080585 Other Current Liabilities 729.18 10.61619903 547.44 7.742833381 Short Term Provisions 64.22 0.934984917 122.42 1.731473152 Total 1704.68 24.81859371 1443.22 20.4124872 Total Liabilities 6868.56 100 7070.28 100 II. ASSETS Non-Current Assets Fixed Assets Tangible Assets 4521.91 65.83490572 4763.91 67.37936829 Intangible Assets 119.16 1.734861456 111.61 1.578579632 Capital Work in Progress 349.52 5.088693991 257.52 3.642288566 Intangible Assets Under Development 4.72 0.068718916 5.14 0.072698677 Non Current Investments 283.41 4.12619239 355.83 5.032756836 Long term Loans and Advances 338.68 4.930873429 374.54 5.297385676 Other Non Current Assets 1.62 0.02358573 2.06 0.029136046 Total 5619.02 81.80783163 5870.61 83.03221372 Current Assets Inventories 685.53 9.980694643 520.58 7.362933293 Trade Receivables 303.96 4.425381739 380.22 5.377721957 Cash and Bank Balances 44.61 0.649481114 61.85 0.874788552 Short Term Loans and Advances 206.59 3.007762908 233.76 3.306233982 Other Current Assets 8.85 0.128847968 3.26 0.046108499 Total 1249.54 18.19216837 1199.67 16.96778628 Total Assets 6868.56 100 7070.28 100 INTERPRETATION:
- 49. The above table represents the Common size Balance sheet of Zuari cement in the year 2015-16. It is used to analyse the working capital position based on Current Assets and Current Liabilities. We can also interpret the sales based on Total fixed Assets and revenue along with Current Liabilities. By this we can say whether capital structure is safe or not. STATEMENT SHOWING COMMONSIZE BALANCE SHEET OF ZUARI CEMENT(2016-17)
- 50. Particulars Rs in crores 2016 % Change RS in Crores 2017 % Change I. EQUITY & LIABILITIES Shareholders’ Funds Share Capital 23.81 0.336761769 23.81 0.338939621 Reserves and Surplus 2621.38 37.07604225 3049.46 43.40961017 Total 2645.19 37.41280402 3073.27 43.74854979 Minority Intrest 0.61 0.008627664 0.7 0.009964626 Non Current Liabilities Long Term Borrowings 1710.02 24.18602941 1070.98 15.24559243 Deferred Tax Liabilities 827.06 11.69769797 852.77 12.13933394 Other Long Term Liabilities 404.89 5.726647318 520.27 7.406136786 Long Term Provisions 39.9 0.564334086 17.21 0.244987437 Total 2981.87 42.17470878 2461.23 35.03605059 Current Liabilities Short Term Borrowings 553.61 7.830100081 701.66 9.988255977 Trade Payables 219.75 3.108080585 209.25 2.978711289 Other Current Liabilities 547.44 7.742833381 552.18 7.86038136 Short Term Provisions 122.42 1.731473152 26.56 0.378086365 Total 1443.22 20.4124872 1489.65 21.20543499 Total Liabilities 7070.28 100 7024.85 100 II. ASSETS Non-Current Assets Fixed Assets Tangible Assets 4763.91 67.37936829 4852.8 69.08047859 Intangible Assets 111.61 1.578579632 79.52 1.131981466 Capital Work in Progress 257.52 3.642288566 138.31 1.968867663 Intangible Assets Under Development 5.14 0.072698677 8.53 0.12142608 Non Current Investments 355.83 5.032756836 367.27 5.228154338 Long term Loans and Advances 374.54 5.297385676 271 3.857733617 Other Non Current Assets 2.06 0.029136046 3.64 0.051816053 Total 5870.61 83.03221372 5721.07 81.4404578 Current Assets Inventories 520.58 7.362933293 550.17 7.83176865 Trade Receivables 380.22 5.377721957 468.48 6.668896845 Cash and Bank Balances 61.85 0.874788552 91.13 1.297251899 Short Term Loans and Advances 233.76 3.306233982 192.26 2.736855591 Other Current Assets 3.26 0.046108499 1.74 0.024769212 Total 1199.67 16.96778628 1303.78 18.5595422 Total Assets 7070.28 100 7024.85 100 INTERPRETATION:
- 51. The above table represents the Common size Balance sheet of Zuari cement in the year 2016-17. It is used to analyse the working capital position based on Current Assets and Current Liabilities. We can also interpret the sales based on Total fixed Assets and revenue along with Current Liabilities. By this we can say whether capital structure is safe or not.
- 52. 5.FINDINGS 1. The working capital of Zuari cement represents negative value for 4 years .But for the year 2015-16 the performance of working capital is comparatively better than the previous years, due to the increase in current assets (but less than the current liabilities). 2. The acceptable ratio of current ratio is 2:1, the current ratio of Zuari cement is gradually increasing from year to year. But in the year 2015-16 somehow the company is able to meet its short-term obligations with its increased current assets. 3. The acceptable ratio of quick ratio is 1:1, the quick ratio of Zuari cement is gradually increasing from year to year. But in the year 2015-16 somehow the company is able to pay off its current liabilities with its increased liquidity assets. 4. The inventory turnover ratio of Zuari cement is highest (35.602) when compared to the following years because of its efficient increase in sales. 5. The working capital turnover position of Zuari cement has significantly increased from year to year due to increased in sales as well as increase in current assets. 6. The fixed asset turnover ratio is highest in 2012-13 (0.80) because the money tied up in fixed assets is low for each unit of currency of sales revenue. The fixed assets turnover ratio is lowest in 2014-15 (0.70) because it was over invested in plant, equipment or other fixed assets. 7. The capital turnover ratio of Zuari cement in 2012-13 is higher than the following years because the utilization of capital employed, shows the ability of the firm to generate maximum profits with the minimum amount of capital employed.
- 53. 6. SUGGESTIONS 1. Zuari cement has to overcome from negative working capital to positive working capital by increasing its current assets with the reduction in current liabilities. 2. The current ratio of Zuari cement has to reach the acceptable range of either 1 or > 1 to meet their short-term obligations. 3. The quick ratio of Zuari cement has to reach the acceptable range of 1 to pay off its current liabilities with its increasing liquidity assets. 4. Zuari cement has to improve the sales over a period of time with optimum level of inventory. 5. The increased working capital turnover ratio encourages the company to boost up their further sales and current assets. 6. I suggest Zuari cements, that, it has to invest less amount in fixed assets so that the amount will be efficiently used in raising the revenue.
- 54. 7. The objective of every is to gain maximum profits with minimum amount of capital employed. CONCLUSION By conducting the study about the “Working Capital Management “ it is found out that working capital management of Zuari cement is improved on a comparative analysis, the co. has less significant funds to meet its current obligations. The Working Capital enables the company to meet its short-term obligations, but here in the Zuari cements, though the working capital is negative it is able to resolve the payments due to increase in terms of current assets and liquidity assets.
- 55. It is observed that there is a raise in inventory due to purchase on regular basis, as it is impacting the current assets to increase which pays a path to meet its current obligations. The sales of Zuari cement were decreasing for the past 4 years which is uncontrollable in nature due to fluctuating prices in market, from the past 4 years Financial Statements the investment in fixed assets are increasing, which tells us that there is a raise in turnover, over a period of time. REFERENCES http://study.com/academy/lesson/what-is-working-capital-management-definition- examples.html https://www.universalclass.com/articles/business/financial-analysis-defining-liquidity-and- working-capital-management.htm