1. Genome analysis of multiple pathogenic isolates
of Streptococcus agalactiae: Implications
for the microbial ‘‘pan-genome’’
Herve´ Tettelina,b, Vega Masignanib,c, Michael J. Cieslewiczb,d,e, Claudio Donatic, Duccio Medinic, Naomi L. Warda,f,
Samuel V. Angiuolia, Jonathan Crabtreea, Amanda L. Jonesg, A. Scott Durkina, Robert T. DeBoya, Tanja M. Davidsena,
Marirosa Morac
, Maria Scarsellic
, Immaculada Margarit y Rosc
, Jeremy D. Petersona
, Christopher R. Hausera
,
Jaideep P. Sundarama, William C. Nelsona, Ramana Madupua, Lauren M. Brinkaca, Robert J. Dodsona, Mary J. Rosovitza,
Steven A. Sullivana, Sean C. Daughertya, Daniel H. Hafta, Jeremy Selenguta, Michelle L. Gwinna, Liwei Zhoua,
Nikhat Zafara, Hoda Khouria, Diana Radunea, George Dimitrova, Kisha Watkinsa, Kevin J. B. O’Connorh, Shannon Smithi,
Teresa R. Utterbacki
, Owen Whitea
, Craig E. Rubensg
, Guido Grandic
, Lawrence C. Madoffe,j
, Dennis L. Kaspere,j
,
John L. Telfordc, Michael R. Wesselsd,e, Rino Rappuolic,k,l, and Claire M. Frasera,b,k,m
aInstitute for Genomic Research, 9712 Medical Center Drive, Rockville, MD 20850; cChiron Vaccines, Via Fiorentina 1, 53100 Siena, Italy; dDivision
of Infectious Diseases, Children’s Hospital, 300 Longwood Avenue, Boston, MA 02115; eHarvard Medical School, Boston, MA 02115; fCenter of Marine
Biotechnology, University of Maryland Biotechnology Institute, 701 East Pratt Street, Baltimore, MD 21202; gChildren’s Hospital and Regional Medical
Center, 307 Westlake Avenue N, Seattle, WA 98109; hThe Johns Hopkins University, 3400 North Charles Street, Baltimore, MD 21218; iJ. Craig Venter
Institute, 5 Research Place, Rockville, MD 20850; jChanning Laboratory, Brigham and Women’s Hospital, 181 Longwood Avenue, Boston, MA 02115;
and mGeorge Washington University Medical Center, 2300 Eye Street NW, Washington, DC 20037
Contributed by Rino Rappuoli, August 5, 2005
The development of efficient and inexpensive genome sequencing
methods has revolutionized the study of human bacterial patho-
gens and improved vaccine design. Unfortunately, the sequence of
a single genome does not reflect how genetic variability drives
pathogenesis within a bacterial species and also limits genome-
wide screens for vaccine candidates or for antimicrobial targets.
We have generated the genomic sequence of six strains represent-
ing the five major disease-causing serotypes of Streptococcus
agalactiae, the main cause of neonatal infection in humans. Anal-
ysis of these genomes and those available in databases showed
that the S. agalactiae species can be described by a pan-genome
consisting of a core genome shared by all isolates, accounting for
Ϸ80% of any single genome, plus a dispensable genome consisting
of partially shared and strain-specific genes. Mathematical extrap-
genome sequence of the type Ia strain A909 and draft genome
sequences (8ϫ sequence coverage) of five additional strains, rep-
resenting the five major serotypes. Comparative analysis of the six
newly sequenced genomes and the two genomes already available
in the databases suggests that a bacterial species can be described
by its ‘‘pan-genome’’ (pan, from the Greek word ␣, meaning
whole), which includes a core genome containing genes present in
all strains and a dispensable genome composed of genes absent
from one or more strains and genes that are unique to each strain.
Surprisingly, unique genes were still detected after eight genomes
were sequenced, and mathematical extrapolation predicts that new
genes will still be found after sequencing many more strains. Thus,
the genomes of multiple, independent isolates are required to
understand the global complexity of bacterial species. Analysis of
2. In 1987, it was proposed (1) that bacterial strains showing 70% DNA DNA
reassociation and sharing characteristic phenotypic traits should be considered to be
strains of the same species.
Thus far, the genome sequence of one or two strains for each species has provided
unprecedented information; however, the question of how many genomes are
necessary to fully describe a bacterial species has yet to be asked.
3. Comparative analysis of the six newly sequenced genomes and the two genomes
already available in the databases suggests that a bacterial species can be
described by its ‘‘pan-genome’’ (pan, from the Greek word , meaning whole),
which includes a core genome containing genes present in all strains and a
dispensable genome composed of genes absent from one or more strains and
genes that are unique to each strain. Surprisingly, unique genes were still
detected after eight genomes were sequenced, and mathematical extrapolation
predicts that new genes will still be found after sequencing many more strains.
6. leading to the prediction of Ͼ3,500 genes. Many small contigs did
not harbor protein-coding genes, and several were fragments of
rRNAs or coded for tRNAs or structural RNAs.
Shared and Strain-Specific Genes. Each strain pair was compared by
means of the following: (i) a Smith and Waterman protein search
on all of the predicted proteins by using the SSEARCH program
(version 3.4) (19, 20); (ii) a DNA search of all of the predicted
ORFs of a strain against the complete DNA sequence of the
other strain, by using the FASTA program (version 3.4) (20); and
(iii) a translated protein search of all of the predicted proteins
of a strain against the complete DNA sequence of the other
strain, by using the TFASTY program (version 3.4) (20). A gene
was considered conserved if at least one of these three methods
produced an alignment with a minimum of 50% sequence
conservation over 50% of the protein͞gene length.
Core-Genome and Pan-Genome Extrapolation. The number of genes
shared by all GBS isolates and the number of strain-specific
7. Core-Genome and Pan-Genome Extrapolation. The number of genes
shared by all GBS isolates and the number of strain-specific
genes depend on how many strains are taken into account. The
sequential inclusion of up to eight strains was simulated in all
possible combinations. The number (N) of independent mea-
surements of the shared (see Fig. 2) and strain-specific genes (see
Fig. 3) present in the nth genome is N ϭ 8!͞[(n Ϫ 1)!⅐(8 Ϫ n)!].
The size of the species core genome and the number of strain-
specific genes for a large number of sequenced strains were
extrapolated by fitting the exponential decaying functions Fc ϭ
c exp[Ϫn͞c] ϩ ⍀ and Fs ϭ s exp[Ϫn͞s] ϩ tg(), respectively,
to the amount of conserved genes (see Fig. 2) and of strain-
specific genes (see Fig. 3), where n is the number of sequenced
strains and c, s, c, s, ⍀, and tg() are free parameters. tg()
represents the extrapolated rate of growth of the pan-genome
size, P(n), as a greater number of independent GBS strain
sequences become available, i.e.,
lim͓P͑n͔͒
n3 ϱ
Ϸ tg͑͒⅐n.
The Inset of Fig. 3 displays the measured size of the pan-genome
as a function of n [in this case, N ϭ 8!͞(8 Ϫ n)!; points are
obtained for each value of n] together with a plot of the
calculated P(n) (see Supporting Text, which is published as
supporting information on the PNAS web site).
of the whole
regions of aty
Results
General Featur
coverage) wer
and CJB111, b
and V, which
the United St
strain A909 of
515, both belo
different sequ
sequence typi
genetic divers
published as su
six newly seq
2603V͞R and
used for subse
genome sizes
entire nucleot
the GBS strai
nations with N
ranged from 8
and noncodin
Fig. 1 summ
ison of the eig
gene synteny i
8. calculated P(n) (see Supporting Text, which is published as
supporting information on the PNAS web site).
Synteny. Paralog clusters in each genome were generated by
using the Jaccard algorithm (21), with Ն 80% identity, and a
Jaccard coefficient Ն 0.6. Members of paralog clusters were then
organized into ortholog clusters by allowing any member of a
paralog cluster to contribute to the reciprocal best matches used
to construct the ortholog clusters. Syntenic blocks are defined as
a set of five or more consecutive pairs of genes from the same
Tettelin et al.
ortholog cluster. Because they do not participate in clusters, all
contigs that do not contain protein-coding genes from the five
draft genomes were searched against all genomes by using the
NUCMER program (16). Syntenic blocks and NUCMER results were
drawn (Fig. 1) by using SYBIL (http:͞͞sybil.sourceforge.net͞).
In Fig. 1, genomic islands of diversity Ͼ5 kb are predicted as
follows: (i) strains are inspected from the top panel and down
and from left to right on each panel; (ii) regions of at least 1 kb
not shared with another strain are identified; (iii) regions are
9. and
er.
se-
G-
all
ons
igs
ere
hat
RF
go-
her
mes,
did
of
by
rch
am
ted
the
drawn (Fig. 1) by using SYBIL (http:͞͞sybil.sourceforge.net͞).
In Fig. 1, genomic islands of diversity Ͼ5 kb are predicted as
follows: (i) strains are inspected from the top panel and down
and from left to right on each panel; (ii) regions of at least 1 kb
not shared with another strain are identified; (iii) regions are
merged into single islands if they are within 5 kb of each other;
and (iv) resulting islands Ͼ5 kb are considered. It should be
noted that some islands are composed of more than one contig.
Genomic islands discussed in the text are the following: the
␣-galactosidase region in strain H36B, island 7.4; the prophage
region in strain H36B, island 7.5; the DNA restriction͞
modification system in strain 515, part of island 4.5; the Tn916
regions in strains 2603V͞R, 515, CJB111, and COH1, islands 1.8
and the left side of 5.3; and serine-rich protein and glycosyl-
transferases flanked by cell-wall-anchored proteins and sortases
in strain COH1, unnumbered region between islands 6.5 and
1.15. Fig. 1 reveals many non-protein-coding regions in strain
18RS21 that display NUCMER matches elsewhere in the 18RS21
genome. Most of these regions correspond to fragments of
rRNAs, tRNAs, or structural RNAs, all of which exhibit an
expected atypical nucleotide composition.
10. 1.15. Fig. 1 reveals many non-protein-coding regions in strain
18RS21 that display NUCMER matches elsewhere in the 18RS21
genome. Most of these regions correspond to fragments of
rRNAs, tRNAs, or structural RNAs, all of which exhibit an
expected atypical nucleotide composition.
2 Analysis. Regions of atypical nucleotide composition were
identified by the 2 analysis; the distribution of all 64 trinucle-
otides (3mers) was computed for the complete genome in all six
reading frames, followed by the 3mer distribution in 5,000-bp
windows. Windows overlapped by 500 bp. For each window, the
2 statistic on the difference between its 3mer content and that
of the whole genome was computed. Peaks in Fig. 1 indicate
regions of atypical nucleotide composition.
Results
General Features of GBS Genomes. Draft genome sequences (8ϫ
coverage) were obtained for strains 515, H36B, 18RS21, COH1,
and CJB111, belonging, respectively, to serotypes Ia, Ib, II, III,
11.
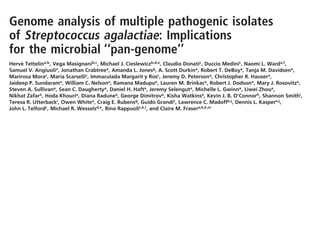
12. Fig. 1. Whole genome alignment of GBS strains. The eight genomes are compared to each
other by using COG (41) and NUCMER analyses (see Materials and Methods). Each
genome (shaded strain name) is colored with a gradient that ranges from yellow (nucleotide
1) to blue (end). Differences in color between a reference sequence (the last colored line in
each genome) and the other genomes indicate conserved protein-coding regions that have
been rearranged. Uncolored segments denote coding regions in which no conserved genes
were detected. NUCMER matches for contigs that do not contain protein-coding genes are
displayed by red blocks (matches within the reference strain are displayed on the line directly
above it). Genomic islands of diversity are boxed and numbered ‘‘x.y,’’ where x is the panel
or strain number where the island first appeared and y is the island location in that genome
from left to right. A indicates an island that was not identified in a previous genome. Islands
that overlap by at least 50% (based on the number of shared genes) with previously identified
islands receive the same number as the initial island. The gene content of the 69 islands
identified is listed in Table 2, which is published as supporting information on the PNAS web
site. Strain-specific regions, free of COG or NUCMER matches, are displayed in black at the
bottom of each panel. Portions of these regions that harbor protein-coding genes are indicated
in gray below the black blocks. The curves on top of each panel represent the nucleotide
composition ( 2 analysis) (see Materials and Methods) of the reference strain of the panel,
and peaks indicate regions of atypical composition.
13. with the numbe
verify whether
repeated the an
of Streptococcu
strains of Bac
levels of genom
Fig. 2. GBS core genome. The number of shared genes is plotted as a
function of the number n of strains sequentially added (see Materials and
Methods). For each n, circles are the 8!͞[(n Ϫ 1)!⅐(8 Ϫ n)!] values obtained for
the different strain combinations. Squares are the averages of such values. The
continuous curve represents the least-squares fit of the function Fc ϭ
c exp[Ϫn͞c] ϩ ⍀ (see Eq. 1 in Supporting Text) to data. The best fit was
obtained with correlation r2 ϭ 0.990 for c ϭ 610 Ϯ 38, c ϭ 2.16 Ϯ 0.28, and
⍀ ϭ 1,806 Ϯ 16. The extrapolated GBS core genome size ⍀ is shown as a dashed
line.
Fig. 4. Dendro
was used to cluste
the program CLUS
profiles of presen
and used as inpu
drawing and boo
Serotypes and M
14. the B. anthrac
Genome Diver
phenotypic tra
the capsular p
widely used to
information h
therapy. Rece
conserved cor
correlate with
terize the gen
isolates, a den
genes across t
two belong to
(NEM316 and
Furthermore,
(ST23). Comp
7, which is pub
site) showed th
type often sha
serotype, resu
strains. In sup
at the nucleot
related seroty
the least cons
whereas the tw
identity over 9
(type V and I
Fig. 3. GBS pan-genome. The number of specific genes is plotted as a
function of the number n of strains sequentially added (see Materials and
Methods). For each n, circles are the 8!͞[(n Ϫ 1)!⅐(8 Ϫ n)!] values obtained for
the different strain combinations; squares are the averages of such values. The
blue curve is the least-squares fit of the function Fs(n) ϭ s exp[Ϫn͞s] ϩ tg()
(see Eq. 2 in Supporting Text) to the data. The best fit was obtained with
correlation r2 ϭ 0.995 for s ϭ 476 Ϯ 62, s ϭ 1.51 Ϯ 0.15, and tg() ϭ 33 Ϯ 3.5.
The extrapolated average number tg() of strain-specific genes is shown as a
dashed line. (Inset) Size of the GBS pan-genome as a function of n. The red
curve is the calculated pan-genome size
15. Fig. 4. Dendrogram of the eight GBS genomes. Shared gene information
was used to cluster proteins into groups by using the single-linkage method of
the program CLUSTER (http:͞͞rana.lbl.gov). Groups were then converted into
profiles of presence or absence of each gene (0 or 1) in the eight GBS strains
and used as input to PAUP* 4.0b10 (Sinauer, Sunderland, MA) for dendrogram
drawing and bootstrapping. Numbers at the nodes indicate bootstrap values.
Serotypes and MLST types of each strain are within parentheses.
16. Tettelin et al. Figure 5
Distribution of shared and unique genes sorted by functional categories. Groups of shared genes and strain-specific genes were
sorted by broad functional categories as follows: housekeeping functions, cell envelope proteins, regulatory functions, transport and
binding proteins, mobile and extrachromosomal elements, proteins of unknown function, and hypothetical proteins. The total
number of genes in each of these categories was counted and displayed for groups shared by all eight strains, groups shared by any
combination of seven to two strains, and strain-specific genes.
17. Implications for Bacterial Taxonomy. Methods commonly used to
define bacterial species (DNA⅐DNA reassociation, 16S rRNA
typing, MLST, etc.) rely mostly on features associated with the core
genome (40). Our work confirms that the essence of the species is
linked to the core genome. However, the majority of the genetic
traits linked to virulence, capsular serotype, adaptation, and anti-
biotic resistance pertain to the dispensable genome. Therefore,
sequencing of multiple strains is necessary to understand the
virulence of pathogenic bacteria and to provide a more consistent
definition of the species itself. We identified species with an open
pan-genome, such as GBS and GAS, and species with a closed
pan-genome, such as B. anthracis. Nevertheless, a different inter-
pretation of the same data may lead to the conclusion that the
present definition of bacterial species is inconsistent because, in
reality, only species with an open pan-genome are species, whereas
B. anthracis is not a true genetic species on its own, but only a clone
of Bacillus cereus, with very distinctive phenotypic traits provided by
the acquisition of the virulence plasmid coding for the anthrax
toxin.
18. Concluding Comment. Our data clearly show that the strategy to
sequence one or two genomes per species, which has been used
during the first decade of the genomic era, is not sufficient and that
multiple strains need to be sequenced to understand the basics of
bacterial species. The methods presently used to evaluate the
species diversity, such as complete genome hybridization and
MLST, can explain only the presence, absence, and variability of the
genetic loci that are already known and do not provide information
on the genes that are not present in the reference genome. Our work
provides a clear demonstration that, by these approaches, we fail to
include in the analysis the entire dispensable genome, the size of
which can be vastly larger than the core genome. Our work on the
protein-based vaccine against GBS has shown that this is not just a
theoretical disadvantage but has very important practical conse-
quences because a universal vaccine is possible only by including
dispensable genes (8).