SlideShare ist ein Scribd-Unternehmen logo
1 von 12
Department of Revenue Administration
Municipal Services
TAX RATES 2009
Print Date:                             22-Feb-10


Municipality                Town Valuation        Local Edu Tax    State Edu TaxCounty     Total
ACWORTH                              101,804,235              6.47         7.55       2.38       2.65
ALBANY                               108,574,159              2.16          5.6       2.12       0.99
ALEXANDRIA                           238,425,100              4.01        10.56       2.24       1.16
ALLENSTOWN                           266,789,172              7.94        15.85       2.47       2.78
ALSTEAD                              169,439,370                 6        12.56       2.34       3.11
ALTON                              1,557,305,442                 3         5.19       2.28       1.36
AMHERST                            1,856,029,700              3.38        13.69       2.15       0.97
ANDOVER                              264,149,723               2.3         9.78       2.64       2.68
ANTRIM                               246,223,710             11.79         9.59       2.57       1.19
ASHLAND                              261,844,761              6.53         8.31          2       1.26
ATK. & GILMANTON                          709,574            -3.58        -2.23       2.23       3.58
ATKINSON                           1,016,812,523              2.67         9.53       2.08       0.93
AUBURN                               692,774,959              3.29         8.88       2.27       0.99
BARNSTEAD                            551,545,888              3.68        10.96       2.22       1.28
BARRINGTON                           893,919,731               3.1         10.9       2.28       2.52
BARTLETT                           1,028,806,569              0.95          4.1       2.24       1.01
BATH                                 117,857,935              3.84         7.57       2.31       1.28
BEAN'S GRANT                                2,545            -0.39            0          0       0.39
BEAN'S PURCHASE                            16,880            -3.55        -2.49       2.49       3.55
BEDFORD                            3,341,307,610              3.99        11.95        2.3       1.09
BELMONT                              724,682,218              6.99         9.02       2.35       1.33
BENNINGTON                           112,504,809              9.36        10.66       2.56       1.23
BENTON                                26,123,215             -1.36         8.59       2.26       1.34
BERLIN                               480,754,987             17.41         7.09       2.29       3.03
BETHLEHEM                            254,698,286              6.42        15.02       2.39       1.41
BOSCAWEN                             274,779,525              6.47        10.35       2.29       2.49
BOW                                1,126,037,838              5.06        13.58       2.44        2.5
BRADFORD                             234,481,994              5.63         9.09       2.11        2.5
BRENTWOOD                            519,142,534              3.23        14.22       2.18        0.9
BRIDGEWATER                          377,121,883              2.41         2.42       2.32       1.25
BRISTOL                              563,343,527              4.65         6.84       2.09       1.31
BROOKFIELD                           114,234,083              3.94         7.07       2.08       0.97
BROOKLINE                            575,198,940              4.25        15.91       2.05       1.03
CAMBRIDGE                               8,408,302            -3.54        -2.21       2.16       3.59
CAMPTON                              398,862,393              5.29         9.63       2.52       1.36
CANAAN                               354,757,225              6.19        10.66       2.19       1.24
CANDIA                               397,989,975              4.36        11.97       2.51       1.06
CANTERBURY                           308,146,083              4.06         9.03       2.12       2.48
CARROLL                              399,494,427              3.54         4.48       2.02       3.45
CENTER HARBOR                        470,988,132              3.76         3.08        2.1       1.28
CHANDLER'S PURCHASE          48,958   -3.59   -1.63   1.69   3.53
CHARLESTOWN             284,840,568    5.95   14.29   2.35   2.65
CHATHAM                  50,964,070    0.25    9.19   2.11   0.98
CHESTER                 572,409,200    3.54   11.18    2.1   0.88
CHESTERFIELD            555,574,552    3.17    9.95   2.05   2.85
CHICHESTER              289,118,939    3.29   11.67   2.05    2.5
CLAREMONT               776,055,889   11.86   13.22   2.44   2.93
CLARKSVILLE              40,763,637    3.15    5.11   2.61    4.4
COLEBROOK               189,519,431    7.12    7.98    2.2   3.45
COLUMBIA                 91,434,742    1.93    8.62   1.95   3.25
CONCORD               4,053,531,970    7.49    9.14   2.35   2.69
CONWAY                1,368,950,300    4.59    8.83   2.54   1.12
CORNISH                 184,272,283    2.56   10.67   2.35    2.8
CRAWFORD'S PURCHASE         113,062   -2.06   -3.42    3.3   2.18
CROYDON                  96,518,870    2.51    5.67   2.38   2.53
CUTT'S GRANT                      0       0       0      0      0
DALTON                   94,187,511    4.36    6.76    2.4   3.59
DANBURY                 143,887,450    3.64   10.38    2.1   2.38
DANVILLE                437,085,060    3.31   13.99   2.15   0.85
DEERFIELD               592,282,665    3.13   13.33   2.06   0.89
DEERING                 219,037,061    7.41   10.69   2.15   1.04
DERRY                 2,481,007,745    9.39   14.85   2.59   1.05
DIX GRANT                 1,055,990   -3.56   -2.08   2.08   3.56
DIXVILLE                 16,916,189   -1.65   -1.78   3.18   4.48
DORCHESTER               38,990,332    8.12    8.09   2.31   1.36
DOVER                 2,582,879,950    8.54    9.54   2.52   2.72
DUBLIN                  254,561,601    4.92   10.57   2.28   2.88
DUMMER                   54,569,674   -1.05    9.76   2.08   2.98
DUNBARTON               340,121,143    3.02    8.84    2.3   2.38
DURHAM                  895,039,219    6.52   16.11   2.07    2.3
EAST KINGSTON           293,997,137    6.18    13.5   2.46   0.97
EASTON                   65,362,707    1.61    4.03    2.4   1.39
EATON                   110,191,942    3.72    4.56   2.06   0.96
EFFINGHAM               184,963,022    5.13    7.64   2.31   0.98
ELLSWORTH                15,824,962     4.9    6.34    2.1   1.17
ENFIELD                 542,720,833    5.51    9.98   2.17   1.36
EPPING                  674,267,900    3.27   13.62   2.16    0.9
EPSOM                   451,564,593    4.03    9.13   2.17   2.41
ERROL                    86,587,137    2.15    2.51   2.27   3.58
ERVING'S GRANT               87,381   -3.57   -2.16   2.15   3.58
EXETER                1,607,167,482    6.63    12.6   2.37   1.02
FARMINGTON              467,064,556    6.57    8.22    2.4   2.54
FITZWILLIAM             304,652,691    4.66    13.8   2.19   2.59
FRANCESTOWN             210,191,457    6.27   11.31   2.38   1.04
FRANCONIA               303,753,563    4.08     7.6   2.09   1.25
FRANKLIN                562,675,690     9.8    5.34   2.67   2.78
FREEDOM                 554,409,959    3.41       4   2.12   0.97
FREMONT               429,321,292    3.44   16.62   2.18   0.88
GILFORD             1,547,598,620    4.79    8.55   2.51   1.52
GILMANTON             469,409,125    4.38   12.71   2.49    1.4
GILSUM                 64,312,667    5.98   12.91   2.41   3.04
GOFFSTOWN           1,407,201,100    8.68     9.5   2.41   1.08
GORHAM                317,131,200    8.36    8.84   2.34   3.31
GOSHEN                 80,994,505    7.51   10.56   2.45   2.63
GRAFTON               125,460,764    5.35    9.92   2.16   1.27
GRANTHAM              565,232,437    3.37    8.63   2.11    2.5
GREENFIELD            155,090,311    5.82   11.14    2.4   1.19
GREENLAND             641,004,200    2.01    8.51   2.08   0.95
GREEN'S GRANT           4,040,366    2.97   -2.53   2.46   3.62
GREENVILLE            134,915,899    8.86   10.43    2.1   1.03
GROTON                 77,871,673    4.41    7.58   2.23   1.22
HADLEY'S PURCHASE               0       0       0      0      0
HALE'S LOCATION        74,267,214    1.67   -2.24   2.47   1.18
HAMPSTEAD             982,071,063    2.74   15.02   2.51   1.03
HAMPTON             3,022,027,400    6.41    6.65   2.27   0.95
HAMPTON FALLS         424,424,300       4   11.92   2.36   0.99
HANCOCK               270,907,342    4.78    10.2   2.13   1.04
HANOVER             1,937,340,600    3.96    8.55   2.15   1.32
HARRISVILLE           212,045,017    2.52    5.38   2.37   2.98
HART'S LOCATION        15,299,230    0.01     3.9    2.2   1.01
HAVERHILL             391,294,300     4.8   10.66   2.12    1.2
HEBRON                283,013,639    3.31    0.47   2.23   1.28
HENNIKER              410,879,394    6.84   15.64   2.31   2.49
HILL                  106,357,788    4.54    9.52   2.45   2.71
HILLSBOROUGH          602,299,207     7.6    9.75   2.22   0.97
HINSDALE              328,078,987    6.54   15.17    2.3   2.38
HOLDERNESS            680,542,900    2.43    6.55   2.58    1.4
HOLLIS              1,238,143,033    4.99   12.25   2.38   1.12
HOOKSETT            1,614,242,921    5.89    10.3   2.33   2.64
HOPKINTON             639,509,934    5.08   16.11   2.64      3
HUDSON              2,895,032,545    4.97    7.13   2.22   1.02
JACKSON               382,254,419    3.91    3.06   2.17   0.97
JAFFREY               466,694,545    8.21   10.89   2.29   3.19
JEFFERSON             136,802,338    2.41    7.69   2.15   3.58
KEENE               1,927,915,709   10.94   12.82   2.21   2.83
KENSINGTON            343,348,427    3.59   12.15   2.21   0.92
KILKENNY                   10,572   -3.22       0      0   3.22
KINGSTON              701,063,705    3.54   13.58   2.29   0.93
LACONIA             2,114,274,299    6.95    7.45   2.32   1.32
LANCASTER             284,336,840    7.03    5.27    2.3   3.48
LANDAFF                40,919,708    5.45   11.04   2.56   1.46
LANGDON                67,907,691    5.51   12.19   2.08   2.61
LEBANON             1,776,891,652    8.81   11.19   2.48   1.34
LEE                   493,729,973    4.39   16.58   2.07   2.24
LEMPSTER              171,814,931    4.69    6.59   2.03   1.89
LINCOLN               857,993,107    3.64       2   2.13   1.34
LISBON                111,033,111   11.12   13.47   2.53   1.49
LITCHFIELD            964,971,105    2.28   10.59   1.95    0.9
LITTLETON             794,015,727     6.9   10.57   2.54   1.05
LIVERMORE                 145,080   -1.27   -1.21   1.21   1.27
LONDONDERRY         3,309,970,190    4.65   11.79    2.3   0.94
LOUDON                557,506,036    4.64   10.49   2.22   2.49
LYMAN                  60,909,311    6.55    8.25   2.09   1.26
LYME                  318,872,100    5.45    9.88   2.25   1.36
LYNDEBOROUGH          189,599,834    5.35   11.49   2.16   0.98
MADBURY               239,703,188    2.67   15.98   2.08   2.25
MADISON               476,942,695    3.32    7.09   2.24   0.97
MANCHESTER          9,752,599,500    9.27    5.34   2.22   1.02
MARLBOROUGH           208,583,924    4.51   11.77   2.03   2.64
MARLOW                 69,940,044    7.24    8.66   2.31   3.24
MARTIN'S LOCATION          31,581   -3.29       0      0   3.29
MASON                 171,887,229    5.63    9.99    2.1   1.03
MEREDITH            1,820,649,639    4.23    4.54    2.4   1.37
MERRIMACK           3,223,417,530    4.23   11.81   2.14   0.99
MIDDLETON             180,840,741    7.09    5.55   2.36    2.3
MILAN                 124,779,558    3.83    8.18    2.5   3.48
MILFORD             1,579,027,248    4.47   11.63   2.12   0.99
MILLSFIELD              7,282,682   -6.92    1.31   2.06   3.55
MILTON                385,487,966     6.3   11.18    2.6   2.68
MONROE                341,164,082    1.66    5.28   2.15   0.67
MONT VERNON           250,748,290    3.88   16.85   2.41   1.16
MOULTONBOROUGH      2,833,023,218    2.22    2.14   2.31   1.03
NASHUA              8,389,365,623    7.91    8.37   2.42   1.12
NELSON                120,768,776    3.89    8.43   1.78    2.8
NEW BOSTON            658,477,459    3.98    9.04   2.01   0.93
NEW CASTLE            706,688,793    1.58    0.23   2.23   0.93
NEW DURHAM            436,201,420    6.32    9.23   2.28   2.41
NEW HAMPTON           323,235,360    4.59    8.58   2.05   1.23
NEW IPSWICH           412,978,574    2.87   17.01   2.42   1.08
NEW LONDON          1,068,618,900    4.04    5.66   2.51   2.86
NEWBURY               703,753,072    3.46    5.35   2.31   2.63
NEWFIELDS             255,764,296    4.18   13.79   2.29   0.94
NEWINGTON             914,880,855    4.94    0.58   2.41   0.98
NEWMARKET             711,946,495    5.74   12.68   2.44   1.01
NEWPORT               494,604,821    8.71   10.27   2.23   2.61
NEWTON                552,330,011     2.8    13.4   1.97   0.79
NORTH HAMPTON       1,002,715,700    4.09    7.29   2.11   0.99
NORTHFIELD            350,994,675    6.08     9.1   2.25   2.55
NORTHUMBERLAND        137,374,890    7.58     9.6    2.6   3.33
NORTHWOOD             556,879,302    3.41   13.49   2.11   0.84
NOTTINGHAM            639,448,552    3.48    9.69   2.12   0.87
ODELL                      2,922,060   -3.49   -1.82   1.75   3.56
ORANGE                    28,561,123    4.05   11.92   2.12   1.44
ORFORD                   156,992,849    3.51   14.73    2.1   1.34
OSSIPEE                  757,346,366    4.86    5.86   2.21   0.97
PELHAM                 1,415,578,820    5.44   10.46    2.5   1.17
PEMBROKE                 618,907,585    6.03    13.8   2.39   2.58
PETERBOROUGH             696,847,865    6.99   12.15   2.33   1.18
PIERMONT                  92,043,138    6.17   13.23   2.51   1.48
PINKHAM'S GRANT            2,864,118    5.61   -2.59    2.6   3.65
PITTSBURG                279,675,036    1.37    5.99   2.44    3.7
PITTSFIELD               313,449,563    7.95   13.18   2.14   2.51
PLAINFIELD               276,170,311    4.24   12.78   2.19   2.79
PLAISTOW                 833,761,946    6.42   13.78   2.72   1.08
PLYMOUTH                 445,048,322    6.25    9.11   2.13   1.25
PORTSMOUTH             3,807,536,521    8.01    5.72   2.32   1.04
RANDOLPH                  67,349,980    3.44    5.12   1.87   3.16
RAYMOND                1,002,672,246    4.45   10.93   2.09   0.87
RICHMOND                 102,622,710    3.45   13.13   2.33   2.95
RINDGE                   574,709,128     3.8    12.8   2.31   2.83
ROCHESTER              2,071,475,412    7.18   10.54   2.53   2.69
ROLLINSFORD              285,255,673    2.36   11.59   2.12   2.22
ROXBURY                   24,706,131   -1.22   17.99   2.83   3.25
RUMNEY                   191,169,278    3.99    9.98   2.43   1.31
RYE                    1,826,836,300    2.87    3.65   2.34   0.96
SALEM                  4,650,084,748    4.79    6.21   2.12   0.93
SALISBURY                152,964,057    3.05   10.49   2.26   2.49
SANBORNTON               428,487,596    6.73    8.54   2.23   1.41
SANDOWN                  585,081,910    3.38   12.99   2.21   0.97
SANDWICH                 439,013,129    3.09    3.29    2.1   1.02
SARGENT'S PURCHASE         1,852,720   -3.43   -3.06   2.94   3.55
SEABROOK               2,735,365,300    5.28     4.4   2.31   0.96
SECOND COLLEGE GRANT       1,497,304   -3.45   -2.18   2.05   3.58
SHARON                    54,043,435    5.31   10.84   2.52   1.25
SHELBURNE                 82,502,447    2.59     6.2   2.17    3.3
SOMERSWORTH              833,497,008    8.34   12.29   2.51   2.67
SOUTH HAMPTON            161,048,177    2.15    9.68   1.96   0.93
SPRINGFIELD              213,145,351    3.82    9.56   2.27   2.55
STARK                     68,550,167    3.78     6.6   2.22   3.35
STEWARTSTOWN             114,141,250    3.59     8.8   1.89   3.34
STODDARD                 277,625,520    1.68    4.27   2.18   2.91
STRAFFORD                495,678,500    1.98   12.15   2.11   2.32
STRATFORD                 77,909,830    5.34    11.7    2.3   3.26
STRATHAM               1,194,843,681    3.27   11.59   2.25   0.95
SUCCESS                   11,387,979   -3.53   -1.61   1.59   3.55
SUGAR HILL               147,832,578     7.1    5.84   1.97    1.4
SULLIVAN                  54,853,267     7.5   12.22    2.3   3.06
SUNAPEE                1,082,659,308    3.03    5.89   2.52   2.83
SURRY                      81,062,968    2.48    7.19   2.24   2.94
SUTTON                    299,508,001    5.19    8.42   2.24   2.48
SWANZEY                   565,691,938    4.58   14.87   2.35   2.95
TAMWORTH                  366,464,432    4.29   10.19   2.55   0.94
TEMPLE                    151,359,245    5.16   12.23   2.51   1.22
THOM. & MES. PURCHASE       5,450,667   -2.12   -2.67   2.31   3.84
THORNTON                  361,703,400    4.39    8.95   2.41   1.39
TILTON                    519,211,774    7.48    7.75   2.68   1.34
TROY                      130,186,648    8.68    12.6   2.51   2.96
TUFTONBORO              1,056,166,697    2.52    3.13   2.39   0.97
UNITY                     131,202,650    5.12    8.82   2.35    2.9
WAKEFIELD               1,004,969,565    2.85    4.59   2.23   0.98
WALPOLE                   443,902,046    3.66    9.97   2.11   2.79
WARNER                    286,145,570    8.85    9.98   2.12   2.65
WARREN                     85,470,046    3.83   11.34    2.3   1.27
WASHINGTON                271,945,563    4.99    7.35    2.1   2.64
WATERVILLE VALLEY         360,407,078    7.58    0.44   2.29   1.37
WEARE                     930,809,800    2.76   10.78   2.12   0.94
WEBSTER                   229,569,922    3.71    9.03   2.28    2.4
WENTWORTH                 108,236,776    2.49    8.48   2.32   1.37
WENTWORTH LOCATION          9,417,977   -1.37     0.9   2.08   3.62
WESTMORELAND              204,377,748    3.08    8.48   2.01   2.77
WHITEFIELD                202,425,370    7.47    6.79   2.26   3.42
WILMOT                    189,655,369    3.53    9.64    2.4   2.69
WILTON                    460,552,448    3.78   10.02   2.12   0.96
WINCHESTER                281,735,078    7.09   14.72   2.35   2.78
WINDHAM                 2,275,366,370    3.45   12.46   2.09   0.92
WINDSOR                    27,764,349    5.47    7.79   2.33   1.23
WOLFEBORO               2,051,930,195    3.38    3.96   2.23   1.04
WOODSTOCK                 256,614,376    6.57    5.42   2.28   1.28
Tax
      19.05
      10.87
      17.97
      29.04
      24.01
      11.83
      20.19
       17.4
      25.14
       18.1
          0
      15.21
      15.43
      18.14
       18.8
        8.3
         15
          0
          0
      19.33
      19.69
      23.81
      10.83
      29.82
      25.24
       21.6
      23.58
      19.33
      20.53
        8.4
      14.89
      14.06
      23.24
          0
       18.8
      20.28
       19.9
      17.69
      13.49
      10.22
0
25.24
12.53
 17.7
18.02
19.51
30.45
15.27
20.75
15.75
21.67
17.08
18.38
    0
13.09
    0
17.11
 18.5
 20.3
19.41
21.29
27.88
    0
 4.23
19.88
23.32
20.65
13.77
16.54
   27
23.11
 9.43
 11.3
16.06
14.51
19.02
19.95
17.74
10.51
    0
22.62
19.73
23.24
   21
15.02
20.59
 10.5
23.12
17.37
20.98
24.34
21.67
22.85
23.15
 18.7
16.61
20.55
13.55
 6.52
22.42
15.44
    0
 3.08
 21.3
16.28
19.27
18.15
15.98
13.25
 7.12
18.78
 7.29
27.28
19.22
20.54
26.39
12.96
20.74
21.16
26.83
15.34
10.11
24.58
15.83
 28.8
18.87
    0
20.34
18.04
18.08
20.51
22.39
23.82
25.28
15.2
 9.11
28.61
15.72
21.06
    0
19.68
19.84
18.15
18.94
19.98
22.98
13.62
17.85
20.95
21.45
    0
18.75
12.54
19.17
 17.3
17.99
19.21
    0
22.76
 9.76
 24.3
  7.7
19.82
 16.9
15.96
 4.97
20.24
16.45
23.38
15.07
13.75
 21.2
 8.91
21.87
23.82
18.96
14.48
19.98
23.11
19.85
16.16
0
19.53
21.68
 13.9
19.57
 24.8
22.65
23.39
 9.27
 13.5
25.78
   22
   24
18.74
17.09
13.59
18.34
21.86
21.74
22.94
18.29
22.85
17.71
 9.82
14.05
18.29
18.91
19.55
  9.5
    0
12.95
    0
19.92
14.26
25.81
14.72
 18.2
15.95
17.62
11.04
18.56
 22.6
18.06
    0
16.31
25.08
14.27
14.85
18.33
24.75
17.97
21.12
 1.36
17.14
19.25
26.75
 9.01
19.19
10.65
18.53
 23.6
18.74
17.08
11.68
 16.6
17.42
14.66
 5.23
16.34
19.94
18.26
16.88
26.94
18.92
16.82
10.61
15.55

Weitere ähnliche Inhalte

Was ist angesagt?

Was ist angesagt? (6)

Baja wf
Baja wfBaja wf
Baja wf
 
Perry 4.26.12
Perry 4.26.12Perry 4.26.12
Perry 4.26.12
 
Catalogo codiacero
Catalogo codiaceroCatalogo codiacero
Catalogo codiacero
 
Cottonwood Stats Report for February
Cottonwood Stats Report for FebruaryCottonwood Stats Report for February
Cottonwood Stats Report for February
 
Box Plots
Box PlotsBox Plots
Box Plots
 
Surefoot Colorado Ski Cup | Overall
Surefoot Colorado Ski Cup | OverallSurefoot Colorado Ski Cup | Overall
Surefoot Colorado Ski Cup | Overall
 

Andere mochten auch

First results from the LHC
First results from the LHCFirst results from the LHC
First results from the LHCSander Klous
 
Physics Data Processing - The online connection
Physics Data Processing - The online connectionPhysics Data Processing - The online connection
Physics Data Processing - The online connectionSander Klous
 
Cone Beam Dental CT, Case Synopsis
Cone Beam Dental CT, Case SynopsisCone Beam Dental CT, Case Synopsis
Cone Beam Dental CT, Case SynopsisMahajan Imaging
 
Rescuing and preserving old software
Rescuing and preserving old softwareRescuing and preserving old software
Rescuing and preserving old softwareNathan Wade
 
Jalios JCMS - iPhone Preview
Jalios JCMS - iPhone PreviewJalios JCMS - iPhone Preview
Jalios JCMS - iPhone Previewdedieu
 
C:\Documents And Settings\Aghezzi\Desktop\Property Tax\2009 Ma 2 Property Taxes
C:\Documents And Settings\Aghezzi\Desktop\Property Tax\2009 Ma 2 Property TaxesC:\Documents And Settings\Aghezzi\Desktop\Property Tax\2009 Ma 2 Property Taxes
C:\Documents And Settings\Aghezzi\Desktop\Property Tax\2009 Ma 2 Property Taxesoutdoormojo
 
C:\Documents And Settings\Aghezzi\Desktop\Property Tax\2009 Ma 3 Property Taxes
C:\Documents And Settings\Aghezzi\Desktop\Property Tax\2009 Ma 3 Property TaxesC:\Documents And Settings\Aghezzi\Desktop\Property Tax\2009 Ma 3 Property Taxes
C:\Documents And Settings\Aghezzi\Desktop\Property Tax\2009 Ma 3 Property Taxesoutdoormojo
 
Premier Office Solutions Refurbished Leed Credits
Premier Office Solutions  Refurbished Leed CreditsPremier Office Solutions  Refurbished Leed Credits
Premier Office Solutions Refurbished Leed Creditschuckepstein
 
Cone Beam Dental CT, Case Synopsis
Cone Beam Dental CT, Case SynopsisCone Beam Dental CT, Case Synopsis
Cone Beam Dental CT, Case SynopsisMahajan Imaging
 
Stranger In A Strange Land
Stranger In A Strange LandStranger In A Strange Land
Stranger In A Strange LandElese_Tonelli
 

Andere mochten auch (15)

First results from the LHC
First results from the LHCFirst results from the LHC
First results from the LHC
 
Physics Data Processing - The online connection
Physics Data Processing - The online connectionPhysics Data Processing - The online connection
Physics Data Processing - The online connection
 
NMDL 09
NMDL 09NMDL 09
NMDL 09
 
Cone Beam Dental CT, Case Synopsis
Cone Beam Dental CT, Case SynopsisCone Beam Dental CT, Case Synopsis
Cone Beam Dental CT, Case Synopsis
 
Rescuing and preserving old software
Rescuing and preserving old softwareRescuing and preserving old software
Rescuing and preserving old software
 
Jalios JCMS - iPhone Preview
Jalios JCMS - iPhone PreviewJalios JCMS - iPhone Preview
Jalios JCMS - iPhone Preview
 
C:\Documents And Settings\Aghezzi\Desktop\Property Tax\2009 Ma 2 Property Taxes
C:\Documents And Settings\Aghezzi\Desktop\Property Tax\2009 Ma 2 Property TaxesC:\Documents And Settings\Aghezzi\Desktop\Property Tax\2009 Ma 2 Property Taxes
C:\Documents And Settings\Aghezzi\Desktop\Property Tax\2009 Ma 2 Property Taxes
 
Lightscribe
LightscribeLightscribe
Lightscribe
 
Twitter Promotions
Twitter PromotionsTwitter Promotions
Twitter Promotions
 
Meet the duck
Meet the duckMeet the duck
Meet the duck
 
C:\Documents And Settings\Aghezzi\Desktop\Property Tax\2009 Ma 3 Property Taxes
C:\Documents And Settings\Aghezzi\Desktop\Property Tax\2009 Ma 3 Property TaxesC:\Documents And Settings\Aghezzi\Desktop\Property Tax\2009 Ma 3 Property Taxes
C:\Documents And Settings\Aghezzi\Desktop\Property Tax\2009 Ma 3 Property Taxes
 
julia.lin_objects
julia.lin_objectsjulia.lin_objects
julia.lin_objects
 
Premier Office Solutions Refurbished Leed Credits
Premier Office Solutions  Refurbished Leed CreditsPremier Office Solutions  Refurbished Leed Credits
Premier Office Solutions Refurbished Leed Credits
 
Cone Beam Dental CT, Case Synopsis
Cone Beam Dental CT, Case SynopsisCone Beam Dental CT, Case Synopsis
Cone Beam Dental CT, Case Synopsis
 
Stranger In A Strange Land
Stranger In A Strange LandStranger In A Strange Land
Stranger In A Strange Land
 

Ähnlich wie C:\Documents And Settings\Aghezzi\Desktop\Property Tax\2009 Nh Property Taxes

C:\Documents And Settings\Aghezzi\Desktop\Property Tax\2009 Ma 2 Property Taxes
C:\Documents And Settings\Aghezzi\Desktop\Property Tax\2009 Ma 2 Property TaxesC:\Documents And Settings\Aghezzi\Desktop\Property Tax\2009 Ma 2 Property Taxes
C:\Documents And Settings\Aghezzi\Desktop\Property Tax\2009 Ma 2 Property Taxesguest5b2e9b1
 
Pivot Table Calculate Data In Pivot Table Reports In Excel 2007
Pivot Table   Calculate Data In Pivot Table Reports In Excel 2007Pivot Table   Calculate Data In Pivot Table Reports In Excel 2007
Pivot Table Calculate Data In Pivot Table Reports In Excel 2007Snigdha Parida
 
Comprehensive IIEC final 2010 refferendum results 09/ 08 /2010
Comprehensive IIEC final 2010 refferendum results 09/ 08 /2010Comprehensive IIEC final 2010 refferendum results 09/ 08 /2010
Comprehensive IIEC final 2010 refferendum results 09/ 08 /2010Leonardus Ouma
 
Fondo Federal Solidario Abril 2009 - Mayo 2015
Fondo Federal Solidario Abril 2009 - Mayo 2015Fondo Federal Solidario Abril 2009 - Mayo 2015
Fondo Federal Solidario Abril 2009 - Mayo 2015Eduardo Nelson German
 
Stephen Cameron (Scottish Shellfish Marketing Group) - "The Promotion of Cult...
Stephen Cameron (Scottish Shellfish Marketing Group) - "The Promotion of Cult...Stephen Cameron (Scottish Shellfish Marketing Group) - "The Promotion of Cult...
Stephen Cameron (Scottish Shellfish Marketing Group) - "The Promotion of Cult...Shellfish Association
 
Withholding tax response 2011
Withholding tax response 2011Withholding tax response 2011
Withholding tax response 2011Mohammad Azam
 
Cottonwood Stats Report for March
Cottonwood Stats Report for MarchCottonwood Stats Report for March
Cottonwood Stats Report for MarchDamian Bruno
 
PoblacióN Cert 2004 Dane
PoblacióN Cert 2004 DanePoblacióN Cert 2004 Dane
PoblacióN Cert 2004 DaneJOSESANCHEZ22
 
January - February 2016 - Export Statistics of Turkish Citrus
January - February 2016 - Export Statistics of Turkish CitrusJanuary - February 2016 - Export Statistics of Turkish Citrus
January - February 2016 - Export Statistics of Turkish CitrusTurkish Citrus Promotion Group
 
2012 Air Pollution Caused by Marcellus Shale Drilling in PA Counties
2012 Air Pollution Caused by Marcellus Shale Drilling in PA Counties2012 Air Pollution Caused by Marcellus Shale Drilling in PA Counties
2012 Air Pollution Caused by Marcellus Shale Drilling in PA CountiesMarcellus Drilling News
 

Ähnlich wie C:\Documents And Settings\Aghezzi\Desktop\Property Tax\2009 Nh Property Taxes (20)

C:\Documents And Settings\Aghezzi\Desktop\Property Tax\2009 Ma 2 Property Taxes
C:\Documents And Settings\Aghezzi\Desktop\Property Tax\2009 Ma 2 Property TaxesC:\Documents And Settings\Aghezzi\Desktop\Property Tax\2009 Ma 2 Property Taxes
C:\Documents And Settings\Aghezzi\Desktop\Property Tax\2009 Ma 2 Property Taxes
 
Corporates 2010
Corporates 2010Corporates 2010
Corporates 2010
 
Pivot Table Calculate Data In Pivot Table Reports In Excel 2007
Pivot Table   Calculate Data In Pivot Table Reports In Excel 2007Pivot Table   Calculate Data In Pivot Table Reports In Excel 2007
Pivot Table Calculate Data In Pivot Table Reports In Excel 2007
 
Comprehensive IIEC final 2010 refferendum results 09/ 08 /2010
Comprehensive IIEC final 2010 refferendum results 09/ 08 /2010Comprehensive IIEC final 2010 refferendum results 09/ 08 /2010
Comprehensive IIEC final 2010 refferendum results 09/ 08 /2010
 
Fondo Federal Solidario Abril 2009 - Mayo 2015
Fondo Federal Solidario Abril 2009 - Mayo 2015Fondo Federal Solidario Abril 2009 - Mayo 2015
Fondo Federal Solidario Abril 2009 - Mayo 2015
 
2011 Test Plot Book
2011 Test Plot Book2011 Test Plot Book
2011 Test Plot Book
 
Stephen Cameron (Scottish Shellfish Marketing Group) - "The Promotion of Cult...
Stephen Cameron (Scottish Shellfish Marketing Group) - "The Promotion of Cult...Stephen Cameron (Scottish Shellfish Marketing Group) - "The Promotion of Cult...
Stephen Cameron (Scottish Shellfish Marketing Group) - "The Promotion of Cult...
 
Withholding tax response 2011
Withholding tax response 2011Withholding tax response 2011
Withholding tax response 2011
 
Cottonwood Stats Report for March
Cottonwood Stats Report for MarchCottonwood Stats Report for March
Cottonwood Stats Report for March
 
PoblacióN Cert 2004 Dane
PoblacióN Cert 2004 DanePoblacióN Cert 2004 Dane
PoblacióN Cert 2004 Dane
 
6
66
6
 
6
66
6
 
Frijol para blog
Frijol para blogFrijol para blog
Frijol para blog
 
January - February 2016 - Export Statistics of Turkish Citrus
January - February 2016 - Export Statistics of Turkish CitrusJanuary - February 2016 - Export Statistics of Turkish Citrus
January - February 2016 - Export Statistics of Turkish Citrus
 
Gsom1
Gsom1Gsom1
Gsom1
 
7
77
7
 
7
77
7
 
October 2016 - Export Statistics of Turkish Citrus
October 2016 - Export Statistics of Turkish CitrusOctober 2016 - Export Statistics of Turkish Citrus
October 2016 - Export Statistics of Turkish Citrus
 
2012 Air Pollution Caused by Marcellus Shale Drilling in PA Counties
2012 Air Pollution Caused by Marcellus Shale Drilling in PA Counties2012 Air Pollution Caused by Marcellus Shale Drilling in PA Counties
2012 Air Pollution Caused by Marcellus Shale Drilling in PA Counties
 
Aga table
Aga tableAga table
Aga table
 

Kürzlich hochgeladen

Call US-88OO1O2216 Call Girls In Mahipalpur Female Escort Service
Call US-88OO1O2216 Call Girls In Mahipalpur Female Escort ServiceCall US-88OO1O2216 Call Girls In Mahipalpur Female Escort Service
Call US-88OO1O2216 Call Girls In Mahipalpur Female Escort Servicecallgirls2057
 
Digital Transformation in the PLM domain - distrib.pdf
Digital Transformation in the PLM domain - distrib.pdfDigital Transformation in the PLM domain - distrib.pdf
Digital Transformation in the PLM domain - distrib.pdfJos Voskuil
 
Future Of Sample Report 2024 | Redacted Version
Future Of Sample Report 2024 | Redacted VersionFuture Of Sample Report 2024 | Redacted Version
Future Of Sample Report 2024 | Redacted VersionMintel Group
 
Islamabad Escorts | Call 03070433345 | Escort Service in Islamabad
Islamabad Escorts | Call 03070433345 | Escort Service in IslamabadIslamabad Escorts | Call 03070433345 | Escort Service in Islamabad
Islamabad Escorts | Call 03070433345 | Escort Service in IslamabadAyesha Khan
 
Memorándum de Entendimiento (MoU) entre Codelco y SQM
Memorándum de Entendimiento (MoU) entre Codelco y SQMMemorándum de Entendimiento (MoU) entre Codelco y SQM
Memorándum de Entendimiento (MoU) entre Codelco y SQMVoces Mineras
 
PSCC - Capability Statement Presentation
PSCC - Capability Statement PresentationPSCC - Capability Statement Presentation
PSCC - Capability Statement PresentationAnamaria Contreras
 
NewBase 19 April 2024 Energy News issue - 1717 by Khaled Al Awadi.pdf
NewBase  19 April  2024  Energy News issue - 1717 by Khaled Al Awadi.pdfNewBase  19 April  2024  Energy News issue - 1717 by Khaled Al Awadi.pdf
NewBase 19 April 2024 Energy News issue - 1717 by Khaled Al Awadi.pdfKhaled Al Awadi
 
8447779800, Low rate Call girls in Kotla Mubarakpur Delhi NCR
8447779800, Low rate Call girls in Kotla Mubarakpur Delhi NCR8447779800, Low rate Call girls in Kotla Mubarakpur Delhi NCR
8447779800, Low rate Call girls in Kotla Mubarakpur Delhi NCRashishs7044
 
IoT Insurance Observatory: summary 2024
IoT Insurance Observatory:  summary 2024IoT Insurance Observatory:  summary 2024
IoT Insurance Observatory: summary 2024Matteo Carbone
 
Case study on tata clothing brand zudio in detail
Case study on tata clothing brand zudio in detailCase study on tata clothing brand zudio in detail
Case study on tata clothing brand zudio in detailAriel592675
 
Independent Call Girls Andheri Nightlaila 9967584737
Independent Call Girls Andheri Nightlaila 9967584737Independent Call Girls Andheri Nightlaila 9967584737
Independent Call Girls Andheri Nightlaila 9967584737Riya Pathan
 
Market Sizes Sample Report - 2024 Edition
Market Sizes Sample Report - 2024 EditionMarket Sizes Sample Report - 2024 Edition
Market Sizes Sample Report - 2024 EditionMintel Group
 
Contemporary Economic Issues Facing the Filipino Entrepreneur (1).pptx
Contemporary Economic Issues Facing the Filipino Entrepreneur (1).pptxContemporary Economic Issues Facing the Filipino Entrepreneur (1).pptx
Contemporary Economic Issues Facing the Filipino Entrepreneur (1).pptxMarkAnthonyAurellano
 
MAHA Global and IPR: Do Actions Speak Louder Than Words?
MAHA Global and IPR: Do Actions Speak Louder Than Words?MAHA Global and IPR: Do Actions Speak Louder Than Words?
MAHA Global and IPR: Do Actions Speak Louder Than Words?Olivia Kresic
 
2024 Numerator Consumer Study of Cannabis Usage
2024 Numerator Consumer Study of Cannabis Usage2024 Numerator Consumer Study of Cannabis Usage
2024 Numerator Consumer Study of Cannabis UsageNeil Kimberley
 
Annual General Meeting Presentation Slides
Annual General Meeting Presentation SlidesAnnual General Meeting Presentation Slides
Annual General Meeting Presentation SlidesKeppelCorporation
 
8447779800, Low rate Call girls in Rohini Delhi NCR
8447779800, Low rate Call girls in Rohini Delhi NCR8447779800, Low rate Call girls in Rohini Delhi NCR
8447779800, Low rate Call girls in Rohini Delhi NCRashishs7044
 
Ten Organizational Design Models to align structure and operations to busines...
Ten Organizational Design Models to align structure and operations to busines...Ten Organizational Design Models to align structure and operations to busines...
Ten Organizational Design Models to align structure and operations to busines...Seta Wicaksana
 

Kürzlich hochgeladen (20)

Call US-88OO1O2216 Call Girls In Mahipalpur Female Escort Service
Call US-88OO1O2216 Call Girls In Mahipalpur Female Escort ServiceCall US-88OO1O2216 Call Girls In Mahipalpur Female Escort Service
Call US-88OO1O2216 Call Girls In Mahipalpur Female Escort Service
 
Japan IT Week 2024 Brochure by 47Billion (English)
Japan IT Week 2024 Brochure by 47Billion (English)Japan IT Week 2024 Brochure by 47Billion (English)
Japan IT Week 2024 Brochure by 47Billion (English)
 
Digital Transformation in the PLM domain - distrib.pdf
Digital Transformation in the PLM domain - distrib.pdfDigital Transformation in the PLM domain - distrib.pdf
Digital Transformation in the PLM domain - distrib.pdf
 
Future Of Sample Report 2024 | Redacted Version
Future Of Sample Report 2024 | Redacted VersionFuture Of Sample Report 2024 | Redacted Version
Future Of Sample Report 2024 | Redacted Version
 
Islamabad Escorts | Call 03070433345 | Escort Service in Islamabad
Islamabad Escorts | Call 03070433345 | Escort Service in IslamabadIslamabad Escorts | Call 03070433345 | Escort Service in Islamabad
Islamabad Escorts | Call 03070433345 | Escort Service in Islamabad
 
Memorándum de Entendimiento (MoU) entre Codelco y SQM
Memorándum de Entendimiento (MoU) entre Codelco y SQMMemorándum de Entendimiento (MoU) entre Codelco y SQM
Memorándum de Entendimiento (MoU) entre Codelco y SQM
 
PSCC - Capability Statement Presentation
PSCC - Capability Statement PresentationPSCC - Capability Statement Presentation
PSCC - Capability Statement Presentation
 
NewBase 19 April 2024 Energy News issue - 1717 by Khaled Al Awadi.pdf
NewBase  19 April  2024  Energy News issue - 1717 by Khaled Al Awadi.pdfNewBase  19 April  2024  Energy News issue - 1717 by Khaled Al Awadi.pdf
NewBase 19 April 2024 Energy News issue - 1717 by Khaled Al Awadi.pdf
 
8447779800, Low rate Call girls in Kotla Mubarakpur Delhi NCR
8447779800, Low rate Call girls in Kotla Mubarakpur Delhi NCR8447779800, Low rate Call girls in Kotla Mubarakpur Delhi NCR
8447779800, Low rate Call girls in Kotla Mubarakpur Delhi NCR
 
Call Us ➥9319373153▻Call Girls In North Goa
Call Us ➥9319373153▻Call Girls In North GoaCall Us ➥9319373153▻Call Girls In North Goa
Call Us ➥9319373153▻Call Girls In North Goa
 
IoT Insurance Observatory: summary 2024
IoT Insurance Observatory:  summary 2024IoT Insurance Observatory:  summary 2024
IoT Insurance Observatory: summary 2024
 
Case study on tata clothing brand zudio in detail
Case study on tata clothing brand zudio in detailCase study on tata clothing brand zudio in detail
Case study on tata clothing brand zudio in detail
 
Independent Call Girls Andheri Nightlaila 9967584737
Independent Call Girls Andheri Nightlaila 9967584737Independent Call Girls Andheri Nightlaila 9967584737
Independent Call Girls Andheri Nightlaila 9967584737
 
Market Sizes Sample Report - 2024 Edition
Market Sizes Sample Report - 2024 EditionMarket Sizes Sample Report - 2024 Edition
Market Sizes Sample Report - 2024 Edition
 
Contemporary Economic Issues Facing the Filipino Entrepreneur (1).pptx
Contemporary Economic Issues Facing the Filipino Entrepreneur (1).pptxContemporary Economic Issues Facing the Filipino Entrepreneur (1).pptx
Contemporary Economic Issues Facing the Filipino Entrepreneur (1).pptx
 
MAHA Global and IPR: Do Actions Speak Louder Than Words?
MAHA Global and IPR: Do Actions Speak Louder Than Words?MAHA Global and IPR: Do Actions Speak Louder Than Words?
MAHA Global and IPR: Do Actions Speak Louder Than Words?
 
2024 Numerator Consumer Study of Cannabis Usage
2024 Numerator Consumer Study of Cannabis Usage2024 Numerator Consumer Study of Cannabis Usage
2024 Numerator Consumer Study of Cannabis Usage
 
Annual General Meeting Presentation Slides
Annual General Meeting Presentation SlidesAnnual General Meeting Presentation Slides
Annual General Meeting Presentation Slides
 
8447779800, Low rate Call girls in Rohini Delhi NCR
8447779800, Low rate Call girls in Rohini Delhi NCR8447779800, Low rate Call girls in Rohini Delhi NCR
8447779800, Low rate Call girls in Rohini Delhi NCR
 
Ten Organizational Design Models to align structure and operations to busines...
Ten Organizational Design Models to align structure and operations to busines...Ten Organizational Design Models to align structure and operations to busines...
Ten Organizational Design Models to align structure and operations to busines...
 

C:\Documents And Settings\Aghezzi\Desktop\Property Tax\2009 Nh Property Taxes

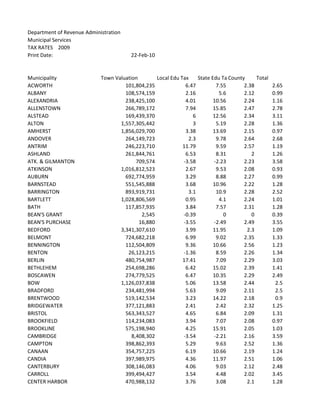
  • 1. Department of Revenue Administration Municipal Services TAX RATES 2009 Print Date: 22-Feb-10 Municipality Town Valuation Local Edu Tax State Edu TaxCounty Total ACWORTH 101,804,235 6.47 7.55 2.38 2.65 ALBANY 108,574,159 2.16 5.6 2.12 0.99 ALEXANDRIA 238,425,100 4.01 10.56 2.24 1.16 ALLENSTOWN 266,789,172 7.94 15.85 2.47 2.78 ALSTEAD 169,439,370 6 12.56 2.34 3.11 ALTON 1,557,305,442 3 5.19 2.28 1.36 AMHERST 1,856,029,700 3.38 13.69 2.15 0.97 ANDOVER 264,149,723 2.3 9.78 2.64 2.68 ANTRIM 246,223,710 11.79 9.59 2.57 1.19 ASHLAND 261,844,761 6.53 8.31 2 1.26 ATK. & GILMANTON 709,574 -3.58 -2.23 2.23 3.58 ATKINSON 1,016,812,523 2.67 9.53 2.08 0.93 AUBURN 692,774,959 3.29 8.88 2.27 0.99 BARNSTEAD 551,545,888 3.68 10.96 2.22 1.28 BARRINGTON 893,919,731 3.1 10.9 2.28 2.52 BARTLETT 1,028,806,569 0.95 4.1 2.24 1.01 BATH 117,857,935 3.84 7.57 2.31 1.28 BEAN'S GRANT 2,545 -0.39 0 0 0.39 BEAN'S PURCHASE 16,880 -3.55 -2.49 2.49 3.55 BEDFORD 3,341,307,610 3.99 11.95 2.3 1.09 BELMONT 724,682,218 6.99 9.02 2.35 1.33 BENNINGTON 112,504,809 9.36 10.66 2.56 1.23 BENTON 26,123,215 -1.36 8.59 2.26 1.34 BERLIN 480,754,987 17.41 7.09 2.29 3.03 BETHLEHEM 254,698,286 6.42 15.02 2.39 1.41 BOSCAWEN 274,779,525 6.47 10.35 2.29 2.49 BOW 1,126,037,838 5.06 13.58 2.44 2.5 BRADFORD 234,481,994 5.63 9.09 2.11 2.5 BRENTWOOD 519,142,534 3.23 14.22 2.18 0.9 BRIDGEWATER 377,121,883 2.41 2.42 2.32 1.25 BRISTOL 563,343,527 4.65 6.84 2.09 1.31 BROOKFIELD 114,234,083 3.94 7.07 2.08 0.97 BROOKLINE 575,198,940 4.25 15.91 2.05 1.03 CAMBRIDGE 8,408,302 -3.54 -2.21 2.16 3.59 CAMPTON 398,862,393 5.29 9.63 2.52 1.36 CANAAN 354,757,225 6.19 10.66 2.19 1.24 CANDIA 397,989,975 4.36 11.97 2.51 1.06 CANTERBURY 308,146,083 4.06 9.03 2.12 2.48 CARROLL 399,494,427 3.54 4.48 2.02 3.45 CENTER HARBOR 470,988,132 3.76 3.08 2.1 1.28
  • 2. CHANDLER'S PURCHASE 48,958 -3.59 -1.63 1.69 3.53 CHARLESTOWN 284,840,568 5.95 14.29 2.35 2.65 CHATHAM 50,964,070 0.25 9.19 2.11 0.98 CHESTER 572,409,200 3.54 11.18 2.1 0.88 CHESTERFIELD 555,574,552 3.17 9.95 2.05 2.85 CHICHESTER 289,118,939 3.29 11.67 2.05 2.5 CLAREMONT 776,055,889 11.86 13.22 2.44 2.93 CLARKSVILLE 40,763,637 3.15 5.11 2.61 4.4 COLEBROOK 189,519,431 7.12 7.98 2.2 3.45 COLUMBIA 91,434,742 1.93 8.62 1.95 3.25 CONCORD 4,053,531,970 7.49 9.14 2.35 2.69 CONWAY 1,368,950,300 4.59 8.83 2.54 1.12 CORNISH 184,272,283 2.56 10.67 2.35 2.8 CRAWFORD'S PURCHASE 113,062 -2.06 -3.42 3.3 2.18 CROYDON 96,518,870 2.51 5.67 2.38 2.53 CUTT'S GRANT 0 0 0 0 0 DALTON 94,187,511 4.36 6.76 2.4 3.59 DANBURY 143,887,450 3.64 10.38 2.1 2.38 DANVILLE 437,085,060 3.31 13.99 2.15 0.85 DEERFIELD 592,282,665 3.13 13.33 2.06 0.89 DEERING 219,037,061 7.41 10.69 2.15 1.04 DERRY 2,481,007,745 9.39 14.85 2.59 1.05 DIX GRANT 1,055,990 -3.56 -2.08 2.08 3.56 DIXVILLE 16,916,189 -1.65 -1.78 3.18 4.48 DORCHESTER 38,990,332 8.12 8.09 2.31 1.36 DOVER 2,582,879,950 8.54 9.54 2.52 2.72 DUBLIN 254,561,601 4.92 10.57 2.28 2.88 DUMMER 54,569,674 -1.05 9.76 2.08 2.98 DUNBARTON 340,121,143 3.02 8.84 2.3 2.38 DURHAM 895,039,219 6.52 16.11 2.07 2.3 EAST KINGSTON 293,997,137 6.18 13.5 2.46 0.97 EASTON 65,362,707 1.61 4.03 2.4 1.39 EATON 110,191,942 3.72 4.56 2.06 0.96 EFFINGHAM 184,963,022 5.13 7.64 2.31 0.98 ELLSWORTH 15,824,962 4.9 6.34 2.1 1.17 ENFIELD 542,720,833 5.51 9.98 2.17 1.36 EPPING 674,267,900 3.27 13.62 2.16 0.9 EPSOM 451,564,593 4.03 9.13 2.17 2.41 ERROL 86,587,137 2.15 2.51 2.27 3.58 ERVING'S GRANT 87,381 -3.57 -2.16 2.15 3.58 EXETER 1,607,167,482 6.63 12.6 2.37 1.02 FARMINGTON 467,064,556 6.57 8.22 2.4 2.54 FITZWILLIAM 304,652,691 4.66 13.8 2.19 2.59 FRANCESTOWN 210,191,457 6.27 11.31 2.38 1.04 FRANCONIA 303,753,563 4.08 7.6 2.09 1.25 FRANKLIN 562,675,690 9.8 5.34 2.67 2.78 FREEDOM 554,409,959 3.41 4 2.12 0.97
  • 3. FREMONT 429,321,292 3.44 16.62 2.18 0.88 GILFORD 1,547,598,620 4.79 8.55 2.51 1.52 GILMANTON 469,409,125 4.38 12.71 2.49 1.4 GILSUM 64,312,667 5.98 12.91 2.41 3.04 GOFFSTOWN 1,407,201,100 8.68 9.5 2.41 1.08 GORHAM 317,131,200 8.36 8.84 2.34 3.31 GOSHEN 80,994,505 7.51 10.56 2.45 2.63 GRAFTON 125,460,764 5.35 9.92 2.16 1.27 GRANTHAM 565,232,437 3.37 8.63 2.11 2.5 GREENFIELD 155,090,311 5.82 11.14 2.4 1.19 GREENLAND 641,004,200 2.01 8.51 2.08 0.95 GREEN'S GRANT 4,040,366 2.97 -2.53 2.46 3.62 GREENVILLE 134,915,899 8.86 10.43 2.1 1.03 GROTON 77,871,673 4.41 7.58 2.23 1.22 HADLEY'S PURCHASE 0 0 0 0 0 HALE'S LOCATION 74,267,214 1.67 -2.24 2.47 1.18 HAMPSTEAD 982,071,063 2.74 15.02 2.51 1.03 HAMPTON 3,022,027,400 6.41 6.65 2.27 0.95 HAMPTON FALLS 424,424,300 4 11.92 2.36 0.99 HANCOCK 270,907,342 4.78 10.2 2.13 1.04 HANOVER 1,937,340,600 3.96 8.55 2.15 1.32 HARRISVILLE 212,045,017 2.52 5.38 2.37 2.98 HART'S LOCATION 15,299,230 0.01 3.9 2.2 1.01 HAVERHILL 391,294,300 4.8 10.66 2.12 1.2 HEBRON 283,013,639 3.31 0.47 2.23 1.28 HENNIKER 410,879,394 6.84 15.64 2.31 2.49 HILL 106,357,788 4.54 9.52 2.45 2.71 HILLSBOROUGH 602,299,207 7.6 9.75 2.22 0.97 HINSDALE 328,078,987 6.54 15.17 2.3 2.38 HOLDERNESS 680,542,900 2.43 6.55 2.58 1.4 HOLLIS 1,238,143,033 4.99 12.25 2.38 1.12 HOOKSETT 1,614,242,921 5.89 10.3 2.33 2.64 HOPKINTON 639,509,934 5.08 16.11 2.64 3 HUDSON 2,895,032,545 4.97 7.13 2.22 1.02 JACKSON 382,254,419 3.91 3.06 2.17 0.97 JAFFREY 466,694,545 8.21 10.89 2.29 3.19 JEFFERSON 136,802,338 2.41 7.69 2.15 3.58 KEENE 1,927,915,709 10.94 12.82 2.21 2.83 KENSINGTON 343,348,427 3.59 12.15 2.21 0.92 KILKENNY 10,572 -3.22 0 0 3.22 KINGSTON 701,063,705 3.54 13.58 2.29 0.93 LACONIA 2,114,274,299 6.95 7.45 2.32 1.32 LANCASTER 284,336,840 7.03 5.27 2.3 3.48 LANDAFF 40,919,708 5.45 11.04 2.56 1.46 LANGDON 67,907,691 5.51 12.19 2.08 2.61 LEBANON 1,776,891,652 8.81 11.19 2.48 1.34 LEE 493,729,973 4.39 16.58 2.07 2.24
  • 4. LEMPSTER 171,814,931 4.69 6.59 2.03 1.89 LINCOLN 857,993,107 3.64 2 2.13 1.34 LISBON 111,033,111 11.12 13.47 2.53 1.49 LITCHFIELD 964,971,105 2.28 10.59 1.95 0.9 LITTLETON 794,015,727 6.9 10.57 2.54 1.05 LIVERMORE 145,080 -1.27 -1.21 1.21 1.27 LONDONDERRY 3,309,970,190 4.65 11.79 2.3 0.94 LOUDON 557,506,036 4.64 10.49 2.22 2.49 LYMAN 60,909,311 6.55 8.25 2.09 1.26 LYME 318,872,100 5.45 9.88 2.25 1.36 LYNDEBOROUGH 189,599,834 5.35 11.49 2.16 0.98 MADBURY 239,703,188 2.67 15.98 2.08 2.25 MADISON 476,942,695 3.32 7.09 2.24 0.97 MANCHESTER 9,752,599,500 9.27 5.34 2.22 1.02 MARLBOROUGH 208,583,924 4.51 11.77 2.03 2.64 MARLOW 69,940,044 7.24 8.66 2.31 3.24 MARTIN'S LOCATION 31,581 -3.29 0 0 3.29 MASON 171,887,229 5.63 9.99 2.1 1.03 MEREDITH 1,820,649,639 4.23 4.54 2.4 1.37 MERRIMACK 3,223,417,530 4.23 11.81 2.14 0.99 MIDDLETON 180,840,741 7.09 5.55 2.36 2.3 MILAN 124,779,558 3.83 8.18 2.5 3.48 MILFORD 1,579,027,248 4.47 11.63 2.12 0.99 MILLSFIELD 7,282,682 -6.92 1.31 2.06 3.55 MILTON 385,487,966 6.3 11.18 2.6 2.68 MONROE 341,164,082 1.66 5.28 2.15 0.67 MONT VERNON 250,748,290 3.88 16.85 2.41 1.16 MOULTONBOROUGH 2,833,023,218 2.22 2.14 2.31 1.03 NASHUA 8,389,365,623 7.91 8.37 2.42 1.12 NELSON 120,768,776 3.89 8.43 1.78 2.8 NEW BOSTON 658,477,459 3.98 9.04 2.01 0.93 NEW CASTLE 706,688,793 1.58 0.23 2.23 0.93 NEW DURHAM 436,201,420 6.32 9.23 2.28 2.41 NEW HAMPTON 323,235,360 4.59 8.58 2.05 1.23 NEW IPSWICH 412,978,574 2.87 17.01 2.42 1.08 NEW LONDON 1,068,618,900 4.04 5.66 2.51 2.86 NEWBURY 703,753,072 3.46 5.35 2.31 2.63 NEWFIELDS 255,764,296 4.18 13.79 2.29 0.94 NEWINGTON 914,880,855 4.94 0.58 2.41 0.98 NEWMARKET 711,946,495 5.74 12.68 2.44 1.01 NEWPORT 494,604,821 8.71 10.27 2.23 2.61 NEWTON 552,330,011 2.8 13.4 1.97 0.79 NORTH HAMPTON 1,002,715,700 4.09 7.29 2.11 0.99 NORTHFIELD 350,994,675 6.08 9.1 2.25 2.55 NORTHUMBERLAND 137,374,890 7.58 9.6 2.6 3.33 NORTHWOOD 556,879,302 3.41 13.49 2.11 0.84 NOTTINGHAM 639,448,552 3.48 9.69 2.12 0.87
  • 5. ODELL 2,922,060 -3.49 -1.82 1.75 3.56 ORANGE 28,561,123 4.05 11.92 2.12 1.44 ORFORD 156,992,849 3.51 14.73 2.1 1.34 OSSIPEE 757,346,366 4.86 5.86 2.21 0.97 PELHAM 1,415,578,820 5.44 10.46 2.5 1.17 PEMBROKE 618,907,585 6.03 13.8 2.39 2.58 PETERBOROUGH 696,847,865 6.99 12.15 2.33 1.18 PIERMONT 92,043,138 6.17 13.23 2.51 1.48 PINKHAM'S GRANT 2,864,118 5.61 -2.59 2.6 3.65 PITTSBURG 279,675,036 1.37 5.99 2.44 3.7 PITTSFIELD 313,449,563 7.95 13.18 2.14 2.51 PLAINFIELD 276,170,311 4.24 12.78 2.19 2.79 PLAISTOW 833,761,946 6.42 13.78 2.72 1.08 PLYMOUTH 445,048,322 6.25 9.11 2.13 1.25 PORTSMOUTH 3,807,536,521 8.01 5.72 2.32 1.04 RANDOLPH 67,349,980 3.44 5.12 1.87 3.16 RAYMOND 1,002,672,246 4.45 10.93 2.09 0.87 RICHMOND 102,622,710 3.45 13.13 2.33 2.95 RINDGE 574,709,128 3.8 12.8 2.31 2.83 ROCHESTER 2,071,475,412 7.18 10.54 2.53 2.69 ROLLINSFORD 285,255,673 2.36 11.59 2.12 2.22 ROXBURY 24,706,131 -1.22 17.99 2.83 3.25 RUMNEY 191,169,278 3.99 9.98 2.43 1.31 RYE 1,826,836,300 2.87 3.65 2.34 0.96 SALEM 4,650,084,748 4.79 6.21 2.12 0.93 SALISBURY 152,964,057 3.05 10.49 2.26 2.49 SANBORNTON 428,487,596 6.73 8.54 2.23 1.41 SANDOWN 585,081,910 3.38 12.99 2.21 0.97 SANDWICH 439,013,129 3.09 3.29 2.1 1.02 SARGENT'S PURCHASE 1,852,720 -3.43 -3.06 2.94 3.55 SEABROOK 2,735,365,300 5.28 4.4 2.31 0.96 SECOND COLLEGE GRANT 1,497,304 -3.45 -2.18 2.05 3.58 SHARON 54,043,435 5.31 10.84 2.52 1.25 SHELBURNE 82,502,447 2.59 6.2 2.17 3.3 SOMERSWORTH 833,497,008 8.34 12.29 2.51 2.67 SOUTH HAMPTON 161,048,177 2.15 9.68 1.96 0.93 SPRINGFIELD 213,145,351 3.82 9.56 2.27 2.55 STARK 68,550,167 3.78 6.6 2.22 3.35 STEWARTSTOWN 114,141,250 3.59 8.8 1.89 3.34 STODDARD 277,625,520 1.68 4.27 2.18 2.91 STRAFFORD 495,678,500 1.98 12.15 2.11 2.32 STRATFORD 77,909,830 5.34 11.7 2.3 3.26 STRATHAM 1,194,843,681 3.27 11.59 2.25 0.95 SUCCESS 11,387,979 -3.53 -1.61 1.59 3.55 SUGAR HILL 147,832,578 7.1 5.84 1.97 1.4 SULLIVAN 54,853,267 7.5 12.22 2.3 3.06 SUNAPEE 1,082,659,308 3.03 5.89 2.52 2.83
  • 6. SURRY 81,062,968 2.48 7.19 2.24 2.94 SUTTON 299,508,001 5.19 8.42 2.24 2.48 SWANZEY 565,691,938 4.58 14.87 2.35 2.95 TAMWORTH 366,464,432 4.29 10.19 2.55 0.94 TEMPLE 151,359,245 5.16 12.23 2.51 1.22 THOM. & MES. PURCHASE 5,450,667 -2.12 -2.67 2.31 3.84 THORNTON 361,703,400 4.39 8.95 2.41 1.39 TILTON 519,211,774 7.48 7.75 2.68 1.34 TROY 130,186,648 8.68 12.6 2.51 2.96 TUFTONBORO 1,056,166,697 2.52 3.13 2.39 0.97 UNITY 131,202,650 5.12 8.82 2.35 2.9 WAKEFIELD 1,004,969,565 2.85 4.59 2.23 0.98 WALPOLE 443,902,046 3.66 9.97 2.11 2.79 WARNER 286,145,570 8.85 9.98 2.12 2.65 WARREN 85,470,046 3.83 11.34 2.3 1.27 WASHINGTON 271,945,563 4.99 7.35 2.1 2.64 WATERVILLE VALLEY 360,407,078 7.58 0.44 2.29 1.37 WEARE 930,809,800 2.76 10.78 2.12 0.94 WEBSTER 229,569,922 3.71 9.03 2.28 2.4 WENTWORTH 108,236,776 2.49 8.48 2.32 1.37 WENTWORTH LOCATION 9,417,977 -1.37 0.9 2.08 3.62 WESTMORELAND 204,377,748 3.08 8.48 2.01 2.77 WHITEFIELD 202,425,370 7.47 6.79 2.26 3.42 WILMOT 189,655,369 3.53 9.64 2.4 2.69 WILTON 460,552,448 3.78 10.02 2.12 0.96 WINCHESTER 281,735,078 7.09 14.72 2.35 2.78 WINDHAM 2,275,366,370 3.45 12.46 2.09 0.92 WINDSOR 27,764,349 5.47 7.79 2.33 1.23 WOLFEBORO 2,051,930,195 3.38 3.96 2.23 1.04 WOODSTOCK 256,614,376 6.57 5.42 2.28 1.28
  • 7. Tax 19.05 10.87 17.97 29.04 24.01 11.83 20.19 17.4 25.14 18.1 0 15.21 15.43 18.14 18.8 8.3 15 0 0 19.33 19.69 23.81 10.83 29.82 25.24 21.6 23.58 19.33 20.53 8.4 14.89 14.06 23.24 0 18.8 20.28 19.9 17.69 13.49 10.22
  • 8. 0 25.24 12.53 17.7 18.02 19.51 30.45 15.27 20.75 15.75 21.67 17.08 18.38 0 13.09 0 17.11 18.5 20.3 19.41 21.29 27.88 0 4.23 19.88 23.32 20.65 13.77 16.54 27 23.11 9.43 11.3 16.06 14.51 19.02 19.95 17.74 10.51 0 22.62 19.73 23.24 21 15.02 20.59 10.5
  • 9. 23.12 17.37 20.98 24.34 21.67 22.85 23.15 18.7 16.61 20.55 13.55 6.52 22.42 15.44 0 3.08 21.3 16.28 19.27 18.15 15.98 13.25 7.12 18.78 7.29 27.28 19.22 20.54 26.39 12.96 20.74 21.16 26.83 15.34 10.11 24.58 15.83 28.8 18.87 0 20.34 18.04 18.08 20.51 22.39 23.82 25.28
  • 10. 15.2 9.11 28.61 15.72 21.06 0 19.68 19.84 18.15 18.94 19.98 22.98 13.62 17.85 20.95 21.45 0 18.75 12.54 19.17 17.3 17.99 19.21 0 22.76 9.76 24.3 7.7 19.82 16.9 15.96 4.97 20.24 16.45 23.38 15.07 13.75 21.2 8.91 21.87 23.82 18.96 14.48 19.98 23.11 19.85 16.16
  • 11. 0 19.53 21.68 13.9 19.57 24.8 22.65 23.39 9.27 13.5 25.78 22 24 18.74 17.09 13.59 18.34 21.86 21.74 22.94 18.29 22.85 17.71 9.82 14.05 18.29 18.91 19.55 9.5 0 12.95 0 19.92 14.26 25.81 14.72 18.2 15.95 17.62 11.04 18.56 22.6 18.06 0 16.31 25.08 14.27
  • 12. 14.85 18.33 24.75 17.97 21.12 1.36 17.14 19.25 26.75 9.01 19.19 10.65 18.53 23.6 18.74 17.08 11.68 16.6 17.42 14.66 5.23 16.34 19.94 18.26 16.88 26.94 18.92 16.82 10.61 15.55