GCSE Decision Making
•Als PPT, PDF herunterladen•
1 gefällt mir•539 views

The document defines key demographic terms like dependency ratio, immigration, emigration, and birth rate. It also lists the A8 countries that joined the EU in 2004. The document contains questions about population pyramids and changes in different countries and regions.
![[object Object],[object Object],[object Object],[object Object],[object Object]](data:image/gif;base64,R0lGODlhAQABAIAAAAAAAP///yH5BAEAAAAALAAAAAABAAEAAAIBRAA7)
Empfohlen
Weitere ähnliche Inhalte
Was ist angesagt?
Was ist angesagt? (17)
Ähnlich wie GCSE Decision Making
Ähnlich wie GCSE Decision Making (20)
Mehr von Mr Cornish
Mehr von Mr Cornish (20)
Kürzlich hochgeladen
Kürzlich hochgeladen (20)
GCSE Decision Making
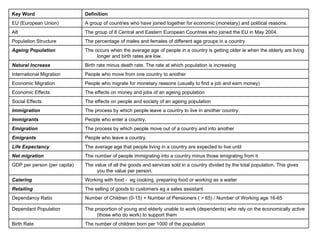
- 1. Number of Children (0-15) + Number of Pensioners ( > 65) / Number of Working age 16-65 Dependancy Ratio The process by which people move out of a country and into another Emigration The group of 8 Central and Eastern European Countries who joined the EU in May 2004. A8 People who enter a country. Immigrants The number of children born per 1000 of the population Birth Rate The proportion of young and elderly unable to work (dependents) who rely on the economically active (those who do work) to support them Dependant Population The selling of goods to customers eg a sales assistant Retailing Working with food - eg cooking, preparing food or working as a waiter Catering The value of all the goods and services sold in a country divided by the total population. This gives you the value per person. GDP per person (per capita) The number of people immigrating into a country minus those emigrating from it Net migration The average age that people living in a country are expected to live until Life Expectancy People who leave a country. Emigrants The process by which people leave a country to live in another country. Immigration The effects on people and society of an ageing population Social Effects The effects on money and jobs of an ageing population Economic Effects People who migrate for monetary reasons (usually to find a job and earn money) Economic Migration People who move from one country to another International Migration Birth rate minus death rate. The rate at which population is increasing Natural Increase The occurs when the average age of people in a country is getting older ie when the elderly are living longer and birth rates are low. Ageing Population The percentage of males and females of different age groups in a country Population Structure A group of countries who have joined together for economic (monetary) and political reasons. EU (European Union) Definition Key Word
- 3. 1. 2. 3. 4. 5. 6. 8. 7. Identify the A8 countries using an atlas.
- 4. Key and scale Work out population for each bar Name each country in Europe Scale
- 5. Shade in using red for decrease and blue for increase. Note the difference in years. Know your A8 countries! What factors other than emmigration could be causing a decrease in the populations of the A8 countries?
- 6. What could the reasons for this decrease be? What happened in 2004 to cause this sudden increase? What were the causes of the decline in natural increase? Note that the graph shows population change not totals. 1992 had more emigrants than immigrants. (link pg 8) Does the increase in natural increase have anything to do with immigrants having children?
- 7. Suggest reasons why Australia & Spain 3 years then leave 2004 onwards Why Poland? Decrease from previous year Increase in 2004 due to A8 1992 emigration exceeds immigration (link to previous slide)
- 8. Please read this carefully. It highlights that immigrants from the A8 mainly settled in rural areas in Eastern England. Decrease from previous year Key points. What does each one tell us about the migrant workers? Why catering, retailing and farming? Note the benefits that workers are entitled to What would the effect of 9.7% of the population in Boston being migrant? Mindmap pros and cons
- 9. The population pyramid is a representation of the age and sex structure of the population. Each bar represents a particular single year of age and the length shows the population of that age. The structure of the pyramid is determined by births, deaths and migration. Match the statements to the graph. from the age of 73 onwards, females outnumber males. 'bulge' of the 'baby boomers' of the 1960s moving into the older age bands. women born during the peak years immediately after World War Two have now reached retirement age (at 60 years). Men born just after WW2 will reach retirement age in 2012 (at 65 years). narrowing of the pyramid appears between the ages of five and 19 reflecting the low fertility rates during the late 1980s and 1990s An increase in fertility rates possibly caused by migrant workers having children. 83% of migrants are between the ages of 18 and 34
- 10. Describe the pattern of UK population change. Suggest how the predicted figures were generated Suggest why the population of the UK could start to level off from 2031
- 11. Which age groups are/ will increase? Which will decrease? Suggest reasons for these changes. What social and economic effects could occur if by 2031 30% of the population are over 60? Remember an aging population can bring benefits as well as negative impacts.
- 12. Which are bringing benefits to the society? How? … and which strains? Why? What services do the elderly require? Which stakeholders are involved? Where does the finance for these services come from?