SlideShare ist ein Scribd-Unternehmen logo
1 von 8
Downloaden Sie, um offline zu lesen
Published: January 12, 2011
r 2011 American Chemical Society 1711 dx.doi.org/10.1021/es102641n |Environ. Sci. Technol. 2011, 45, 1711–1718
ARTICLE
pubs.acs.org/est
Reducing Energy Demand: What Are the Practical Limits?
Jonathan M. Cullen, Julian M. Allwood,* and Edward H. Borgstein
Department of Engineering, University of Cambridge, Trumpington Street, Cambridge CB2 1PZ, United Kingdom
bS Supporting Information
ABSTRACT: Concern over the global energy system, whether driven by climate change, national security, or fears of shortage, is
being discussed widely and in every arena but with a bias toward energy supply options. While demand reduction is often mentioned
in passing, it is rarely a priority for implementation, whether through policy or through the search for innovation. This paper aims to
draw attention to the opportunity for major reduction in energy demand, by presenting an analysis of how much of current global
energy demand could be avoided. Previous work led to a “map” of global energy use that traces the flow of energy from primary
sources (fuels or renewable sources), through fuel refinery, electricity generation, and end-use conversion devices, to passive systems
and the delivery of final energy services (transport, illumination, and sustenance). The key passive systems are presented here and
analyzed through simple engineering models with scalar equations using data based on current global practice. Physically credible
options for change to key design parameters are identified and used to predict the energy savings possible for each system. The result
demonstrates that 73% of global energy use could be saved by practically achievable design changes to passive systems. This
reduction could be increased by further efficiency improvements in conversion devices. A list of the solutions required to achieve
these savings is provided.
’ INTRODUCTION: THE IMPORTANCE OF ENERGY
DEMAND REDUCTION
Three issues drive current interest in present and future global
use of energy: the combustion of fossil fuels as a driver of global
warming, national security related to energy trade, and global
scarcity due to anticipated supply shortages. Possible responses
to these concerns are summarized in the Kaya identity1,2
CO2 emissions ¼ Population Â
GDP
Population
Â
Energy
GDP
Â
CO2 emissions
Energy
ð1Þ
Responses to concerns about energy patterns arising from the
first two terms of eq 1, involving population control or wealth
reduction, would be unprecedented and are far from current
thinking. Most discussion is therefore limited to the third and
forth terms, the technical options of energy efficiency (demand
reduction) and carbon efficiency (supply substitution).
Supply substitution is politically the more attractive of these
two options. This is reflected in the International Energy Agency
(IEA) (ref 3, p 173) figures on worldwide research and devel-
opment expenditure on energy, where less than 10% of spending
has been on energy efficiency in comparison with 40% for nuclear
fission and fusion alone. The well-known catalogue of viable
decarbonization options in the energy supply includes: switching
to less carbon intensive fuels (e.g., from coal to gas), increased
use of renewable energy sources (wind, hydro, solar, and biomass),
increased nuclear power, and development of electricity genera-
tion with carbon capture and storage (CCS). However, as MacKay4
demonstrates, for many countries (such as the U.K.) there is insuf-
ficient land to allow a meaningful switch to renewable supplies,
CCS is still unproven at scale, and the costs of investment in
renewables, nuclear, or CCS solutions are high. As a result, in
anticipating energy scenarios for 2050, the IEA in their most
aggressive BLUE scenario (ref 3, p. 65), which targets a 50%
global reduction in CO2 emissions from current levels, estimate
that 21% of emissions savings will come from renewable energy,
19% from CCS, 18% from fuel switching, and 6% from nuclear,
while energy efficiency measures account for 36% over and above
their anticipated annual 0.9% baseline efficiency improvement.
Are these predictions of future savings from energy efficiency
sensible, conservative, or physically possible? The aim of this
research is to provide a rational basis for assessing the potential
for future developments in energy efficiency. In particular, the
paper aims to answer the question: Given known physically
proven options, how much global energy could be saved while
still delivering current levels of final energy services? This research is
needed because no previous study has provided a physical basis
for examining the efficiency of the global energy system.
Four strands of previous work have been identified, each
contributing to the understanding of global energy efficiency
potential, but none providing an integrated view:
• Comparative methods compare energy use across countries,
sectors, or products. Several reports provide means to com-
pare energy use between different activities, attempting to
prioritize larger energy users for more urgent action. For
example, Summers (ref 5, p 150), the IPCC (ref 6, p 259),
and the World Resources Institute (7, pp 4-5) provide
Received: August 3, 2010
Accepted: December 20, 2010
Revised: December 14, 2010
DownloadedviaETHZURICHonJune9,2020at18:57:55(UTC).
Seehttps://pubs.acs.org/sharingguidelinesforoptionsonhowtolegitimatelysharepublishedarticles.
1712 dx.doi.org/10.1021/es102641n |Environ. Sci. Technol. 2011, 45, 1711–1718
Environmental Science & Technology ARTICLE
Sankey diagrams8
showing the flow of energy from fuel to
economic sectors, the United States Department of Energy
(USDOE)9
, and European Union (EU)10
publish best-prac-
tice energy technology case-studies, and the United Kingdom
(U.K.) Carbon Trust11
attributes national CO2 emissions to
end-use consumer activities. These methods prioritize by
scale but do not attempt to quantify the potential for energy
saving - and cannot be used for this purpose, as they have
insufficient detail on the technologies and do not fully repre-
sent the flow of energy from fuel to final energy service.
Comparative methods, which attribute energy use to economic
sectors ratherthantotechnologies,failtodirectattentiontothe
technical areas where efficiency gains can be made.
• Top-down models aim to track historical trends in efficiency
indicators and extrapolate forward. For example, based on a
20 year trend, the IEA predicts a baseline 1.7% annual
improvement in global energy intensity from structural and
efficiency effects between 2005 and 2050,3
while Pacala and
Socolow12
predict a 1.96% annual improvement in carbon
intensity for the next 50 years. However, such extrapolations
based on past data ignore physical limits and assume that the
underlying components of energy demand are stable, where,
for example, Raupach et al.13
show how the declining trend
in global energy intensity from 1980-2000 was reversed
during the period 2001-2005. In practice, it seems that
these top-down models are useful only for short-term
predictions.
• Bottom-up models survey best-practice efficiency measures
and estimate their combined potential for reducing energy
demand. Recent examples of bottom approaches include
those from the EU,14
International Energy Agency (IEA),15
and U.K. Treasury.16
Bottom-up approaches have the attrac-
tion of being technologically rooted but may be misleading
because they only report known or emerging technologies,
so they fail to capture the potential for innovation and
because they often ignore the connections between devices
in the energy network. Efficiency gains at different points in
the energy network cannot simply be added because a saving
in one technology may often reduce the potential for savings
in a connected device. For example, an improvement to the
aerodynamics of a vehicle will reduce the engine power
requirement, allowing the engine size to be reduced. How-
ever, a reduction in engine size also reduces the possible
energy savings from efficiency improvements to the engine.
Vattenfall’s “abatement curve”,17
McKinsey’s similar work,18
and Pacala and Socolow’s “wedges” 12
are all potentially
misleading for this reason.
• Physical models avoid the emphasis on known innovations
implicit in bottom-up models by calculating theoretical
efficiency limits based on engineering principles. Examples
include the “energy bandwidth studies” of the USDOE
Industrial Technologies Programme9
and 15 societal exergy
studies reviewed by Ertesvag, 19
including an estimate by
Nakicenovic et al.20
that the global efficiency of energy con-
version in 1990 was around 10% of the theoretical limit.
Often theoretical analyses are extremely technical, so they
have been overlooked in broader studies aiming to identify
energy efficiency options. It can be difficult to anticipate how
much of the theoretical efficiency is practically achievable.
Compared to the aims of this paper, we have not been able to
identify any previous work that takes a technical view of the global
energy system, using top-down data to ensure complete cover-
age, but with appropriate and practically based bottom-up phys-
ical models to ensure the practically achievable potential effi-
ciency is identified. This paper aims to fill this gap. In addition, no
existing work distinguishes the possible energy savings from
improvements to conversion devices (e.g., engines, furnaces, and
light-bulbs) from the savings in the surrounding passive systems
(e.g., the building shell, the vehicle body structure, and the space
into which the light shines).
’ GLOBAL ENERGY FLOW
In ref 21, we created a Sankey diagram for current global
energy use, which traces the flow of energy from primary sources
(fuels or renewable sources), through energy conversion devices
and passive systems, to final energy services (for example, trans-
port, illumination, and sustenance). Central to our understand-
ing of the flow of energy through the global system is the dis-
tinction between conversion devices and passive systems.
Conversion devices transform or upgrade energy into more
useful forms and include examples such as fuel refineries, electricity
generators, combustion engines, electric motors, and lightbulbs.
An efficient device converts energy from one form to another
quickly and with minimal loss. Conversion devices are normally
linked together in chains, with the final conversion being to
`useful energy’, mainly in the form of heat, motion, and light.
Useful energy is delivered to passive systems, the last technical
component in each energy chain, where it is eventually “lost” or
dissipated as low-grade heat to the environment in exchange for
the provision of final energy services. Unlike conversion devices,
passive systems do not actively or intentionally convert energy to
another form but instead “hold” or “trap” the useful energy for a
time, to provide a level of final service - hence the term passive.
Thus the building envelope traps heat (or coolth) to deliver a
service of thermal comfort, the car body holds kinetic energy to
provide a transport service, and the room traps light (albeit
briefly) to provide illumination.
Useful energy is eventually dissipated from the system, mostly
as low-grade heat to the environment. A passive system that has
lost energy must be topped up with more energy, in order to
maintain a constant level of service. An efficient passive system is
one that limits the loss of useful energy and therefore traps the
energy for a longer period. For example, a well-insulated and
sealed house traps heat for longer, an aerodynamic car body
maintains kinetic energy, and a white painted room increases
surface reflectance to prolong light.
Thus, a passive system can be thought of as a reservoir or tank
of stored energy - kinetic energy for the car, thermal energy for
the house, and light for the room. The level in the tank equates to
the final service level, and any output of energy from the tank
must be balanced by an equal input of energy to maintain
a constant service level. Fluctuations in the service level waste
energy - for instance, when a car is starting and stopping fre-
quently or when a furnace is not operated continuously - as
moving from a high to low service level requires the tank to be
drained of energy. Conversely, if all outputs from the tank are
sealed, then a constant service level can be maintained without
any additional energy input. In the idealized case of a car without
friction or drag, motion would continue indefinitely, and if a
building is perfectly sealed and insulated, a constant temperature
can be maintained without the addition of heat.
The production of materials and goods in industry deserves
special attention. For industrial materials, most of the useful
1713 dx.doi.org/10.1021/es102641n |Environ. Sci. Technol. 2011, 45, 1711–1718
Environmental Science & Technology ARTICLE
energy is delivered to passive systems such as furnaces and motor
driven systems, where it is trapped as heat and motion and after
some time lost as low-grade heat. However, a portion of the
energy remains embedded in the material, resulting in a change in
chemical or physical properties. This embedded energy is still
trapped and provides a constant level of final service but, in this
case, for a very long period of time. For example, energy is required
to change iron ore into steel, with a portion of this energy be-
coming embedded in the steel, while delivering mechanical strength
over many years in a structure.
Eventually,afteraconsiderabletimeperiod,theenergyembedded
in the material will be lost, not as low-grade heat but as the material
returns back to its natural environmental state, for example, the
oxidation of steel to iron oxide. Analysis in the Supporting In-
formation (summarized in Table S.13) shows that the total
embedded energy (shown in the column Theoretical Minimum)
in the global production of steel, cement, paper, and aluminum
(11 EJ) is small compared to its total processing energy (66 EJ).
In addition, the embedded energy in these materials is more than
balanced by the release of embedded energy when making industrial
chemicals (-15 EJ), as the energy in fossil fuels is liberated during
exothermic chemical reactions. Thus, for this analysis, embedded
energy in materials is ignored in order to focus attention on the
passive systems of furnaces, driven, and steam systems, where
losses could be more easily avoided.
The importance of the distinction between devices andsystems is
todraw attentiontothedifferenttechnicaloptions each offers when
seeking future energy efficiency: Conversion device efficiencies
relatetomoreeffectiveenergytransformationsandensuringdevices
are sized for the output required of them; and passive system
efficiencies are related to the avoidance of unintended losses and
reducing mechanical and thermal inertia when the service level is
required to fluctuate. The failure to distinguish between these
two stages of global energy flow - energy conversion in devices
and servicedeliveryfrom passivesystems- leads to the misleading
concept of additive efficiencies implicit in abatement curves.
Our work in ref 21 led to a Sankey Diagram in which the
exergy value of primary energy sources (the maximum work that
can be obtained from the energy source) was allocated through
the elements of Figure 1 to deliver final energy services. In order
to understand the efficiency of this flow, in addition to alloca-
tions, we must also examine losses, and in ref 22, we calculated
the theoretical efficiencies of the energy system and attributed
losses to 10 mechanisms. The paper calculated a global conver-
sion efficiency of 11% for all devices, including fuel transforma-
tion, electricity generation, and end-use conversion, by comparing
the current energy use in devices to the theoretical minimum
energy requirement. However, this approach proved unsuitable
for passive systems because, as discussed above, a final service
level can be maintained without the input of any energy if all
unintended losses are eliminated - the theoretical minimum
energy requirement for service provision is zero, and defining a
theoretical efficiency limit is meaningless.
The work of ref 22 therefore calculated a theoretical conver-
sion efficiency value for global energy flow only as far as the useful
energy output by devices. Hence, this paper aims to extend the
analysis by providing physical-based efficiency estimates for passive
systems. By calculating the savings in energy use that can be
achieved by existing physical solutions, it will be possible to make
more informed comparisons between the investments required
to address key energy concerns across both supply- and demand-
side options.
The analysis in this paper then is intended to assess the efficiency
of passive systems, permitting a global energy flow diagram with
losses to be created, with a structure like that of Figure 1.
’ PRACTICAL LIMITS TO EFFICIENCY IN PASSIVE SYS-
TEMS
In order to estimate the practical limits to energy efficiency of
passive systems, scalar equations are identified for each passive
system to predict the useful energy required to deliver the final
energy service. These equations are dependent on design para-
meters (mass, size, and so on), and by considering the limiting
values of these design parameters, we can predict the practical
minimum energy limits required to provide each service. The
complete work of developing these models is described in the
Supporting Information and summarized in the remainder of this
section.
In aiming to estimate the practical limits to energy require-
ments in passive systems, three groups of passive systems are
examined (as identified in ref 22): Vehicles (car, truck, plane,
ship, and train), Industry (furnace, driven system, and steam
system), and Buildings (heated/cooled space, hot water system,
six types of domestic appliance, and illuminated space). For each,
a model is developed based on simple scalar relationships familiar
to all undergraduate engineers: Fourier’s law of thermal conduc-
tion, Burnet-Gerrans equation of heat capacity, Newton’s law of
cooling applied to heat exchange, extended Bernouilli equation
for mechanical pumping, Darcy Weisbach equation for pressure
loss in piping, Coulomb’s friction law, Rayleigh’s equation for
drag, and Newton’s second law of motion. Where simple equa-
tions are unable to provide sufficient insight, for instance in deter-
mining energy requirements for planes and trains, reference is
made to major studies examining future efficiency options.
A key concern in developing our estimates has been to ensure
representative system descriptions. For example, in estimating
the potential for energy saving for all cars, the analysis depends
on an estimate of current fleet composition, and this has been
based on analysis of European Commission data on vehicle use in
15 EU countries in 2000. Similarly, estimates depend on assump-
tions about the behavior of the users of passive systems. For
example, without global statistics on cooking behavior, it is
assumed that a typical domestic oven is used to cook food at
200 °C for 1 h per day. When statistics are available, they are
used, for instance, average vehicle driving cycles are used to
attribute fractions of engine power to overcoming inertia, mechan-
ical, and aerodynamic drag. The context in which passive systems
operate is also important, particularly for buildings, where heating
Figure 1. Schematic Sankey diagram for provision of energy and material
services showing losses, reproduced with permission from ref 22.
1714 dx.doi.org/10.1021/es102641n |Environ. Sci. Technol. 2011, 45, 1711–1718
Environmental Science & Technology ARTICLE
and cooling requirements are dependent on regional tempera-
ture and sunshine patterns. In this case, the required heating and
cooling loads were determined using representative daily mean
temperatures and solar irradiation cycles for two cities in each of
the four global climatic zones selected.
Armed with appropriate equations and representative data on
current use, the practically achievable energy savings are esti-
mated by examining how model parameters could feasibly be
changed. Where parameters relate to the design of the passive
system - coefficient of friction, mass, and thermal conductivity,
for example - the values are selected from examples of existing
best practice design, while aiming to avoid extremes that could
not occur in practice. So, although the world’s most efficient car
(the PAC-II) has a total unloaded mass of just 29 kg, the practical
limit is defined here as 200 kg based on scaling the design for the
Rocky Mountain Institute “2000 Revolution Hypercar”,23
an
SUV, to the size of a typical small car. Low friction tires (tubeless
Michelin 45-75R16) and minimal aerodynamic drag for the car
body (based on the PAC-II) are assumed. For trains, the design is
based on existing high-speed passenger trains, which have very
low drag. Similarly, the estimate of practical limits in house design
is based on established Passivhaus buildings standard, with annual
heating loads of less than 15 kWh/m2
. The standard specifies low U
values for the building shell (typically >300 mm of cavity wall
insulation and triple glaze windows) and tightly controlled ven-
tilation rates with heat recovery.
In addition to these design choices, some limited behavior
change is assumed to allow changes to the “set-points” of current
use without otherwise assuming any reduction in service provi-
sion. Thus, on the basis of the analysis of human adaptability for
comfort in buildings, a wider range of acceptable temperatures
within buildings is used to reduce the need for heating and cool-
ing; a lower maximum speed for trains and ships is assumed
(though not cars or planes); and domestic hot water systems are
allowed to operate at lower temperatures (50 °C rather than
65 °C), as current settings are based on the need to avoid growth
of legionella bacteria in hot water tanks, which are eliminated in
the best practice design.
Our analysis is summarized in Table 1, which shows the
current energy supply allocated to each passive system taken
directly from global analysis in ref 21 equations for each simple
model with key design parameters and their current and practi-
cally limiting values, an estimate of the fraction of current energy
use that could be saved solely by changes to the passive system.
The results suggest that we have engineering options to reduce
current energy demand by 73%. A full description of each passive
system model and all assumptions used to calculate the energy
savings are in the Supporting Information.
Figure 2 shows these results, with the width of each bar
representing the scale of primary energy supply allocated to each
passive system based on ref 21. Color is used to distinguish bet-
ween the practical minimum energy required (blue) and what
could practically be avoided (gray). The passive systems within
each sector are ranked according to achievable energy savings
(gray), and this ranking could be use to direct priorities for future
research development and policy.
’ DISCUSSION
The physical basis of our analysis in Table 1 can be translated
into specific actions that will lead to a step change reduction in
energy demand. Table 2 summarizes the practical steps required
to achieve this in the passive systems discussed in this paper.
The greatest energy savings can be achieved in the passive
systems of buildings, both absolute (179 EJ) and as a percentage
of total demand (83%). This is dominated by the savings in
heating and cooling spaces (85 EJ), which could be avoided by
designing buildings to the Passivhaus standard, and appliances
(59 EJ). Several factors currently inhibit the deployment of more
efficient technical solutions in buildings spaces: the variety of
building designs, fragmented ownership, the disconnect between
landlords and tenants, a reluctance to change the appearance of
historical buildings, anoveremphasis oninitial capital cost instead of
costing over the entire building lifetime, and the slow turnover of
building stock. The practical minimum energy required for appli-
ances is comparatively large (33%, 29 EJ) because the energy
required to heat and cool food or display information is an essential
part of the final energy service, and it is difficult to recovery ener-
gy from washing applications at low temperature.
Transport passive systems are already more efficient than
buildings (avoidable loss averages 68%) because the need to carry
fuel creates a natural driver to reduce frictional drag and vehicle
weight. This is particularly pronounced for planes, where the weight
of any additional fuel must be supported by the lift force generated
by the engine thrust and wings. For this reason, the plane is the most
optimized of the passive systems examined, with only 46% practical
energy savings available. The largest savings for transport occur in
passenger cars (91%, 37 EJ), where reducing the mass of the car and
the rolling resistance are important. Cars are also less optimized
because of the diversity of models and the need to compromise
efficiency to satisfy the fashion element of car design. Light-
weighting strategies for ships and trains are limited because the
transported goods make up a large proportion of the total vehicle
mass (typically 60% in trucks versus 5-10% in cars).
The passive systems in industry are on average the most
efficient (avoidable losses averages 62%), although the absolute
savings are higher than for transport (95 EJ versus 72 EJ). This
reflects the existence of economies of scale in industrial systems,
standardization of equipment, and the natural commercial drive
for efficiency improvement in energy intensive industries. The
fraction of available energy savings across all three industrial
systems - furnaces, driven systems, and steam systems - is
similar (59-66%). Advances in industrial systems, despite the
long operating life of equipment, give hope that similar improve-
ments to building systems are also possible.
Table 1 demonstrates a saving of 73% of global energy use by
practically achievable design changes to passive systems. How-
ever, the idea of global energy flow from source to service dis-
cussed above and summarized in Figure 2 shows that total energy
savings will be greater than this if equivalent steps are also taken
in energy conversion devices (including fuel transformation,
electricity generation, and end-use conversion). We have already
in ref 22 provided calculations of theoretical efficiency potentials
for conversion devices, so to illustrate the extent of practically
achievable global energy savings, we estimate the practical effi-
ciency limits for conversion devices by halving the theoretical
gains calculated in ref 22.
This crude estimate is derived from two sources. First, Blok
(ref 24, p 89) suggests that “it is possible to bridge about half of
the gap between the present best technologies and the thermo-
dynamic minimum; that is, it is possible to cut the avoidable
energy use in half” using known energy efficiency technologies in
industry. Industry is already the most efficient sector, so this
reduction may be a conservative estimate of possible savings in
the building and transport sectors.
1715 dx.doi.org/10.1021/es102641n |Environ. Sci. Technol. 2011, 45, 1711–1718
Environmental Science & Technology ARTICLE
Table 1. Summary Analysis of Passive System Savingsa
system E equation design parameters C P F
Building 215 83
heated/cooled
space
86 QH þ QZ þ QI ¼ QS þ QV þ QT Uroof (W/m2
K) 1.2 0.1 98
QS ¼
P
i
ðUiAiÞðTinside - ToutsideÞ Uwalls, heat transfer coeff. 1.3 0.1
Ufloor 1.2 0.1
QV ¼ qFCpðTinside - ToutsideÞð1 - RÞ Uwindows 4.0 0.8
q (l/s/per), ventilation rate 30 7
QT ¼ mbuildingCp Cs, solar heat gain coeff. 0.5 0.5
QZ ¼ AwindowCSHθ R, heat recovery fraction 0 0.8
hot water systems 23 QH ¼ CpðTout - TinÞ þ QL - QX Utank (W/m2
K) 1.1 ∼ 80
QL ¼
P
i
UiAiðTstore - TairÞ Atank (m2
) 2.2 0
UX (W/m2
K) 1200 1500
QX ¼ UXAXΔTLM AX (m2
), heat exchange ∼ 3.1
illuminated space 18 LFdevice ¼ EÂA
UFÂLLF E (Wm2
), illuminance 780 130 95
UF, utilization factor 0.3 0.9
appliances 88 see SI for 6 appliance types ∼ ∼ ∼ 67
Industry 154 62
furnace 67 QF ¼ QS þ QV þ QT wshell (mm), insulation depth 100 250 62
QS ¼
P
i
ðUiAiÞðTinside - ToutsideÞ kshell (W/mK), thermal cond. 1.0 0.5
QV ¼ qFCpðTinside - ToutsideÞð1 - RflueÞ Rflue, heat recovery fraction 0 0.8
QT ¼ mproductCpTð1 - RproductÞ Rproduct, heat recovery fraction 0 0.4
driven system 56 FWshaft ¼ FWloss þ ΔP D, pipe diameter D 1.3D 59
FWloss ¼ 8fLq2
π gD5
see SI for nonpumping applications
steam system 31 same as furnace model
but with distribution
replacing ventilation loss
QS and QT improve as
furnace, QD eliminated
∼ ∼ 66
Transport 106 70
car 40 W ¼
R
Fνdt m (ton), loaded mass 1.3 0.3 91
ν (m/s), average velocity 19 19
F ¼ μmg þ 1
2Fv2
CDAf þ m μ, tire friction 0.015 0.001
CD, drag coefficient 0.41 0.10
A (m2
), frontal area 2.0 1.5
truck 38 W ¼
R
Fνdt m (ton), loaded mass 14 13 54
F ¼ μmg þ 1
2Fv2
CDAf þ m ν (m/s), average speed 18 18
μ, tire friction 0.012 0.005
CD, drag coeff. 0.95 0.31
A (m2
), frontal area 7 7
plane 10 SFB ¼ W1 - W2
WPR ¼ c2
X
1 - Re- Z
ZðR e- Z
- c1Þ ηp (%), propulsive efficiency 81 95 46
c1, structural constant 0.32 0.38
c2, structural constant 2.0 1.9
Z ¼ R=X ¼ InðW1=W2Þ A, wing aspect ratio 10 5
k, vortex drag factor 1.2 1.1
1716 dx.doi.org/10.1021/es102641n |Environ. Sci. Technol. 2011, 45, 1711–1718
Environmental Science & Technology ARTICLE
Second, a large proportion of the thermodynamic losses from
conversion devices result from heat exchange across a finite tem-
perature difference. The theoretical efficiency limit for these
“heat engines” is defined using the ideal Carnot cycle: η = 1 -
T2/T1, where T2 and T1 are the temperatures in Kelvin of the
cold and hot reservoirs. However, Curzon and Ahlborn25
explain
that to achieve this ideal efficiency requires the infinitely slow
transfer of heat between the working substance and reservoirs,
resulting in an actual power output of zero. Instead, if the rate of
heat exchange is taken into account, a maximum power output
can be calculated using: η = 1 - (T2/T1)1/2
. In typical heat
exchange applications this reduces the avoidable losses by
approximately half and serves as a realistic practical minimum
efficiency.
Applying this logic, a halving of the avoidable losses and using the
calculated theoretical efficiency of 11% from ref 22 implies a
practical efficiency limit for conversion devices of 56% (89%/2 þ
11%). Multiplying the practical efficiency limit for devices (56%) by
that for passive systems (27%) provides an overall estimate of global
efficiency of 15%; that is 85% of energy demand could be practically
avoidedusingcurrentknowledgeandavailabletechnologies.Amore
detailed prediction of the practical energy savings in conversion
devices requires another extended analysis of the type we have
described in this paper, and we plan this as future work.
Table 1. Continued
system E equation design parameters C P F
X ¼ Hηeηp
ffiffiffiffiffiffiffiffiffi
πA
4kCDO
q
CDO, profile drag coeff. 0.021 0.003
L/D, lift/drag ration 18 37
R (km), range 5000 9000
ship 10 summary from survey of empirical testing of scale models ∼ ∼ ∼ 63
train 8 W ¼
R
Fνdt m (ton), loaded mass 300 400 57
ν (m/s), average velocity 42 42
F ¼ A þ Bv þ Cv2
A , (N), drag coeff. 3300 2300
A % μmg, B ¼ Bðm, lÞ B (Ns/m), drag coeff. 28 58
c ¼ 1
2FAf ðCD þ λl=dÞ C (Ns2
/m2
), drag coeff. 11 8
Total 475 73
a
Notes. E: global energy supply allocated to this system (EJ). C: current setting for design parameters. P: practical limit to design
parameter settings. F: fraction of current energy use that could be saved (%). Parameter settings have been rounded in some cases.
Building parameters: For materials in the building fabric and the heating fluid (air or water): mass, m; density, F; specific heat capacity,
Cp; temperature, T; and overall heat transfer coefficient, U. Heat transferred into building by heater, QH; solar, QZ; internal heating, for
instance by occupants bodies, QI; heat transferred out of building through shell, QS; by ventilation, QV; or by transfer into thermal mass,
QT. Other building parameters: Ai, surface area of type, i; and Hq, geographically specific solar irradiation. Water heating requirements:
QH, depends on mass flow rate, set point Tout; losses QL, from storage tank and pipes (reduced to zero for a tankless point-of-use system),
and QX, if a waste water heat recovery system is used; lighting device supplying luminous flux, LFdevice, required to provide average
illuminance, E, over area, A, with utilization factor, UF; and light loss factor, LLF (assumed constant). Six appliances are discussed in the
Supporting Information, SI so only the total savings are reported. Industry parameters: Heat provided to the furnace, QF, is balanced by
heat loss from the shell, QS; leakage through door, vent, and flue openings, QV; and thermal losses from heating the shell (intermittent
use) and the product, QT. For the practical limit, the furnace is continuously operated with no loss from air leakage, reduced shell thermal
conductivity, k; thickness, w; and heat recover, R, from the flue gases and product. All driven systems are related to pumping;either for
transport or pressure increase, DP, with losses related to the dimensional Darcy friction factor, f; the effective pipe length, L; pipe
diameter, D; and q, the volumetric flow per unit area. The pipe diameter, D, is increased to find the practical limit. See the Supporting
Information (SI) for solid materials, compressed air, and refrigeration. For steam generation, the furnace model is modified with
distribution losses, QD, replacing ventilation losses, QV. For the practical limit, increased insulation reduces boiler losses and heat is
recovered from the condensed steam, while distribution losses are eliminated with point-of-use systems. Transport parameters: Cars
and trucks use the work provided by the engine to overcome mechanical drag (rolling), aerodynamic drag, and inertia (the resistance of
mass). The practical limit is determined by reducing the loaded mass, m; tire friction, μ; drag coefficient for air, CD; and the frontal area,
A. Inertia is assumed to be recovered by coasting (without braking) or regenerative brake systems. For planes, the specific fuel burn (SFB)
of an airplane in kg/t km is calculated from the fuel consumed in flight (initial weight, W1, less final weight, W2) over the payload, WP,
multiplied by the range, R, via the key performance factor X; two structural constants, c1 and c2; the fuel heating value, H; the propulsive,
ηp, and thermal, ηe, efficiency of the engine (the latter of which is in our language a device, so invariant within the passive system); the
wing aspect ratio, A; vortex drag factor, k; factor for non-crusing fuel, R; and profile drag coefficient; CDO. The practical limit for the plane
is derived for a laminar flying wing aircraft with unducted fan propellers, and both current and limit designs are compared for their
optimum ranges. The model of drag forces for ships is nonlinear and difficult to solve, so instead a survey of experimentally tested hull
designs is used to estimate practical savings. For trains, the drag forces comprise three terms of which A is related to mechanical drag,
B relates to both drag and air intake acceleration, and C is the aerodynamic drag. Full details of each passive system model, including
equations, design parameters, current and limiting values, energy savings, and assumptions, are given in the Supporting Information.
1717 dx.doi.org/10.1021/es102641n |Environ. Sci. Technol. 2011, 45, 1711–1718
Environmental Science & Technology ARTICLE
The estimates made in this paper are subject to uncertainty,
but by providing a practical basis for recommended change, we
hope that the numbers are at least a pragmatic guideline to
what could be achieved. Our calculation of potential energy
savings is technically achievable, and yet significant economic
and socio-cultural barriers are still present that limit the
realizable improvement. Human choices are rarely driven by
a sole desire to use energy efficiently, but instead include
complex drivers such as social status (e.g., desire for larger cars
and houses), security (e.g., stockpiling of armaments), and
fashion (e.g., throwing away perfectly functional products
because they appear outdated). We have not considered the
social and economic implications of these changes, but the fact
that they are based on existing designs gives a basis for future
work in evaluating costs and predicting the effects of these
changes on demand patterns.
The analysis in this paper ought to be a reminder to policy
makers and thought leaders on energy futures worldwide: res-
ponses to the threat of climate change and to concern over energy
security have to date mainly focused on developing new energy
sources or decarbonising existing energy supply; those that ad-
dress demand-side energy typically fail to isolate the potential
reductions from passive systems. This analysis predicts that we
could currently live with 73% less energy supply by applying
known engineering best practice to passive systems that transform
useful energy to services. An initial assessment of the practical effi-
ciency limits in conversion devices provides an overall global and
practical estimate for the reduction potential in demand-side op-
tions, of 85%. National and international energy policy and the
scenario analysis that support its development appears to pay
insufficient attention to demand reduction, presumably in the
fear that it implies service reduction. We hope that by describing
a physical basis for reducing global energy demand to one-quar-
ter of current levels by modifying passive systems (one-sixth if
conversion devices are also included), without reduction in service
Table 2. Practical Actions Required To Save 73% of the
Energy Used by Passive Systems
system practical actions to reduce energy demand
Building
heated/
cooled
space
>300 mm wall and roof cavity insulation with minimum thermal
bridging and triple glazed windows, controlled ventilation with
heat exchange and no leaks, maximum use of solar gains in cold
climates, controlled solar gains and in hotter areas, and high
thermal mass and passive ventilation to average out external
temperature variations and avoid cooling
hot water
systems
eliminate hot water tanks, reduce set point to 50 °C, and apply
drain-water heat recovery
illuminated
space
avoid excess illuminance, use task lighting to focus light as
needed, and improved luminaire design
appliances stove-top cooking in pans: use lid, halve thermal mass of pan, and
add 30 mm thick fiberglass insulation to pot
oven: seal oven throughout cooking time, 100 mm thick fiber-
glass insulation, and avoid steel casing to reduce thermal mass
fridge-freezer: defrost frozen food in fridge, mount compressor
at top of fridge, 200 mm thick insulation, and improved com-
partmentalization to reduce ventilation
washing machines, dishwashers, and dryers: reduce temperature
set-point, recover heat from wastewater, use less water, hori-
zontal axis in washing machines, and heat recovery from dryers
Industry
furnace increaseinsulationthicknessby150mm,reducethermalconductivity
to lowest value for known refractory bricks, improved heat recovery
from exhaust flue, and recover heat from discharged heated products
driven
system
increase pipe diameter by 25%, reduce corners in pumped systems,
and similar increases for conveyor and other handling systems
steam
system
avoid distribution by point of use generation, increase insula-
tion, and reduced thermal conductivity
Transport
car reduce loaded car mass to 300 kg, reduce tire rolling resistance to
0.001 (Michelin 45-75R16), and reduce drag coefficient CD to 0.1
and frontal area from 2 m2
to 1.5 m2
truck reduce tire rolling resistance to 0.005 and drag coefficient to 0.31
plane laminar fixed wing aircraft with unducted fan engine design
ship improve propeller and hull design, and reduce fleet speed by 10%
train adopt Swedish X2 high-speed passenger train design, but limit to
current average speed of 100km/h for freight and 150 km/h for
passengers
Figure 2. Practically available energy savings from global passive
systems.
1718 dx.doi.org/10.1021/es102641n |Environ. Sci. Technol. 2011, 45, 1711–1718
Environmental Science & Technology ARTICLE
provision, we can contribute to rebalancing this skewed empha-
sis. True sustainability depends on living within an ecologically
acceptable budget, and the key to achieving that is to require
fewer input resources.
’ ASSOCIATED CONTENT
bS Supporting Information. A detailed explanation of the
calculations and assumptions used to predict the practical energy
savings available in passive energy systems. Suppporting Information
is available free of charge via the Internet at http://pubs.acs.org/
’ AUTHOR INFORMATION
Corresponding Author
*Phone: þ44 1223 338181; fax: þ44 1223 332662; E-mail:
jma42@cam.ac.uk.
’ ACKNOWLEDGMENT
The first two authors are supported by a Leadership Fellow-
ship provided by the U.K. Engineering and Physical Sciences
Research Council (EPSRC) Reference EP/G007217/1.
’ REFERENCES
(1) Kaya, Y. Impact of Carbon Dioxide Emission Control on GNP
Growth: Interpretation of Proposed Scenarios; Response Strategies Work-
ing Group, Energy and Industry Subgroup of the Intergovernmental
Panel on Climate Change: Paris, 1990.
(2) Yamaji, K., Matsuhashi, R., Nagata, Y. Kaya, Y. An Integrated
System for CO2/Energy/GNP Analysis: Case Studies on Economic
Measures for CO2 Reduction in Japan. In Workshop on CO2 Reduction
and Removal: Measures for the Next Century, International Institute for
Applied Systems Analysis, Laxenburg, Austria, March 19-21, 1991.
(3) Energy Technology Perspectives 2008; International Energy Agency:
Paris, 2008.
(4) MacKay, D. J. Sustainable Energy: Without the Hot Air; UIT
Cambridge: Cambridge, U.K., 2009.
(5) Summers, C. M. The conversion of energy. Sci. Am. 1971, 225,
148–160.
(6) Sims, R.; Schock, R.; Adegbululgbe, A.; Fenhann, J.; Konstantina-
viciute, I.; Moomaw, W.; Nimir, H.; Schlamadinger, B.; Torres-Martinez,
J.; Turner, C.; Uchiyama, Y.; Vuori, S.; Wamukonya, N.; Zhang, X.
Energy Supply. In Climate Change 2007: Mitigation. Contribution
of Working Group III to the Fourth Assessment Report of the Inter-
governmental Panel on Climate Change; Metz, B., Davidson, O. R.,
Bosch, P. R., Dave, R., Meyer, L. A., Eds.; Cambridge University
Press: Cambridge, U.K., 2007.
(7) Baumert, K. A., Herzog, T. Pershing, J. Navigating the Numbers:
Greenhouse Gas Data and International Climate Policy; World Resources
Institute: Washington, DC, 2005.
(8) Schmidt, M. The Sankey diagram in energy and material flow
management. J. Ind. Ecol. 2008, 12 (1), 82–94.
(9) ITP Best Practices. Industrial Technologies Program, U.S. De-
partment of Energy. http://www1.eere.energy.gov/industry/bestprac-
tices/.
(10) Action Plan for Energy Efficiency. European Union. http://
europa.eu/legislation_summaries/energy/energy_efficiency/.
(11) The Carbon Emission Generated in All That We Consume;
Carbon Trust: Whitney, U.K., 2006.
(12) Pacala, S.; Socolow, R. Stabilization wedges: Solving the climate
problem for the next 50 years with current technologies. Science 2004,
305, 968–972.
(13) Raupach, M. R.; Marland, G.; Ciais, P.; Le Quere, C.; Canadell,
J. G.; Klepper, G.; Field, C. B. Global and regional drivers of accelerating
CO2 emissions. Proc. Natl. Acad. Sci. U.S.A. 2007, 104, 10288–10293.
(14) Action Plan for Energy Efficiency: Realising the Potential; Com-
mission of the European Communities: Brussels, 2006.
(15) Energy Technologies at the Cutting Edge; International Energy
Agency: Paris, 2005.
(16) EnergyEfficiency InnovationReview; HM Treasury: London, 2005.
(17) Nelson B. Vattenfall’s Global Climate Impact Abatement Map,
2007. Vattenfall. http://www.iea.org/work/2007/priority/Nelson.pdf.
(18) Bressand, F.; Farrell, D.; Hass, P.; Morin, F.; Nyquist,
S.; Remes, J.; Roemer, S.; Rogers, M.; Rosenfeld, J.; Woetzel, J. Curbing
Global Energy Demand Growth: The Energy Productivity Opportunity;
McKinsey Global Institute, 2007. http://www.mckinsey.com/mgi/pub-
lications/.
(19) Ertesvag, I. Society exergy analysis: A comparison of different
societies. Energy 2001, 26, 253–270.
(20) Nakicenovic, N.; Gilli, P. V.; Kurz, R. Regional and global
exergy and energy efficiencies. Energy 1996, 21, 223–237.
(21) Cullen, J. M.; Allwood, J. M. The efficient use of energy:
Tracing the global flow of energy from fuel to service. Energy Policy
2010, 38 (1), 75–81.
(22) Cullen, J. M.; Allwood, J. M. Theoretical efficiency limits for
energy conversion devices. Energy 2010, 35 (5), 2059–2069.
(23) Lovins, A. B.; Cramer, D. R. HypercarsÒ, hydrogen, and the
automotive transition. Int. J. Veh. Des. 2004, 35, 50–85.
(24) Blok, K. (2005). Improving energy efficiency by five percent
and more per year? J. Ind. Ecol. 2005, 8 (4), 87-99.
(25) Curzon, F. L.; Ahlborn, B. Efficiency of a Carnot engine at
maximum power output. Am. J. Phys. 1975, 43, 22–24.

Weitere ähnliche Inhalte

Was ist angesagt?

Energy Sources and EIS
Energy Sources and EISEnergy Sources and EIS
Energy Sources and EISAndreza Dantas
 
A Review on Revolution of Wind Energy Conversion System and Comparisons of Va...
A Review on Revolution of Wind Energy Conversion System and Comparisons of Va...A Review on Revolution of Wind Energy Conversion System and Comparisons of Va...
A Review on Revolution of Wind Energy Conversion System and Comparisons of Va...PADMANATHAN K
 
Putting hydropower and renewables in context
Putting hydropower and renewables in contextPutting hydropower and renewables in context
Putting hydropower and renewables in contextCPWF Mekong
 
A More Perfect Energy Union: Challenges and Opportunities for Renewable Energ...
A More Perfect Energy Union: Challenges and Opportunities for Renewable Energ...A More Perfect Energy Union: Challenges and Opportunities for Renewable Energ...
A More Perfect Energy Union: Challenges and Opportunities for Renewable Energ...Kevin Rushton
 
Optimizing Size of Variable Renewable Energy Sources by Incorporating Energy ...
Optimizing Size of Variable Renewable Energy Sources by Incorporating Energy ...Optimizing Size of Variable Renewable Energy Sources by Incorporating Energy ...
Optimizing Size of Variable Renewable Energy Sources by Incorporating Energy ...Kashif Mehmood
 
Unit 9 energy consumption
Unit 9 energy consumptionUnit 9 energy consumption
Unit 9 energy consumptionben wesley
 
Value of CSP with TES november 2014
Value of CSP with TES november 2014Value of CSP with TES november 2014
Value of CSP with TES november 2014Daniel Schwab
 
Prof Geoff Hammond - Low Carbon Business Breakfast - Innovation Centre, Bath ...
Prof Geoff Hammond - Low Carbon Business Breakfast - Innovation Centre, Bath ...Prof Geoff Hammond - Low Carbon Business Breakfast - Innovation Centre, Bath ...
Prof Geoff Hammond - Low Carbon Business Breakfast - Innovation Centre, Bath ...The Future Economy Network
 
Model for Evaluating CO2 Emissions and the Projection of the Transport Sector
Model for Evaluating CO2 Emissions and the Projection of the Transport Sector Model for Evaluating CO2 Emissions and the Projection of the Transport Sector
Model for Evaluating CO2 Emissions and the Projection of the Transport Sector IJECEIAES
 
Strategic Paths to the Future Energy System
Strategic Paths to the Future Energy SystemStrategic Paths to the Future Energy System
Strategic Paths to the Future Energy Systemswissnex San Francisco
 
C L I Mclimatesolutions W W Fmay2k7
C L I Mclimatesolutions W W Fmay2k7C L I Mclimatesolutions W W Fmay2k7
C L I Mclimatesolutions W W Fmay2k7Psdmn Phil
 
Philadelphia Energy
Philadelphia EnergyPhiladelphia Energy
Philadelphia Energycrockettc
 
Utilization of Existing Generation Fleet Using Large Scale Energy Storage Sys...
Utilization of Existing Generation Fleet Using Large Scale Energy Storage Sys...Utilization of Existing Generation Fleet Using Large Scale Energy Storage Sys...
Utilization of Existing Generation Fleet Using Large Scale Energy Storage Sys...Tu Nguyen
 
IRJET- A Review on Hybrid Wind and Fuel Cell System
IRJET-   	  A Review on Hybrid Wind and Fuel Cell SystemIRJET-   	  A Review on Hybrid Wind and Fuel Cell System
IRJET- A Review on Hybrid Wind and Fuel Cell SystemIRJET Journal
 
Pathways to Decarbonization & Digital Innovation in Energy: Making Better Dec...
Pathways to Decarbonization & Digital Innovation in Energy: Making Better Dec...Pathways to Decarbonization & Digital Innovation in Energy: Making Better Dec...
Pathways to Decarbonization & Digital Innovation in Energy: Making Better Dec...World Bank Infrastructure
 
Growing Consumption of Natural Gas to Fuel California’s Green Economy
Growing Consumption of Natural Gas to Fuel California’s Green EconomyGrowing Consumption of Natural Gas to Fuel California’s Green Economy
Growing Consumption of Natural Gas to Fuel California’s Green EconomyZakia Chan
 
Market Evaluation of Energy Storage Systems Incorporating Technology-Specific...
Market Evaluation of Energy Storage Systems Incorporating Technology-Specific...Market Evaluation of Energy Storage Systems Incorporating Technology-Specific...
Market Evaluation of Energy Storage Systems Incorporating Technology-Specific...Tu Nguyen
 
1 s2.0-s2095756420300647-main (1)
1 s2.0-s2095756420300647-main (1)1 s2.0-s2095756420300647-main (1)
1 s2.0-s2095756420300647-main (1)ssuser09a0b21
 
Reviewing the factors of the Renewable Energy systems for Improving the Energ...
Reviewing the factors of the Renewable Energy systems for Improving the Energ...Reviewing the factors of the Renewable Energy systems for Improving the Energ...
Reviewing the factors of the Renewable Energy systems for Improving the Energ...IJERA Editor
 

Was ist angesagt? (20)

Energy Sources and EIS
Energy Sources and EISEnergy Sources and EIS
Energy Sources and EIS
 
A Review on Revolution of Wind Energy Conversion System and Comparisons of Va...
A Review on Revolution of Wind Energy Conversion System and Comparisons of Va...A Review on Revolution of Wind Energy Conversion System and Comparisons of Va...
A Review on Revolution of Wind Energy Conversion System and Comparisons of Va...
 
Putting hydropower and renewables in context
Putting hydropower and renewables in contextPutting hydropower and renewables in context
Putting hydropower and renewables in context
 
A More Perfect Energy Union: Challenges and Opportunities for Renewable Energ...
A More Perfect Energy Union: Challenges and Opportunities for Renewable Energ...A More Perfect Energy Union: Challenges and Opportunities for Renewable Energ...
A More Perfect Energy Union: Challenges and Opportunities for Renewable Energ...
 
Optimizing Size of Variable Renewable Energy Sources by Incorporating Energy ...
Optimizing Size of Variable Renewable Energy Sources by Incorporating Energy ...Optimizing Size of Variable Renewable Energy Sources by Incorporating Energy ...
Optimizing Size of Variable Renewable Energy Sources by Incorporating Energy ...
 
Unit 9 energy consumption
Unit 9 energy consumptionUnit 9 energy consumption
Unit 9 energy consumption
 
Value of CSP with TES november 2014
Value of CSP with TES november 2014Value of CSP with TES november 2014
Value of CSP with TES november 2014
 
Prof Geoff Hammond - Low Carbon Business Breakfast - Innovation Centre, Bath ...
Prof Geoff Hammond - Low Carbon Business Breakfast - Innovation Centre, Bath ...Prof Geoff Hammond - Low Carbon Business Breakfast - Innovation Centre, Bath ...
Prof Geoff Hammond - Low Carbon Business Breakfast - Innovation Centre, Bath ...
 
Model for Evaluating CO2 Emissions and the Projection of the Transport Sector
Model for Evaluating CO2 Emissions and the Projection of the Transport Sector Model for Evaluating CO2 Emissions and the Projection of the Transport Sector
Model for Evaluating CO2 Emissions and the Projection of the Transport Sector
 
Strategic Paths to the Future Energy System
Strategic Paths to the Future Energy SystemStrategic Paths to the Future Energy System
Strategic Paths to the Future Energy System
 
C L I Mclimatesolutions W W Fmay2k7
C L I Mclimatesolutions W W Fmay2k7C L I Mclimatesolutions W W Fmay2k7
C L I Mclimatesolutions W W Fmay2k7
 
Philadelphia Energy
Philadelphia EnergyPhiladelphia Energy
Philadelphia Energy
 
OCR energy and_sustainability
OCR energy and_sustainabilityOCR energy and_sustainability
OCR energy and_sustainability
 
Utilization of Existing Generation Fleet Using Large Scale Energy Storage Sys...
Utilization of Existing Generation Fleet Using Large Scale Energy Storage Sys...Utilization of Existing Generation Fleet Using Large Scale Energy Storage Sys...
Utilization of Existing Generation Fleet Using Large Scale Energy Storage Sys...
 
IRJET- A Review on Hybrid Wind and Fuel Cell System
IRJET-   	  A Review on Hybrid Wind and Fuel Cell SystemIRJET-   	  A Review on Hybrid Wind and Fuel Cell System
IRJET- A Review on Hybrid Wind and Fuel Cell System
 
Pathways to Decarbonization & Digital Innovation in Energy: Making Better Dec...
Pathways to Decarbonization & Digital Innovation in Energy: Making Better Dec...Pathways to Decarbonization & Digital Innovation in Energy: Making Better Dec...
Pathways to Decarbonization & Digital Innovation in Energy: Making Better Dec...
 
Growing Consumption of Natural Gas to Fuel California’s Green Economy
Growing Consumption of Natural Gas to Fuel California’s Green EconomyGrowing Consumption of Natural Gas to Fuel California’s Green Economy
Growing Consumption of Natural Gas to Fuel California’s Green Economy
 
Market Evaluation of Energy Storage Systems Incorporating Technology-Specific...
Market Evaluation of Energy Storage Systems Incorporating Technology-Specific...Market Evaluation of Energy Storage Systems Incorporating Technology-Specific...
Market Evaluation of Energy Storage Systems Incorporating Technology-Specific...
 
1 s2.0-s2095756420300647-main (1)
1 s2.0-s2095756420300647-main (1)1 s2.0-s2095756420300647-main (1)
1 s2.0-s2095756420300647-main (1)
 
Reviewing the factors of the Renewable Energy systems for Improving the Energ...
Reviewing the factors of the Renewable Energy systems for Improving the Energ...Reviewing the factors of the Renewable Energy systems for Improving the Energ...
Reviewing the factors of the Renewable Energy systems for Improving the Energ...
 

Ähnlich wie Cullen reducing energy demand EST 2011

TOO4TO Module 4 / Sustainable Energy Solutions: Part 2
TOO4TO Module 4 / Sustainable Energy Solutions: Part 2TOO4TO Module 4 / Sustainable Energy Solutions: Part 2
TOO4TO Module 4 / Sustainable Energy Solutions: Part 2TOO4TO
 
Senza sufficienza la efficienza non basta Morosini 2017
Senza sufficienza la efficienza non basta Morosini 2017Senza sufficienza la efficienza non basta Morosini 2017
Senza sufficienza la efficienza non basta Morosini 2017morosini1952
 
10.1.1.120.7375
10.1.1.120.737510.1.1.120.7375
10.1.1.120.7375sayed30
 
Decarbonizing the Grid: Pathways to Sustainable Energy Storage
Decarbonizing the Grid: Pathways to Sustainable Energy StorageDecarbonizing the Grid: Pathways to Sustainable Energy Storage
Decarbonizing the Grid: Pathways to Sustainable Energy StorageChristo Ananth
 
1876-6102 © 2016 The Authors. Published by Elsevier Ltd. This .docx
1876-6102 © 2016 The Authors. Published by Elsevier Ltd. This .docx1876-6102 © 2016 The Authors. Published by Elsevier Ltd. This .docx
1876-6102 © 2016 The Authors. Published by Elsevier Ltd. This .docxaulasnilda
 
Tesla Master Plan Part 3
Tesla Master Plan Part 3Tesla Master Plan Part 3
Tesla Master Plan Part 3AdriaanKamp
 
Projected Costs of Generating Electricity 2015 Edition
Projected Costs of Generating Electricity 2015 EditionProjected Costs of Generating Electricity 2015 Edition
Projected Costs of Generating Electricity 2015 EditionSLoW Projects
 
Building Energy Efficiency Into Energy Equation
Building Energy Efficiency Into Energy EquationBuilding Energy Efficiency Into Energy Equation
Building Energy Efficiency Into Energy EquationIJERDJOURNAL
 
HOW THE GOVERNMENT OF BRAZIL CAN MAKE THE ENERGY SECTOR SUSTAINABLE.pdf
HOW THE GOVERNMENT OF BRAZIL CAN MAKE THE ENERGY SECTOR SUSTAINABLE.pdfHOW THE GOVERNMENT OF BRAZIL CAN MAKE THE ENERGY SECTOR SUSTAINABLE.pdf
HOW THE GOVERNMENT OF BRAZIL CAN MAKE THE ENERGY SECTOR SUSTAINABLE.pdfFaga1939
 
100% Renewables Study has limited Relevance for Carbon Policy
100% Renewables Study has limited Relevance for Carbon Policy100% Renewables Study has limited Relevance for Carbon Policy
100% Renewables Study has limited Relevance for Carbon Policybobprocter
 
Economic analysis and optimization of a renewable energy based.pdf
Economic analysis and optimization of a renewable energy based.pdfEconomic analysis and optimization of a renewable energy based.pdf
Economic analysis and optimization of a renewable energy based.pdfHeangsokleap1
 
Mapping the evolution of renewable resources and their relation with EROI and...
Mapping the evolution of renewable resources and their relation with EROI and...Mapping the evolution of renewable resources and their relation with EROI and...
Mapping the evolution of renewable resources and their relation with EROI and...Paula Díaz
 
Spreng, D. (2005). Distribution of energy consumption and the 2000 W/capita t...
Spreng, D. (2005). Distribution of energy consumption and the 2000 W/capita t...Spreng, D. (2005). Distribution of energy consumption and the 2000 W/capita t...
Spreng, D. (2005). Distribution of energy consumption and the 2000 W/capita t...morosini1952
 
Integrating Renewable Energy into the Electricity Grid
Integrating Renewable Energy into the Electricity GridIntegrating Renewable Energy into the Electricity Grid
Integrating Renewable Energy into the Electricity GridPower System Operation
 
Global electricity network – Feasibility study
Global electricity network – Feasibility studyGlobal electricity network – Feasibility study
Global electricity network – Feasibility studyPower System Operation
 
Global Power Grid Interconnection for Sustainable Growth: Concept, Project an...
Global Power Grid Interconnection for Sustainable Growth: Concept, Project an...Global Power Grid Interconnection for Sustainable Growth: Concept, Project an...
Global Power Grid Interconnection for Sustainable Growth: Concept, Project an...Power System Operation
 
Unit 9: Comparing the Costs of Renewable and Conventional Energy Sources
Unit 9: Comparing the Costs of Renewable and Conventional Energy SourcesUnit 9: Comparing the Costs of Renewable and Conventional Energy Sources
Unit 9: Comparing the Costs of Renewable and Conventional Energy SourcesBig History Project
 

Ähnlich wie Cullen reducing energy demand EST 2011 (20)

TOO4TO Module 4 / Sustainable Energy Solutions: Part 2
TOO4TO Module 4 / Sustainable Energy Solutions: Part 2TOO4TO Module 4 / Sustainable Energy Solutions: Part 2
TOO4TO Module 4 / Sustainable Energy Solutions: Part 2
 
Senza sufficienza la efficienza non basta Morosini 2017
Senza sufficienza la efficienza non basta Morosini 2017Senza sufficienza la efficienza non basta Morosini 2017
Senza sufficienza la efficienza non basta Morosini 2017
 
10.1.1.120.7375
10.1.1.120.737510.1.1.120.7375
10.1.1.120.7375
 
Decarbonizing the Grid: Pathways to Sustainable Energy Storage
Decarbonizing the Grid: Pathways to Sustainable Energy StorageDecarbonizing the Grid: Pathways to Sustainable Energy Storage
Decarbonizing the Grid: Pathways to Sustainable Energy Storage
 
1876-6102 © 2016 The Authors. Published by Elsevier Ltd. This .docx
1876-6102 © 2016 The Authors. Published by Elsevier Ltd. This .docx1876-6102 © 2016 The Authors. Published by Elsevier Ltd. This .docx
1876-6102 © 2016 The Authors. Published by Elsevier Ltd. This .docx
 
Tesla Master Plan Part-3
Tesla Master Plan Part-3 Tesla Master Plan Part-3
Tesla Master Plan Part-3
 
Tesla Master Plan Part 3
Tesla Master Plan Part 3Tesla Master Plan Part 3
Tesla Master Plan Part 3
 
Tesla Master Plan Part 3
Tesla Master Plan Part 3Tesla Master Plan Part 3
Tesla Master Plan Part 3
 
Projected Costs of Generating Electricity 2015 Edition
Projected Costs of Generating Electricity 2015 EditionProjected Costs of Generating Electricity 2015 Edition
Projected Costs of Generating Electricity 2015 Edition
 
Building Energy Efficiency Into Energy Equation
Building Energy Efficiency Into Energy EquationBuilding Energy Efficiency Into Energy Equation
Building Energy Efficiency Into Energy Equation
 
Sklar - Solar Vision Forum
Sklar - Solar Vision ForumSklar - Solar Vision Forum
Sklar - Solar Vision Forum
 
HOW THE GOVERNMENT OF BRAZIL CAN MAKE THE ENERGY SECTOR SUSTAINABLE.pdf
HOW THE GOVERNMENT OF BRAZIL CAN MAKE THE ENERGY SECTOR SUSTAINABLE.pdfHOW THE GOVERNMENT OF BRAZIL CAN MAKE THE ENERGY SECTOR SUSTAINABLE.pdf
HOW THE GOVERNMENT OF BRAZIL CAN MAKE THE ENERGY SECTOR SUSTAINABLE.pdf
 
100% Renewables Study has limited Relevance for Carbon Policy
100% Renewables Study has limited Relevance for Carbon Policy100% Renewables Study has limited Relevance for Carbon Policy
100% Renewables Study has limited Relevance for Carbon Policy
 
Economic analysis and optimization of a renewable energy based.pdf
Economic analysis and optimization of a renewable energy based.pdfEconomic analysis and optimization of a renewable energy based.pdf
Economic analysis and optimization of a renewable energy based.pdf
 
Mapping the evolution of renewable resources and their relation with EROI and...
Mapping the evolution of renewable resources and their relation with EROI and...Mapping the evolution of renewable resources and their relation with EROI and...
Mapping the evolution of renewable resources and their relation with EROI and...
 
Spreng, D. (2005). Distribution of energy consumption and the 2000 W/capita t...
Spreng, D. (2005). Distribution of energy consumption and the 2000 W/capita t...Spreng, D. (2005). Distribution of energy consumption and the 2000 W/capita t...
Spreng, D. (2005). Distribution of energy consumption and the 2000 W/capita t...
 
Integrating Renewable Energy into the Electricity Grid
Integrating Renewable Energy into the Electricity GridIntegrating Renewable Energy into the Electricity Grid
Integrating Renewable Energy into the Electricity Grid
 
Global electricity network – Feasibility study
Global electricity network – Feasibility studyGlobal electricity network – Feasibility study
Global electricity network – Feasibility study
 
Global Power Grid Interconnection for Sustainable Growth: Concept, Project an...
Global Power Grid Interconnection for Sustainable Growth: Concept, Project an...Global Power Grid Interconnection for Sustainable Growth: Concept, Project an...
Global Power Grid Interconnection for Sustainable Growth: Concept, Project an...
 
Unit 9: Comparing the Costs of Renewable and Conventional Energy Sources
Unit 9: Comparing the Costs of Renewable and Conventional Energy SourcesUnit 9: Comparing the Costs of Renewable and Conventional Energy Sources
Unit 9: Comparing the Costs of Renewable and Conventional Energy Sources
 

Mehr von morosini1952

Un Partito digitale snaturati_2020_morosini
Un Partito digitale snaturati_2020_morosiniUn Partito digitale snaturati_2020_morosini
Un Partito digitale snaturati_2020_morosinimorosini1952
 
commento sei programmi elettorali m5s - snaturati 2020
commento sei programmi elettorali m5s - snaturati 2020commento sei programmi elettorali m5s - snaturati 2020
commento sei programmi elettorali m5s - snaturati 2020morosini1952
 
Snaturati ottobre 2020_prefazioni_michele serra_fioramonti_pizzarotti_indice
Snaturati ottobre 2020_prefazioni_michele serra_fioramonti_pizzarotti_indiceSnaturati ottobre 2020_prefazioni_michele serra_fioramonti_pizzarotti_indice
Snaturati ottobre 2020_prefazioni_michele serra_fioramonti_pizzarotti_indicemorosini1952
 
Futuro Terra Morosini Conferenze Lezioni Proiezioni
Futuro Terra Morosini Conferenze Lezioni ProiezioniFuturo Terra Morosini Conferenze Lezioni Proiezioni
Futuro Terra Morosini Conferenze Lezioni Proiezionimorosini1952
 
Verso sud - Proiezioni_conferenze_seminari_morosini_201007_111h26
Verso sud - Proiezioni_conferenze_seminari_morosini_201007_111h26Verso sud - Proiezioni_conferenze_seminari_morosini_201007_111h26
Verso sud - Proiezioni_conferenze_seminari_morosini_201007_111h26morosini1952
 
The Photochemistry of the Future - 1912 - New York
The Photochemistry of the Future -  1912 - New YorkThe Photochemistry of the Future -  1912 - New York
The Photochemistry of the Future - 1912 - New Yorkmorosini1952
 
Metaindex_of_Development_Morosini
Metaindex_of_Development_MorosiniMetaindex_of_Development_Morosini
Metaindex_of_Development_Morosinimorosini1952
 
IL DOMINIO MASCHILE - da: Snaturati, Marco Morosini
IL DOMINIO MASCHILE - da: Snaturati, Marco MorosiniIL DOMINIO MASCHILE - da: Snaturati, Marco Morosini
IL DOMINIO MASCHILE - da: Snaturati, Marco Morosinimorosini1952
 
Snaturati_quando_grillo_era_verde_2020
Snaturati_quando_grillo_era_verde_2020Snaturati_quando_grillo_era_verde_2020
Snaturati_quando_grillo_era_verde_2020morosini1952
 
6 programmi elettorali M5S 2009-2019
6 programmi elettorali M5S 2009-20196 programmi elettorali M5S 2009-2019
6 programmi elettorali M5S 2009-2019morosini1952
 
Late lessons from early warnings: the precautionary principle 1896–2000
Late lessons from early warnings: the precautionary principle 1896–2000 Late lessons from early warnings: the precautionary principle 1896–2000
Late lessons from early warnings: the precautionary principle 1896–2000 morosini1952
 
2018 Una società a 2000 watt: più benessere con meno energia - Milano 20.3.20...
2018 Una società a 2000 watt: più benessere con meno energia - Milano 20.3.20...2018 Una società a 2000 watt: più benessere con meno energia - Milano 20.3.20...
2018 Una società a 2000 watt: più benessere con meno energia - Milano 20.3.20...morosini1952
 
Germania sostenibile 1997_morosini_aggiornamenti_sociali
Germania sostenibile 1997_morosini_aggiornamenti_socialiGermania sostenibile 1997_morosini_aggiornamenti_sociali
Germania sostenibile 1997_morosini_aggiornamenti_socialimorosini1952
 
Morosini_utopia digitale_m5s_aggiornamenti_sociali_180901
Morosini_utopia digitale_m5s_aggiornamenti_sociali_180901Morosini_utopia digitale_m5s_aggiornamenti_sociali_180901
Morosini_utopia digitale_m5s_aggiornamenti_sociali_180901morosini1952
 
ICT GOOD OR BAD FOR DEMOCRACY? Presentazione
ICT GOOD OR BAD FOR DEMOCRACY? PresentazioneICT GOOD OR BAD FOR DEMOCRACY? Presentazione
ICT GOOD OR BAD FOR DEMOCRACY? Presentazionemorosini1952
 
ICT GOOD OR BAD FOR DEMOCRACY? - Text
ICT GOOD OR BAD FOR DEMOCRACY? - TextICT GOOD OR BAD FOR DEMOCRACY? - Text
ICT GOOD OR BAD FOR DEMOCRACY? - Textmorosini1952
 
DER SPIEGEL Digitale Partei 5-Sterne-Bewegung teuflisch geniale Erfindung
DER SPIEGEL Digitale Partei 5-Sterne-Bewegung teuflisch geniale ErfindungDER SPIEGEL Digitale Partei 5-Sterne-Bewegung teuflisch geniale Erfindung
DER SPIEGEL Digitale Partei 5-Sterne-Bewegung teuflisch geniale Erfindungmorosini1952
 
Flat-tax Lega-M5S calcolata da economista Massimo Baldini
Flat-tax Lega-M5S calcolata da economista  Massimo Baldini Flat-tax Lega-M5S calcolata da economista  Massimo Baldini
Flat-tax Lega-M5S calcolata da economista Massimo Baldini morosini1952
 
2000 Watt society in Zurich 2016 Martina Blum presentation in Sydney
2000 Watt society in Zurich 2016 Martina Blum presentation in Sydney2000 Watt society in Zurich 2016 Martina Blum presentation in Sydney
2000 Watt society in Zurich 2016 Martina Blum presentation in Sydneymorosini1952
 
Rabdomanti Grillo Marco Morosini testo 30 marzo 2014
Rabdomanti  Grillo Marco Morosini testo 30 marzo 2014Rabdomanti  Grillo Marco Morosini testo 30 marzo 2014
Rabdomanti Grillo Marco Morosini testo 30 marzo 2014morosini1952
 

Mehr von morosini1952 (20)

Un Partito digitale snaturati_2020_morosini
Un Partito digitale snaturati_2020_morosiniUn Partito digitale snaturati_2020_morosini
Un Partito digitale snaturati_2020_morosini
 
commento sei programmi elettorali m5s - snaturati 2020
commento sei programmi elettorali m5s - snaturati 2020commento sei programmi elettorali m5s - snaturati 2020
commento sei programmi elettorali m5s - snaturati 2020
 
Snaturati ottobre 2020_prefazioni_michele serra_fioramonti_pizzarotti_indice
Snaturati ottobre 2020_prefazioni_michele serra_fioramonti_pizzarotti_indiceSnaturati ottobre 2020_prefazioni_michele serra_fioramonti_pizzarotti_indice
Snaturati ottobre 2020_prefazioni_michele serra_fioramonti_pizzarotti_indice
 
Futuro Terra Morosini Conferenze Lezioni Proiezioni
Futuro Terra Morosini Conferenze Lezioni ProiezioniFuturo Terra Morosini Conferenze Lezioni Proiezioni
Futuro Terra Morosini Conferenze Lezioni Proiezioni
 
Verso sud - Proiezioni_conferenze_seminari_morosini_201007_111h26
Verso sud - Proiezioni_conferenze_seminari_morosini_201007_111h26Verso sud - Proiezioni_conferenze_seminari_morosini_201007_111h26
Verso sud - Proiezioni_conferenze_seminari_morosini_201007_111h26
 
The Photochemistry of the Future - 1912 - New York
The Photochemistry of the Future -  1912 - New YorkThe Photochemistry of the Future -  1912 - New York
The Photochemistry of the Future - 1912 - New York
 
Metaindex_of_Development_Morosini
Metaindex_of_Development_MorosiniMetaindex_of_Development_Morosini
Metaindex_of_Development_Morosini
 
IL DOMINIO MASCHILE - da: Snaturati, Marco Morosini
IL DOMINIO MASCHILE - da: Snaturati, Marco MorosiniIL DOMINIO MASCHILE - da: Snaturati, Marco Morosini
IL DOMINIO MASCHILE - da: Snaturati, Marco Morosini
 
Snaturati_quando_grillo_era_verde_2020
Snaturati_quando_grillo_era_verde_2020Snaturati_quando_grillo_era_verde_2020
Snaturati_quando_grillo_era_verde_2020
 
6 programmi elettorali M5S 2009-2019
6 programmi elettorali M5S 2009-20196 programmi elettorali M5S 2009-2019
6 programmi elettorali M5S 2009-2019
 
Late lessons from early warnings: the precautionary principle 1896–2000
Late lessons from early warnings: the precautionary principle 1896–2000 Late lessons from early warnings: the precautionary principle 1896–2000
Late lessons from early warnings: the precautionary principle 1896–2000
 
2018 Una società a 2000 watt: più benessere con meno energia - Milano 20.3.20...
2018 Una società a 2000 watt: più benessere con meno energia - Milano 20.3.20...2018 Una società a 2000 watt: più benessere con meno energia - Milano 20.3.20...
2018 Una società a 2000 watt: più benessere con meno energia - Milano 20.3.20...
 
Germania sostenibile 1997_morosini_aggiornamenti_sociali
Germania sostenibile 1997_morosini_aggiornamenti_socialiGermania sostenibile 1997_morosini_aggiornamenti_sociali
Germania sostenibile 1997_morosini_aggiornamenti_sociali
 
Morosini_utopia digitale_m5s_aggiornamenti_sociali_180901
Morosini_utopia digitale_m5s_aggiornamenti_sociali_180901Morosini_utopia digitale_m5s_aggiornamenti_sociali_180901
Morosini_utopia digitale_m5s_aggiornamenti_sociali_180901
 
ICT GOOD OR BAD FOR DEMOCRACY? Presentazione
ICT GOOD OR BAD FOR DEMOCRACY? PresentazioneICT GOOD OR BAD FOR DEMOCRACY? Presentazione
ICT GOOD OR BAD FOR DEMOCRACY? Presentazione
 
ICT GOOD OR BAD FOR DEMOCRACY? - Text
ICT GOOD OR BAD FOR DEMOCRACY? - TextICT GOOD OR BAD FOR DEMOCRACY? - Text
ICT GOOD OR BAD FOR DEMOCRACY? - Text
 
DER SPIEGEL Digitale Partei 5-Sterne-Bewegung teuflisch geniale Erfindung
DER SPIEGEL Digitale Partei 5-Sterne-Bewegung teuflisch geniale ErfindungDER SPIEGEL Digitale Partei 5-Sterne-Bewegung teuflisch geniale Erfindung
DER SPIEGEL Digitale Partei 5-Sterne-Bewegung teuflisch geniale Erfindung
 
Flat-tax Lega-M5S calcolata da economista Massimo Baldini
Flat-tax Lega-M5S calcolata da economista  Massimo Baldini Flat-tax Lega-M5S calcolata da economista  Massimo Baldini
Flat-tax Lega-M5S calcolata da economista Massimo Baldini
 
2000 Watt society in Zurich 2016 Martina Blum presentation in Sydney
2000 Watt society in Zurich 2016 Martina Blum presentation in Sydney2000 Watt society in Zurich 2016 Martina Blum presentation in Sydney
2000 Watt society in Zurich 2016 Martina Blum presentation in Sydney
 
Rabdomanti Grillo Marco Morosini testo 30 marzo 2014
Rabdomanti  Grillo Marco Morosini testo 30 marzo 2014Rabdomanti  Grillo Marco Morosini testo 30 marzo 2014
Rabdomanti Grillo Marco Morosini testo 30 marzo 2014
 

Kürzlich hochgeladen

Call Girls Ramtek Call Me 7737669865 Budget Friendly No Advance Booking
Call Girls Ramtek Call Me 7737669865 Budget Friendly No Advance BookingCall Girls Ramtek Call Me 7737669865 Budget Friendly No Advance Booking
Call Girls Ramtek Call Me 7737669865 Budget Friendly No Advance Bookingroncy bisnoi
 
Cyclone Case Study Odisha 1999 Super Cyclone in India.
Cyclone Case Study Odisha 1999 Super Cyclone in India.Cyclone Case Study Odisha 1999 Super Cyclone in India.
Cyclone Case Study Odisha 1999 Super Cyclone in India.cojitesh
 
Sector 18, Noida Call girls :8448380779 Model Escorts | 100% verified
Sector 18, Noida Call girls :8448380779 Model Escorts | 100% verifiedSector 18, Noida Call girls :8448380779 Model Escorts | 100% verified
Sector 18, Noida Call girls :8448380779 Model Escorts | 100% verifiedDelhi Call girls
 
Call Girls in Sakinaka Agency, { 9892124323 } Mumbai Vashi Call Girls Serivce...
Call Girls in Sakinaka Agency, { 9892124323 } Mumbai Vashi Call Girls Serivce...Call Girls in Sakinaka Agency, { 9892124323 } Mumbai Vashi Call Girls Serivce...
Call Girls in Sakinaka Agency, { 9892124323 } Mumbai Vashi Call Girls Serivce...Pooja Nehwal
 
Call Girls In Okhla DELHI ~9654467111~ Short 1500 Night 6000
Call Girls In Okhla DELHI ~9654467111~ Short 1500 Night 6000Call Girls In Okhla DELHI ~9654467111~ Short 1500 Night 6000
Call Girls In Okhla DELHI ~9654467111~ Short 1500 Night 6000Sapana Sha
 
Call Now ☎️🔝 9332606886 🔝 Call Girls ❤ Service In Muzaffarpur Female Escorts ...
Call Now ☎️🔝 9332606886 🔝 Call Girls ❤ Service In Muzaffarpur Female Escorts ...Call Now ☎️🔝 9332606886 🔝 Call Girls ❤ Service In Muzaffarpur Female Escorts ...
Call Now ☎️🔝 9332606886 🔝 Call Girls ❤ Service In Muzaffarpur Female Escorts ...Anamikakaur10
 
The Most Attractive Pune Call Girls Shirwal 8250192130 Will You Miss This Cha...
The Most Attractive Pune Call Girls Shirwal 8250192130 Will You Miss This Cha...The Most Attractive Pune Call Girls Shirwal 8250192130 Will You Miss This Cha...
The Most Attractive Pune Call Girls Shirwal 8250192130 Will You Miss This Cha...ranjana rawat
 
Call Girls Talegaon Dabhade Call Me 7737669865 Budget Friendly No Advance Boo...
Call Girls Talegaon Dabhade Call Me 7737669865 Budget Friendly No Advance Boo...Call Girls Talegaon Dabhade Call Me 7737669865 Budget Friendly No Advance Boo...
Call Girls Talegaon Dabhade Call Me 7737669865 Budget Friendly No Advance Boo...roncy bisnoi
 
CSR_Tested activities in the classroom -EN
CSR_Tested activities in the classroom -ENCSR_Tested activities in the classroom -EN
CSR_Tested activities in the classroom -ENGeorgeDiamandis11
 
Hot Call Girls |Delhi |Preet Vihar ☎ 9711199171 Book Your One night Stand
Hot Call Girls |Delhi |Preet Vihar ☎ 9711199171 Book Your One night StandHot Call Girls |Delhi |Preet Vihar ☎ 9711199171 Book Your One night Stand
Hot Call Girls |Delhi |Preet Vihar ☎ 9711199171 Book Your One night Standkumarajju5765
 
Call Girls Moshi Call Me 7737669865 Budget Friendly No Advance Booking
Call Girls Moshi Call Me 7737669865 Budget Friendly No Advance BookingCall Girls Moshi Call Me 7737669865 Budget Friendly No Advance Booking
Call Girls Moshi Call Me 7737669865 Budget Friendly No Advance Bookingroncy bisnoi
 
Call Girls Magarpatta Call Me 7737669865 Budget Friendly No Advance Booking
Call Girls Magarpatta Call Me 7737669865 Budget Friendly No Advance BookingCall Girls Magarpatta Call Me 7737669865 Budget Friendly No Advance Booking
Call Girls Magarpatta Call Me 7737669865 Budget Friendly No Advance Bookingroncy bisnoi
 
Presentation: Farmer-led climate adaptation - Project launch and overview by ...
Presentation: Farmer-led climate adaptation - Project launch and overview by ...Presentation: Farmer-led climate adaptation - Project launch and overview by ...
Presentation: Farmer-led climate adaptation - Project launch and overview by ...AICCRA
 
BOOK Call Girls in (Dwarka) CALL | 8377087607 Delhi Escorts Services
BOOK Call Girls in (Dwarka) CALL | 8377087607 Delhi Escorts ServicesBOOK Call Girls in (Dwarka) CALL | 8377087607 Delhi Escorts Services
BOOK Call Girls in (Dwarka) CALL | 8377087607 Delhi Escorts Servicesdollysharma2066
 
DENR EPR Law Compliance Updates April 2024
DENR EPR Law Compliance Updates April 2024DENR EPR Law Compliance Updates April 2024
DENR EPR Law Compliance Updates April 2024itadmin50
 
Get Premium Hoskote Call Girls (8005736733) 24x7 Rate 15999 with A/c Room Cas...
Get Premium Hoskote Call Girls (8005736733) 24x7 Rate 15999 with A/c Room Cas...Get Premium Hoskote Call Girls (8005736733) 24x7 Rate 15999 with A/c Room Cas...
Get Premium Hoskote Call Girls (8005736733) 24x7 Rate 15999 with A/c Room Cas...MOHANI PANDEY
 
RA 7942:vThe Philippine Mining Act of 1995
RA 7942:vThe Philippine Mining Act of 1995RA 7942:vThe Philippine Mining Act of 1995
RA 7942:vThe Philippine Mining Act of 1995garthraymundo123
 

Kürzlich hochgeladen (20)

Call Girls Ramtek Call Me 7737669865 Budget Friendly No Advance Booking
Call Girls Ramtek Call Me 7737669865 Budget Friendly No Advance BookingCall Girls Ramtek Call Me 7737669865 Budget Friendly No Advance Booking
Call Girls Ramtek Call Me 7737669865 Budget Friendly No Advance Booking
 
Cyclone Case Study Odisha 1999 Super Cyclone in India.
Cyclone Case Study Odisha 1999 Super Cyclone in India.Cyclone Case Study Odisha 1999 Super Cyclone in India.
Cyclone Case Study Odisha 1999 Super Cyclone in India.
 
Sector 18, Noida Call girls :8448380779 Model Escorts | 100% verified
Sector 18, Noida Call girls :8448380779 Model Escorts | 100% verifiedSector 18, Noida Call girls :8448380779 Model Escorts | 100% verified
Sector 18, Noida Call girls :8448380779 Model Escorts | 100% verified
 
Call Girls in Sakinaka Agency, { 9892124323 } Mumbai Vashi Call Girls Serivce...
Call Girls in Sakinaka Agency, { 9892124323 } Mumbai Vashi Call Girls Serivce...Call Girls in Sakinaka Agency, { 9892124323 } Mumbai Vashi Call Girls Serivce...
Call Girls in Sakinaka Agency, { 9892124323 } Mumbai Vashi Call Girls Serivce...
 
Call Girls In Okhla DELHI ~9654467111~ Short 1500 Night 6000
Call Girls In Okhla DELHI ~9654467111~ Short 1500 Night 6000Call Girls In Okhla DELHI ~9654467111~ Short 1500 Night 6000
Call Girls In Okhla DELHI ~9654467111~ Short 1500 Night 6000
 
Call Now ☎️🔝 9332606886 🔝 Call Girls ❤ Service In Muzaffarpur Female Escorts ...
Call Now ☎️🔝 9332606886 🔝 Call Girls ❤ Service In Muzaffarpur Female Escorts ...Call Now ☎️🔝 9332606886 🔝 Call Girls ❤ Service In Muzaffarpur Female Escorts ...
Call Now ☎️🔝 9332606886 🔝 Call Girls ❤ Service In Muzaffarpur Female Escorts ...
 
The Most Attractive Pune Call Girls Shirwal 8250192130 Will You Miss This Cha...
The Most Attractive Pune Call Girls Shirwal 8250192130 Will You Miss This Cha...The Most Attractive Pune Call Girls Shirwal 8250192130 Will You Miss This Cha...
The Most Attractive Pune Call Girls Shirwal 8250192130 Will You Miss This Cha...
 
Call Girls Talegaon Dabhade Call Me 7737669865 Budget Friendly No Advance Boo...
Call Girls Talegaon Dabhade Call Me 7737669865 Budget Friendly No Advance Boo...Call Girls Talegaon Dabhade Call Me 7737669865 Budget Friendly No Advance Boo...
Call Girls Talegaon Dabhade Call Me 7737669865 Budget Friendly No Advance Boo...
 
Green Marketing
Green MarketingGreen Marketing
Green Marketing
 
CSR_Tested activities in the classroom -EN
CSR_Tested activities in the classroom -ENCSR_Tested activities in the classroom -EN
CSR_Tested activities in the classroom -EN
 
Hot Call Girls |Delhi |Preet Vihar ☎ 9711199171 Book Your One night Stand
Hot Call Girls |Delhi |Preet Vihar ☎ 9711199171 Book Your One night StandHot Call Girls |Delhi |Preet Vihar ☎ 9711199171 Book Your One night Stand
Hot Call Girls |Delhi |Preet Vihar ☎ 9711199171 Book Your One night Stand
 
Call Girls Moshi Call Me 7737669865 Budget Friendly No Advance Booking
Call Girls Moshi Call Me 7737669865 Budget Friendly No Advance BookingCall Girls Moshi Call Me 7737669865 Budget Friendly No Advance Booking
Call Girls Moshi Call Me 7737669865 Budget Friendly No Advance Booking
 
Call Girls Magarpatta Call Me 7737669865 Budget Friendly No Advance Booking
Call Girls Magarpatta Call Me 7737669865 Budget Friendly No Advance BookingCall Girls Magarpatta Call Me 7737669865 Budget Friendly No Advance Booking
Call Girls Magarpatta Call Me 7737669865 Budget Friendly No Advance Booking
 
Presentation: Farmer-led climate adaptation - Project launch and overview by ...
Presentation: Farmer-led climate adaptation - Project launch and overview by ...Presentation: Farmer-led climate adaptation - Project launch and overview by ...
Presentation: Farmer-led climate adaptation - Project launch and overview by ...
 
Presentation: Farmer-led climate adaptation - Project launch and overview by ...
Presentation: Farmer-led climate adaptation - Project launch and overview by ...Presentation: Farmer-led climate adaptation - Project launch and overview by ...
Presentation: Farmer-led climate adaptation - Project launch and overview by ...
 
BOOK Call Girls in (Dwarka) CALL | 8377087607 Delhi Escorts Services
BOOK Call Girls in (Dwarka) CALL | 8377087607 Delhi Escorts ServicesBOOK Call Girls in (Dwarka) CALL | 8377087607 Delhi Escorts Services
BOOK Call Girls in (Dwarka) CALL | 8377087607 Delhi Escorts Services
 
DENR EPR Law Compliance Updates April 2024
DENR EPR Law Compliance Updates April 2024DENR EPR Law Compliance Updates April 2024
DENR EPR Law Compliance Updates April 2024
 
Get Premium Hoskote Call Girls (8005736733) 24x7 Rate 15999 with A/c Room Cas...
Get Premium Hoskote Call Girls (8005736733) 24x7 Rate 15999 with A/c Room Cas...Get Premium Hoskote Call Girls (8005736733) 24x7 Rate 15999 with A/c Room Cas...
Get Premium Hoskote Call Girls (8005736733) 24x7 Rate 15999 with A/c Room Cas...
 
RA 7942:vThe Philippine Mining Act of 1995
RA 7942:vThe Philippine Mining Act of 1995RA 7942:vThe Philippine Mining Act of 1995
RA 7942:vThe Philippine Mining Act of 1995
 
(INDIRA) Call Girl Katra Call Now 8617697112 Katra Escorts 24x7
(INDIRA) Call Girl Katra Call Now 8617697112 Katra Escorts 24x7(INDIRA) Call Girl Katra Call Now 8617697112 Katra Escorts 24x7
(INDIRA) Call Girl Katra Call Now 8617697112 Katra Escorts 24x7
 

Cullen reducing energy demand EST 2011

  • 1. Published: January 12, 2011 r 2011 American Chemical Society 1711 dx.doi.org/10.1021/es102641n |Environ. Sci. Technol. 2011, 45, 1711–1718 ARTICLE pubs.acs.org/est Reducing Energy Demand: What Are the Practical Limits? Jonathan M. Cullen, Julian M. Allwood,* and Edward H. Borgstein Department of Engineering, University of Cambridge, Trumpington Street, Cambridge CB2 1PZ, United Kingdom bS Supporting Information ABSTRACT: Concern over the global energy system, whether driven by climate change, national security, or fears of shortage, is being discussed widely and in every arena but with a bias toward energy supply options. While demand reduction is often mentioned in passing, it is rarely a priority for implementation, whether through policy or through the search for innovation. This paper aims to draw attention to the opportunity for major reduction in energy demand, by presenting an analysis of how much of current global energy demand could be avoided. Previous work led to a “map” of global energy use that traces the flow of energy from primary sources (fuels or renewable sources), through fuel refinery, electricity generation, and end-use conversion devices, to passive systems and the delivery of final energy services (transport, illumination, and sustenance). The key passive systems are presented here and analyzed through simple engineering models with scalar equations using data based on current global practice. Physically credible options for change to key design parameters are identified and used to predict the energy savings possible for each system. The result demonstrates that 73% of global energy use could be saved by practically achievable design changes to passive systems. This reduction could be increased by further efficiency improvements in conversion devices. A list of the solutions required to achieve these savings is provided. ’ INTRODUCTION: THE IMPORTANCE OF ENERGY DEMAND REDUCTION Three issues drive current interest in present and future global use of energy: the combustion of fossil fuels as a driver of global warming, national security related to energy trade, and global scarcity due to anticipated supply shortages. Possible responses to these concerns are summarized in the Kaya identity1,2 CO2 emissions ¼ Population  GDP Population  Energy GDP  CO2 emissions Energy ð1Þ Responses to concerns about energy patterns arising from the first two terms of eq 1, involving population control or wealth reduction, would be unprecedented and are far from current thinking. Most discussion is therefore limited to the third and forth terms, the technical options of energy efficiency (demand reduction) and carbon efficiency (supply substitution). Supply substitution is politically the more attractive of these two options. This is reflected in the International Energy Agency (IEA) (ref 3, p 173) figures on worldwide research and devel- opment expenditure on energy, where less than 10% of spending has been on energy efficiency in comparison with 40% for nuclear fission and fusion alone. The well-known catalogue of viable decarbonization options in the energy supply includes: switching to less carbon intensive fuels (e.g., from coal to gas), increased use of renewable energy sources (wind, hydro, solar, and biomass), increased nuclear power, and development of electricity genera- tion with carbon capture and storage (CCS). However, as MacKay4 demonstrates, for many countries (such as the U.K.) there is insuf- ficient land to allow a meaningful switch to renewable supplies, CCS is still unproven at scale, and the costs of investment in renewables, nuclear, or CCS solutions are high. As a result, in anticipating energy scenarios for 2050, the IEA in their most aggressive BLUE scenario (ref 3, p. 65), which targets a 50% global reduction in CO2 emissions from current levels, estimate that 21% of emissions savings will come from renewable energy, 19% from CCS, 18% from fuel switching, and 6% from nuclear, while energy efficiency measures account for 36% over and above their anticipated annual 0.9% baseline efficiency improvement. Are these predictions of future savings from energy efficiency sensible, conservative, or physically possible? The aim of this research is to provide a rational basis for assessing the potential for future developments in energy efficiency. In particular, the paper aims to answer the question: Given known physically proven options, how much global energy could be saved while still delivering current levels of final energy services? This research is needed because no previous study has provided a physical basis for examining the efficiency of the global energy system. Four strands of previous work have been identified, each contributing to the understanding of global energy efficiency potential, but none providing an integrated view: • Comparative methods compare energy use across countries, sectors, or products. Several reports provide means to com- pare energy use between different activities, attempting to prioritize larger energy users for more urgent action. For example, Summers (ref 5, p 150), the IPCC (ref 6, p 259), and the World Resources Institute (7, pp 4-5) provide Received: August 3, 2010 Accepted: December 20, 2010 Revised: December 14, 2010 DownloadedviaETHZURICHonJune9,2020at18:57:55(UTC). Seehttps://pubs.acs.org/sharingguidelinesforoptionsonhowtolegitimatelysharepublishedarticles.
  • 2. 1712 dx.doi.org/10.1021/es102641n |Environ. Sci. Technol. 2011, 45, 1711–1718 Environmental Science & Technology ARTICLE Sankey diagrams8 showing the flow of energy from fuel to economic sectors, the United States Department of Energy (USDOE)9 , and European Union (EU)10 publish best-prac- tice energy technology case-studies, and the United Kingdom (U.K.) Carbon Trust11 attributes national CO2 emissions to end-use consumer activities. These methods prioritize by scale but do not attempt to quantify the potential for energy saving - and cannot be used for this purpose, as they have insufficient detail on the technologies and do not fully repre- sent the flow of energy from fuel to final energy service. Comparative methods, which attribute energy use to economic sectors ratherthantotechnologies,failtodirectattentiontothe technical areas where efficiency gains can be made. • Top-down models aim to track historical trends in efficiency indicators and extrapolate forward. For example, based on a 20 year trend, the IEA predicts a baseline 1.7% annual improvement in global energy intensity from structural and efficiency effects between 2005 and 2050,3 while Pacala and Socolow12 predict a 1.96% annual improvement in carbon intensity for the next 50 years. However, such extrapolations based on past data ignore physical limits and assume that the underlying components of energy demand are stable, where, for example, Raupach et al.13 show how the declining trend in global energy intensity from 1980-2000 was reversed during the period 2001-2005. In practice, it seems that these top-down models are useful only for short-term predictions. • Bottom-up models survey best-practice efficiency measures and estimate their combined potential for reducing energy demand. Recent examples of bottom approaches include those from the EU,14 International Energy Agency (IEA),15 and U.K. Treasury.16 Bottom-up approaches have the attrac- tion of being technologically rooted but may be misleading because they only report known or emerging technologies, so they fail to capture the potential for innovation and because they often ignore the connections between devices in the energy network. Efficiency gains at different points in the energy network cannot simply be added because a saving in one technology may often reduce the potential for savings in a connected device. For example, an improvement to the aerodynamics of a vehicle will reduce the engine power requirement, allowing the engine size to be reduced. How- ever, a reduction in engine size also reduces the possible energy savings from efficiency improvements to the engine. Vattenfall’s “abatement curve”,17 McKinsey’s similar work,18 and Pacala and Socolow’s “wedges” 12 are all potentially misleading for this reason. • Physical models avoid the emphasis on known innovations implicit in bottom-up models by calculating theoretical efficiency limits based on engineering principles. Examples include the “energy bandwidth studies” of the USDOE Industrial Technologies Programme9 and 15 societal exergy studies reviewed by Ertesvag, 19 including an estimate by Nakicenovic et al.20 that the global efficiency of energy con- version in 1990 was around 10% of the theoretical limit. Often theoretical analyses are extremely technical, so they have been overlooked in broader studies aiming to identify energy efficiency options. It can be difficult to anticipate how much of the theoretical efficiency is practically achievable. Compared to the aims of this paper, we have not been able to identify any previous work that takes a technical view of the global energy system, using top-down data to ensure complete cover- age, but with appropriate and practically based bottom-up phys- ical models to ensure the practically achievable potential effi- ciency is identified. This paper aims to fill this gap. In addition, no existing work distinguishes the possible energy savings from improvements to conversion devices (e.g., engines, furnaces, and light-bulbs) from the savings in the surrounding passive systems (e.g., the building shell, the vehicle body structure, and the space into which the light shines). ’ GLOBAL ENERGY FLOW In ref 21, we created a Sankey diagram for current global energy use, which traces the flow of energy from primary sources (fuels or renewable sources), through energy conversion devices and passive systems, to final energy services (for example, trans- port, illumination, and sustenance). Central to our understand- ing of the flow of energy through the global system is the dis- tinction between conversion devices and passive systems. Conversion devices transform or upgrade energy into more useful forms and include examples such as fuel refineries, electricity generators, combustion engines, electric motors, and lightbulbs. An efficient device converts energy from one form to another quickly and with minimal loss. Conversion devices are normally linked together in chains, with the final conversion being to `useful energy’, mainly in the form of heat, motion, and light. Useful energy is delivered to passive systems, the last technical component in each energy chain, where it is eventually “lost” or dissipated as low-grade heat to the environment in exchange for the provision of final energy services. Unlike conversion devices, passive systems do not actively or intentionally convert energy to another form but instead “hold” or “trap” the useful energy for a time, to provide a level of final service - hence the term passive. Thus the building envelope traps heat (or coolth) to deliver a service of thermal comfort, the car body holds kinetic energy to provide a transport service, and the room traps light (albeit briefly) to provide illumination. Useful energy is eventually dissipated from the system, mostly as low-grade heat to the environment. A passive system that has lost energy must be topped up with more energy, in order to maintain a constant level of service. An efficient passive system is one that limits the loss of useful energy and therefore traps the energy for a longer period. For example, a well-insulated and sealed house traps heat for longer, an aerodynamic car body maintains kinetic energy, and a white painted room increases surface reflectance to prolong light. Thus, a passive system can be thought of as a reservoir or tank of stored energy - kinetic energy for the car, thermal energy for the house, and light for the room. The level in the tank equates to the final service level, and any output of energy from the tank must be balanced by an equal input of energy to maintain a constant service level. Fluctuations in the service level waste energy - for instance, when a car is starting and stopping fre- quently or when a furnace is not operated continuously - as moving from a high to low service level requires the tank to be drained of energy. Conversely, if all outputs from the tank are sealed, then a constant service level can be maintained without any additional energy input. In the idealized case of a car without friction or drag, motion would continue indefinitely, and if a building is perfectly sealed and insulated, a constant temperature can be maintained without the addition of heat. The production of materials and goods in industry deserves special attention. For industrial materials, most of the useful
  • 3. 1713 dx.doi.org/10.1021/es102641n |Environ. Sci. Technol. 2011, 45, 1711–1718 Environmental Science & Technology ARTICLE energy is delivered to passive systems such as furnaces and motor driven systems, where it is trapped as heat and motion and after some time lost as low-grade heat. However, a portion of the energy remains embedded in the material, resulting in a change in chemical or physical properties. This embedded energy is still trapped and provides a constant level of final service but, in this case, for a very long period of time. For example, energy is required to change iron ore into steel, with a portion of this energy be- coming embedded in the steel, while delivering mechanical strength over many years in a structure. Eventually,afteraconsiderabletimeperiod,theenergyembedded in the material will be lost, not as low-grade heat but as the material returns back to its natural environmental state, for example, the oxidation of steel to iron oxide. Analysis in the Supporting In- formation (summarized in Table S.13) shows that the total embedded energy (shown in the column Theoretical Minimum) in the global production of steel, cement, paper, and aluminum (11 EJ) is small compared to its total processing energy (66 EJ). In addition, the embedded energy in these materials is more than balanced by the release of embedded energy when making industrial chemicals (-15 EJ), as the energy in fossil fuels is liberated during exothermic chemical reactions. Thus, for this analysis, embedded energy in materials is ignored in order to focus attention on the passive systems of furnaces, driven, and steam systems, where losses could be more easily avoided. The importance of the distinction between devices andsystems is todraw attentiontothedifferenttechnicaloptions each offers when seeking future energy efficiency: Conversion device efficiencies relatetomoreeffectiveenergytransformationsandensuringdevices are sized for the output required of them; and passive system efficiencies are related to the avoidance of unintended losses and reducing mechanical and thermal inertia when the service level is required to fluctuate. The failure to distinguish between these two stages of global energy flow - energy conversion in devices and servicedeliveryfrom passivesystems- leads to the misleading concept of additive efficiencies implicit in abatement curves. Our work in ref 21 led to a Sankey Diagram in which the exergy value of primary energy sources (the maximum work that can be obtained from the energy source) was allocated through the elements of Figure 1 to deliver final energy services. In order to understand the efficiency of this flow, in addition to alloca- tions, we must also examine losses, and in ref 22, we calculated the theoretical efficiencies of the energy system and attributed losses to 10 mechanisms. The paper calculated a global conver- sion efficiency of 11% for all devices, including fuel transforma- tion, electricity generation, and end-use conversion, by comparing the current energy use in devices to the theoretical minimum energy requirement. However, this approach proved unsuitable for passive systems because, as discussed above, a final service level can be maintained without the input of any energy if all unintended losses are eliminated - the theoretical minimum energy requirement for service provision is zero, and defining a theoretical efficiency limit is meaningless. The work of ref 22 therefore calculated a theoretical conver- sion efficiency value for global energy flow only as far as the useful energy output by devices. Hence, this paper aims to extend the analysis by providing physical-based efficiency estimates for passive systems. By calculating the savings in energy use that can be achieved by existing physical solutions, it will be possible to make more informed comparisons between the investments required to address key energy concerns across both supply- and demand- side options. The analysis in this paper then is intended to assess the efficiency of passive systems, permitting a global energy flow diagram with losses to be created, with a structure like that of Figure 1. ’ PRACTICAL LIMITS TO EFFICIENCY IN PASSIVE SYS- TEMS In order to estimate the practical limits to energy efficiency of passive systems, scalar equations are identified for each passive system to predict the useful energy required to deliver the final energy service. These equations are dependent on design para- meters (mass, size, and so on), and by considering the limiting values of these design parameters, we can predict the practical minimum energy limits required to provide each service. The complete work of developing these models is described in the Supporting Information and summarized in the remainder of this section. In aiming to estimate the practical limits to energy require- ments in passive systems, three groups of passive systems are examined (as identified in ref 22): Vehicles (car, truck, plane, ship, and train), Industry (furnace, driven system, and steam system), and Buildings (heated/cooled space, hot water system, six types of domestic appliance, and illuminated space). For each, a model is developed based on simple scalar relationships familiar to all undergraduate engineers: Fourier’s law of thermal conduc- tion, Burnet-Gerrans equation of heat capacity, Newton’s law of cooling applied to heat exchange, extended Bernouilli equation for mechanical pumping, Darcy Weisbach equation for pressure loss in piping, Coulomb’s friction law, Rayleigh’s equation for drag, and Newton’s second law of motion. Where simple equa- tions are unable to provide sufficient insight, for instance in deter- mining energy requirements for planes and trains, reference is made to major studies examining future efficiency options. A key concern in developing our estimates has been to ensure representative system descriptions. For example, in estimating the potential for energy saving for all cars, the analysis depends on an estimate of current fleet composition, and this has been based on analysis of European Commission data on vehicle use in 15 EU countries in 2000. Similarly, estimates depend on assump- tions about the behavior of the users of passive systems. For example, without global statistics on cooking behavior, it is assumed that a typical domestic oven is used to cook food at 200 °C for 1 h per day. When statistics are available, they are used, for instance, average vehicle driving cycles are used to attribute fractions of engine power to overcoming inertia, mechan- ical, and aerodynamic drag. The context in which passive systems operate is also important, particularly for buildings, where heating Figure 1. Schematic Sankey diagram for provision of energy and material services showing losses, reproduced with permission from ref 22.
  • 4. 1714 dx.doi.org/10.1021/es102641n |Environ. Sci. Technol. 2011, 45, 1711–1718 Environmental Science & Technology ARTICLE and cooling requirements are dependent on regional tempera- ture and sunshine patterns. In this case, the required heating and cooling loads were determined using representative daily mean temperatures and solar irradiation cycles for two cities in each of the four global climatic zones selected. Armed with appropriate equations and representative data on current use, the practically achievable energy savings are esti- mated by examining how model parameters could feasibly be changed. Where parameters relate to the design of the passive system - coefficient of friction, mass, and thermal conductivity, for example - the values are selected from examples of existing best practice design, while aiming to avoid extremes that could not occur in practice. So, although the world’s most efficient car (the PAC-II) has a total unloaded mass of just 29 kg, the practical limit is defined here as 200 kg based on scaling the design for the Rocky Mountain Institute “2000 Revolution Hypercar”,23 an SUV, to the size of a typical small car. Low friction tires (tubeless Michelin 45-75R16) and minimal aerodynamic drag for the car body (based on the PAC-II) are assumed. For trains, the design is based on existing high-speed passenger trains, which have very low drag. Similarly, the estimate of practical limits in house design is based on established Passivhaus buildings standard, with annual heating loads of less than 15 kWh/m2 . The standard specifies low U values for the building shell (typically >300 mm of cavity wall insulation and triple glaze windows) and tightly controlled ven- tilation rates with heat recovery. In addition to these design choices, some limited behavior change is assumed to allow changes to the “set-points” of current use without otherwise assuming any reduction in service provi- sion. Thus, on the basis of the analysis of human adaptability for comfort in buildings, a wider range of acceptable temperatures within buildings is used to reduce the need for heating and cool- ing; a lower maximum speed for trains and ships is assumed (though not cars or planes); and domestic hot water systems are allowed to operate at lower temperatures (50 °C rather than 65 °C), as current settings are based on the need to avoid growth of legionella bacteria in hot water tanks, which are eliminated in the best practice design. Our analysis is summarized in Table 1, which shows the current energy supply allocated to each passive system taken directly from global analysis in ref 21 equations for each simple model with key design parameters and their current and practi- cally limiting values, an estimate of the fraction of current energy use that could be saved solely by changes to the passive system. The results suggest that we have engineering options to reduce current energy demand by 73%. A full description of each passive system model and all assumptions used to calculate the energy savings are in the Supporting Information. Figure 2 shows these results, with the width of each bar representing the scale of primary energy supply allocated to each passive system based on ref 21. Color is used to distinguish bet- ween the practical minimum energy required (blue) and what could practically be avoided (gray). The passive systems within each sector are ranked according to achievable energy savings (gray), and this ranking could be use to direct priorities for future research development and policy. ’ DISCUSSION The physical basis of our analysis in Table 1 can be translated into specific actions that will lead to a step change reduction in energy demand. Table 2 summarizes the practical steps required to achieve this in the passive systems discussed in this paper. The greatest energy savings can be achieved in the passive systems of buildings, both absolute (179 EJ) and as a percentage of total demand (83%). This is dominated by the savings in heating and cooling spaces (85 EJ), which could be avoided by designing buildings to the Passivhaus standard, and appliances (59 EJ). Several factors currently inhibit the deployment of more efficient technical solutions in buildings spaces: the variety of building designs, fragmented ownership, the disconnect between landlords and tenants, a reluctance to change the appearance of historical buildings, anoveremphasis oninitial capital cost instead of costing over the entire building lifetime, and the slow turnover of building stock. The practical minimum energy required for appli- ances is comparatively large (33%, 29 EJ) because the energy required to heat and cool food or display information is an essential part of the final energy service, and it is difficult to recovery ener- gy from washing applications at low temperature. Transport passive systems are already more efficient than buildings (avoidable loss averages 68%) because the need to carry fuel creates a natural driver to reduce frictional drag and vehicle weight. This is particularly pronounced for planes, where the weight of any additional fuel must be supported by the lift force generated by the engine thrust and wings. For this reason, the plane is the most optimized of the passive systems examined, with only 46% practical energy savings available. The largest savings for transport occur in passenger cars (91%, 37 EJ), where reducing the mass of the car and the rolling resistance are important. Cars are also less optimized because of the diversity of models and the need to compromise efficiency to satisfy the fashion element of car design. Light- weighting strategies for ships and trains are limited because the transported goods make up a large proportion of the total vehicle mass (typically 60% in trucks versus 5-10% in cars). The passive systems in industry are on average the most efficient (avoidable losses averages 62%), although the absolute savings are higher than for transport (95 EJ versus 72 EJ). This reflects the existence of economies of scale in industrial systems, standardization of equipment, and the natural commercial drive for efficiency improvement in energy intensive industries. The fraction of available energy savings across all three industrial systems - furnaces, driven systems, and steam systems - is similar (59-66%). Advances in industrial systems, despite the long operating life of equipment, give hope that similar improve- ments to building systems are also possible. Table 1 demonstrates a saving of 73% of global energy use by practically achievable design changes to passive systems. How- ever, the idea of global energy flow from source to service dis- cussed above and summarized in Figure 2 shows that total energy savings will be greater than this if equivalent steps are also taken in energy conversion devices (including fuel transformation, electricity generation, and end-use conversion). We have already in ref 22 provided calculations of theoretical efficiency potentials for conversion devices, so to illustrate the extent of practically achievable global energy savings, we estimate the practical effi- ciency limits for conversion devices by halving the theoretical gains calculated in ref 22. This crude estimate is derived from two sources. First, Blok (ref 24, p 89) suggests that “it is possible to bridge about half of the gap between the present best technologies and the thermo- dynamic minimum; that is, it is possible to cut the avoidable energy use in half” using known energy efficiency technologies in industry. Industry is already the most efficient sector, so this reduction may be a conservative estimate of possible savings in the building and transport sectors.
  • 5. 1715 dx.doi.org/10.1021/es102641n |Environ. Sci. Technol. 2011, 45, 1711–1718 Environmental Science & Technology ARTICLE Table 1. Summary Analysis of Passive System Savingsa system E equation design parameters C P F Building 215 83 heated/cooled space 86 QH þ QZ þ QI ¼ QS þ QV þ QT Uroof (W/m2 K) 1.2 0.1 98 QS ¼ P i ðUiAiÞðTinside - ToutsideÞ Uwalls, heat transfer coeff. 1.3 0.1 Ufloor 1.2 0.1 QV ¼ qFCpðTinside - ToutsideÞð1 - RÞ Uwindows 4.0 0.8 q (l/s/per), ventilation rate 30 7 QT ¼ mbuildingCp Cs, solar heat gain coeff. 0.5 0.5 QZ ¼ AwindowCSHθ R, heat recovery fraction 0 0.8 hot water systems 23 QH ¼ CpðTout - TinÞ þ QL - QX Utank (W/m2 K) 1.1 ∼ 80 QL ¼ P i UiAiðTstore - TairÞ Atank (m2 ) 2.2 0 UX (W/m2 K) 1200 1500 QX ¼ UXAXΔTLM AX (m2 ), heat exchange ∼ 3.1 illuminated space 18 LFdevice ¼ EÂA UFÂLLF E (Wm2 ), illuminance 780 130 95 UF, utilization factor 0.3 0.9 appliances 88 see SI for 6 appliance types ∼ ∼ ∼ 67 Industry 154 62 furnace 67 QF ¼ QS þ QV þ QT wshell (mm), insulation depth 100 250 62 QS ¼ P i ðUiAiÞðTinside - ToutsideÞ kshell (W/mK), thermal cond. 1.0 0.5 QV ¼ qFCpðTinside - ToutsideÞð1 - RflueÞ Rflue, heat recovery fraction 0 0.8 QT ¼ mproductCpTð1 - RproductÞ Rproduct, heat recovery fraction 0 0.4 driven system 56 FWshaft ¼ FWloss þ ΔP D, pipe diameter D 1.3D 59 FWloss ¼ 8fLq2 π gD5 see SI for nonpumping applications steam system 31 same as furnace model but with distribution replacing ventilation loss QS and QT improve as furnace, QD eliminated ∼ ∼ 66 Transport 106 70 car 40 W ¼ R Fνdt m (ton), loaded mass 1.3 0.3 91 ν (m/s), average velocity 19 19 F ¼ μmg þ 1 2Fv2 CDAf þ m μ, tire friction 0.015 0.001 CD, drag coefficient 0.41 0.10 A (m2 ), frontal area 2.0 1.5 truck 38 W ¼ R Fνdt m (ton), loaded mass 14 13 54 F ¼ μmg þ 1 2Fv2 CDAf þ m ν (m/s), average speed 18 18 μ, tire friction 0.012 0.005 CD, drag coeff. 0.95 0.31 A (m2 ), frontal area 7 7 plane 10 SFB ¼ W1 - W2 WPR ¼ c2 X 1 - Re- Z ZðR e- Z - c1Þ ηp (%), propulsive efficiency 81 95 46 c1, structural constant 0.32 0.38 c2, structural constant 2.0 1.9 Z ¼ R=X ¼ InðW1=W2Þ A, wing aspect ratio 10 5 k, vortex drag factor 1.2 1.1
  • 6. 1716 dx.doi.org/10.1021/es102641n |Environ. Sci. Technol. 2011, 45, 1711–1718 Environmental Science & Technology ARTICLE Second, a large proportion of the thermodynamic losses from conversion devices result from heat exchange across a finite tem- perature difference. The theoretical efficiency limit for these “heat engines” is defined using the ideal Carnot cycle: η = 1 - T2/T1, where T2 and T1 are the temperatures in Kelvin of the cold and hot reservoirs. However, Curzon and Ahlborn25 explain that to achieve this ideal efficiency requires the infinitely slow transfer of heat between the working substance and reservoirs, resulting in an actual power output of zero. Instead, if the rate of heat exchange is taken into account, a maximum power output can be calculated using: η = 1 - (T2/T1)1/2 . In typical heat exchange applications this reduces the avoidable losses by approximately half and serves as a realistic practical minimum efficiency. Applying this logic, a halving of the avoidable losses and using the calculated theoretical efficiency of 11% from ref 22 implies a practical efficiency limit for conversion devices of 56% (89%/2 þ 11%). Multiplying the practical efficiency limit for devices (56%) by that for passive systems (27%) provides an overall estimate of global efficiency of 15%; that is 85% of energy demand could be practically avoidedusingcurrentknowledgeandavailabletechnologies.Amore detailed prediction of the practical energy savings in conversion devices requires another extended analysis of the type we have described in this paper, and we plan this as future work. Table 1. Continued system E equation design parameters C P F X ¼ Hηeηp ffiffiffiffiffiffiffiffiffi πA 4kCDO q CDO, profile drag coeff. 0.021 0.003 L/D, lift/drag ration 18 37 R (km), range 5000 9000 ship 10 summary from survey of empirical testing of scale models ∼ ∼ ∼ 63 train 8 W ¼ R Fνdt m (ton), loaded mass 300 400 57 ν (m/s), average velocity 42 42 F ¼ A þ Bv þ Cv2 A , (N), drag coeff. 3300 2300 A % μmg, B ¼ Bðm, lÞ B (Ns/m), drag coeff. 28 58 c ¼ 1 2FAf ðCD þ λl=dÞ C (Ns2 /m2 ), drag coeff. 11 8 Total 475 73 a Notes. E: global energy supply allocated to this system (EJ). C: current setting for design parameters. P: practical limit to design parameter settings. F: fraction of current energy use that could be saved (%). Parameter settings have been rounded in some cases. Building parameters: For materials in the building fabric and the heating fluid (air or water): mass, m; density, F; specific heat capacity, Cp; temperature, T; and overall heat transfer coefficient, U. Heat transferred into building by heater, QH; solar, QZ; internal heating, for instance by occupants bodies, QI; heat transferred out of building through shell, QS; by ventilation, QV; or by transfer into thermal mass, QT. Other building parameters: Ai, surface area of type, i; and Hq, geographically specific solar irradiation. Water heating requirements: QH, depends on mass flow rate, set point Tout; losses QL, from storage tank and pipes (reduced to zero for a tankless point-of-use system), and QX, if a waste water heat recovery system is used; lighting device supplying luminous flux, LFdevice, required to provide average illuminance, E, over area, A, with utilization factor, UF; and light loss factor, LLF (assumed constant). Six appliances are discussed in the Supporting Information, SI so only the total savings are reported. Industry parameters: Heat provided to the furnace, QF, is balanced by heat loss from the shell, QS; leakage through door, vent, and flue openings, QV; and thermal losses from heating the shell (intermittent use) and the product, QT. For the practical limit, the furnace is continuously operated with no loss from air leakage, reduced shell thermal conductivity, k; thickness, w; and heat recover, R, from the flue gases and product. All driven systems are related to pumping;either for transport or pressure increase, DP, with losses related to the dimensional Darcy friction factor, f; the effective pipe length, L; pipe diameter, D; and q, the volumetric flow per unit area. The pipe diameter, D, is increased to find the practical limit. See the Supporting Information (SI) for solid materials, compressed air, and refrigeration. For steam generation, the furnace model is modified with distribution losses, QD, replacing ventilation losses, QV. For the practical limit, increased insulation reduces boiler losses and heat is recovered from the condensed steam, while distribution losses are eliminated with point-of-use systems. Transport parameters: Cars and trucks use the work provided by the engine to overcome mechanical drag (rolling), aerodynamic drag, and inertia (the resistance of mass). The practical limit is determined by reducing the loaded mass, m; tire friction, μ; drag coefficient for air, CD; and the frontal area, A. Inertia is assumed to be recovered by coasting (without braking) or regenerative brake systems. For planes, the specific fuel burn (SFB) of an airplane in kg/t km is calculated from the fuel consumed in flight (initial weight, W1, less final weight, W2) over the payload, WP, multiplied by the range, R, via the key performance factor X; two structural constants, c1 and c2; the fuel heating value, H; the propulsive, ηp, and thermal, ηe, efficiency of the engine (the latter of which is in our language a device, so invariant within the passive system); the wing aspect ratio, A; vortex drag factor, k; factor for non-crusing fuel, R; and profile drag coefficient; CDO. The practical limit for the plane is derived for a laminar flying wing aircraft with unducted fan propellers, and both current and limit designs are compared for their optimum ranges. The model of drag forces for ships is nonlinear and difficult to solve, so instead a survey of experimentally tested hull designs is used to estimate practical savings. For trains, the drag forces comprise three terms of which A is related to mechanical drag, B relates to both drag and air intake acceleration, and C is the aerodynamic drag. Full details of each passive system model, including equations, design parameters, current and limiting values, energy savings, and assumptions, are given in the Supporting Information.
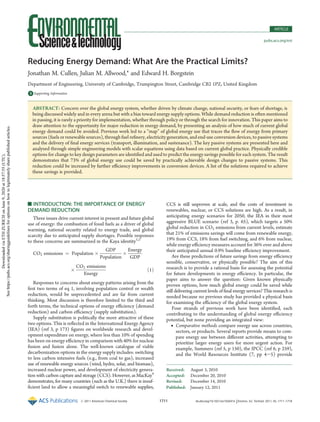
  • 7. 1717 dx.doi.org/10.1021/es102641n |Environ. Sci. Technol. 2011, 45, 1711–1718 Environmental Science & Technology ARTICLE The estimates made in this paper are subject to uncertainty, but by providing a practical basis for recommended change, we hope that the numbers are at least a pragmatic guideline to what could be achieved. Our calculation of potential energy savings is technically achievable, and yet significant economic and socio-cultural barriers are still present that limit the realizable improvement. Human choices are rarely driven by a sole desire to use energy efficiently, but instead include complex drivers such as social status (e.g., desire for larger cars and houses), security (e.g., stockpiling of armaments), and fashion (e.g., throwing away perfectly functional products because they appear outdated). We have not considered the social and economic implications of these changes, but the fact that they are based on existing designs gives a basis for future work in evaluating costs and predicting the effects of these changes on demand patterns. The analysis in this paper ought to be a reminder to policy makers and thought leaders on energy futures worldwide: res- ponses to the threat of climate change and to concern over energy security have to date mainly focused on developing new energy sources or decarbonising existing energy supply; those that ad- dress demand-side energy typically fail to isolate the potential reductions from passive systems. This analysis predicts that we could currently live with 73% less energy supply by applying known engineering best practice to passive systems that transform useful energy to services. An initial assessment of the practical effi- ciency limits in conversion devices provides an overall global and practical estimate for the reduction potential in demand-side op- tions, of 85%. National and international energy policy and the scenario analysis that support its development appears to pay insufficient attention to demand reduction, presumably in the fear that it implies service reduction. We hope that by describing a physical basis for reducing global energy demand to one-quar- ter of current levels by modifying passive systems (one-sixth if conversion devices are also included), without reduction in service Table 2. Practical Actions Required To Save 73% of the Energy Used by Passive Systems system practical actions to reduce energy demand Building heated/ cooled space >300 mm wall and roof cavity insulation with minimum thermal bridging and triple glazed windows, controlled ventilation with heat exchange and no leaks, maximum use of solar gains in cold climates, controlled solar gains and in hotter areas, and high thermal mass and passive ventilation to average out external temperature variations and avoid cooling hot water systems eliminate hot water tanks, reduce set point to 50 °C, and apply drain-water heat recovery illuminated space avoid excess illuminance, use task lighting to focus light as needed, and improved luminaire design appliances stove-top cooking in pans: use lid, halve thermal mass of pan, and add 30 mm thick fiberglass insulation to pot oven: seal oven throughout cooking time, 100 mm thick fiber- glass insulation, and avoid steel casing to reduce thermal mass fridge-freezer: defrost frozen food in fridge, mount compressor at top of fridge, 200 mm thick insulation, and improved com- partmentalization to reduce ventilation washing machines, dishwashers, and dryers: reduce temperature set-point, recover heat from wastewater, use less water, hori- zontal axis in washing machines, and heat recovery from dryers Industry furnace increaseinsulationthicknessby150mm,reducethermalconductivity to lowest value for known refractory bricks, improved heat recovery from exhaust flue, and recover heat from discharged heated products driven system increase pipe diameter by 25%, reduce corners in pumped systems, and similar increases for conveyor and other handling systems steam system avoid distribution by point of use generation, increase insula- tion, and reduced thermal conductivity Transport car reduce loaded car mass to 300 kg, reduce tire rolling resistance to 0.001 (Michelin 45-75R16), and reduce drag coefficient CD to 0.1 and frontal area from 2 m2 to 1.5 m2 truck reduce tire rolling resistance to 0.005 and drag coefficient to 0.31 plane laminar fixed wing aircraft with unducted fan engine design ship improve propeller and hull design, and reduce fleet speed by 10% train adopt Swedish X2 high-speed passenger train design, but limit to current average speed of 100km/h for freight and 150 km/h for passengers Figure 2. Practically available energy savings from global passive systems.
  • 8. 1718 dx.doi.org/10.1021/es102641n |Environ. Sci. Technol. 2011, 45, 1711–1718 Environmental Science & Technology ARTICLE provision, we can contribute to rebalancing this skewed empha- sis. True sustainability depends on living within an ecologically acceptable budget, and the key to achieving that is to require fewer input resources. ’ ASSOCIATED CONTENT bS Supporting Information. A detailed explanation of the calculations and assumptions used to predict the practical energy savings available in passive energy systems. Suppporting Information is available free of charge via the Internet at http://pubs.acs.org/ ’ AUTHOR INFORMATION Corresponding Author *Phone: þ44 1223 338181; fax: þ44 1223 332662; E-mail: jma42@cam.ac.uk. ’ ACKNOWLEDGMENT The first two authors are supported by a Leadership Fellow- ship provided by the U.K. Engineering and Physical Sciences Research Council (EPSRC) Reference EP/G007217/1. ’ REFERENCES (1) Kaya, Y. Impact of Carbon Dioxide Emission Control on GNP Growth: Interpretation of Proposed Scenarios; Response Strategies Work- ing Group, Energy and Industry Subgroup of the Intergovernmental Panel on Climate Change: Paris, 1990. (2) Yamaji, K., Matsuhashi, R., Nagata, Y. Kaya, Y. An Integrated System for CO2/Energy/GNP Analysis: Case Studies on Economic Measures for CO2 Reduction in Japan. In Workshop on CO2 Reduction and Removal: Measures for the Next Century, International Institute for Applied Systems Analysis, Laxenburg, Austria, March 19-21, 1991. (3) Energy Technology Perspectives 2008; International Energy Agency: Paris, 2008. (4) MacKay, D. J. Sustainable Energy: Without the Hot Air; UIT Cambridge: Cambridge, U.K., 2009. (5) Summers, C. M. The conversion of energy. Sci. Am. 1971, 225, 148–160. (6) Sims, R.; Schock, R.; Adegbululgbe, A.; Fenhann, J.; Konstantina- viciute, I.; Moomaw, W.; Nimir, H.; Schlamadinger, B.; Torres-Martinez, J.; Turner, C.; Uchiyama, Y.; Vuori, S.; Wamukonya, N.; Zhang, X. Energy Supply. In Climate Change 2007: Mitigation. Contribution of Working Group III to the Fourth Assessment Report of the Inter- governmental Panel on Climate Change; Metz, B., Davidson, O. R., Bosch, P. R., Dave, R., Meyer, L. A., Eds.; Cambridge University Press: Cambridge, U.K., 2007. (7) Baumert, K. A., Herzog, T. Pershing, J. Navigating the Numbers: Greenhouse Gas Data and International Climate Policy; World Resources Institute: Washington, DC, 2005. (8) Schmidt, M. The Sankey diagram in energy and material flow management. J. Ind. Ecol. 2008, 12 (1), 82–94. (9) ITP Best Practices. Industrial Technologies Program, U.S. De- partment of Energy. http://www1.eere.energy.gov/industry/bestprac- tices/. (10) Action Plan for Energy Efficiency. European Union. http:// europa.eu/legislation_summaries/energy/energy_efficiency/. (11) The Carbon Emission Generated in All That We Consume; Carbon Trust: Whitney, U.K., 2006. (12) Pacala, S.; Socolow, R. Stabilization wedges: Solving the climate problem for the next 50 years with current technologies. Science 2004, 305, 968–972. (13) Raupach, M. R.; Marland, G.; Ciais, P.; Le Quere, C.; Canadell, J. G.; Klepper, G.; Field, C. B. Global and regional drivers of accelerating CO2 emissions. Proc. Natl. Acad. Sci. U.S.A. 2007, 104, 10288–10293. (14) Action Plan for Energy Efficiency: Realising the Potential; Com- mission of the European Communities: Brussels, 2006. (15) Energy Technologies at the Cutting Edge; International Energy Agency: Paris, 2005. (16) EnergyEfficiency InnovationReview; HM Treasury: London, 2005. (17) Nelson B. Vattenfall’s Global Climate Impact Abatement Map, 2007. Vattenfall. http://www.iea.org/work/2007/priority/Nelson.pdf. (18) Bressand, F.; Farrell, D.; Hass, P.; Morin, F.; Nyquist, S.; Remes, J.; Roemer, S.; Rogers, M.; Rosenfeld, J.; Woetzel, J. Curbing Global Energy Demand Growth: The Energy Productivity Opportunity; McKinsey Global Institute, 2007. http://www.mckinsey.com/mgi/pub- lications/. (19) Ertesvag, I. Society exergy analysis: A comparison of different societies. Energy 2001, 26, 253–270. (20) Nakicenovic, N.; Gilli, P. V.; Kurz, R. Regional and global exergy and energy efficiencies. Energy 1996, 21, 223–237. (21) Cullen, J. M.; Allwood, J. M. The efficient use of energy: Tracing the global flow of energy from fuel to service. Energy Policy 2010, 38 (1), 75–81. (22) Cullen, J. M.; Allwood, J. M. Theoretical efficiency limits for energy conversion devices. Energy 2010, 35 (5), 2059–2069. (23) Lovins, A. B.; Cramer, D. R. HypercarsÒ, hydrogen, and the automotive transition. Int. J. Veh. Des. 2004, 35, 50–85. (24) Blok, K. (2005). Improving energy efficiency by five percent and more per year? J. Ind. Ecol. 2005, 8 (4), 87-99. (25) Curzon, F. L.; Ahlborn, B. Efficiency of a Carnot engine at maximum power output. Am. J. Phys. 1975, 43, 22–24.