SlideShare ist ein Scribd-Unternehmen logo
1 von 12
Downloaden Sie, um offline zu lesen
School Science Review, December 2001, 83(303) 23
Millar Biology statistics made simple using Excel
Biology statistics made
simple using Excel
Neil Millar
Spreadsheet programs such as Microsoft Excel can transform the use of
statistics in A-level science
ABSTRACT
Modern spreadsheet software, such as Microsoft
Excel, can transform the use of statistics in
biology. Instead of being difficult to do and to
interpret, statistical tests become simple to do
and much easier to interpret. This article des-
cribes when and how to carry out many of the
most common tests (including mean, standard
deviation, confidence limits, correlation, regress-
ion, t-test, χ2
-test and ANOVA) using Excel.
Statistics is an area that mostA-level biology students
(and their teachers!) find difficult. The formulae are
often complicated, the calculations tedious, degrees
of freedom mysterious, and probability tables
confusing. But in fact students need no longer grapple
with any of these. In real life, biologists and
statisticians rarely use calculation and tables these
days, but instead use statistical packages such as
Minitab or SPSS. But it isn’t even necessary to buy
an expensive statistics package, since spreadsheet soft-
ware such as Excel has most of the common statistical
tests built-in.
When using statistics, the first hurdle is to decide
which statistical test to use. Figure 1 (overleaf) is a
flow chart showing when to use the various tests
described in this article. There are many other possible
statistical tests, but this flow chart should be more
than sufficient for A-level biology students. It briefly
summarises the Excel formulae and how to interpret
the results, so it can be used as a handy guide on its
own once the student is familiar with the tests. This
flow chart should be used when designing an
experiment, not after the experiment is complete. This
will ensure that the correct kind of data are collected
so that the statistical test will be valid. The rest of the
article describes in detail how to carry out these tests
using Excel and how to interpret the results. It is
divided into five sections:
1 Descriptive statistics mean, median, mode
standard deviation,
standard error,
confidence interval
2 Graphing data scatter graphs, bar
graphs
error bars, lines
3 Association statistics Pearson coefficient,
Spearman coefficient
linear regression
4 Comparative statistics paired and unpaired
t-test
Mann-Whitney U-test
ANOVA
5 Frequency statistics χ2
-test
χ2
-test of association
1Descriptive statistics
Most school biology experiments will involve some
kind of measurement, such as time, length, mass,
temperature, absorbance, etc., and in a well-designed
experiment there should be a number of repeats (or
replicates) of each measurement. Once some measure-
ments have been collected the first job is usually to
summarise them using descriptive statistics. Excel has
formulae for the three measures of the centre of a
distribution of replicates.
The arithmetic mean is given by the formula:
=AVERAGE (range)
The median is given by the formula:
=MEDIAN (range)
And the mode is given by the formula:
=MODE (range)
Biology statistics made simple using Excel Millar
24 School Science Review, December 2001, 83(303)
Figure 1 Flow chart used to choose an appropriate statistical test.
School Science Review, December 2001, 83(303) 25
Millar Biology statistics made simple using Excel
These formulae are illustrated in Figure 2. In many
cases the quantities measured in biology will show a
normal distribution, and so the mean is the most appro-
priate statistic to use. It is also the one students are
most likely to know already, and to be able to do by
hand. The median and mode are less likely to be
needed for experimental data, but someA-level speci-
fications require a knowledge of them. It is unfortunate
that Excel uses the word ‘average’ for ‘mean’, as some
textbooks use average as a general term to refer to
any measure of the centre of a distribution.
A statistician will tell you that there is no point in
calculating a mean without also calculating some
measure of the variation or spread of the measure-
ments, but students often don’t bother because of the
difficulty of the calculations. Figure 2 shows five
different measures of the spread, and shows how easy
they are to calculate using Excel.
■ The range is given by the Excel formula:
=MAX (range) - MIN (range)
This is the simplest, but least useful.
■ The variance is given by the Excel formula:
=VAR (range)
This is used in calculations, but has little use as a
descriptive statistic since it is not in the same units
as the measurements.
■ The standard deviation (SD) is given by the Excel
formula:
=STDEV (range)
This is common (since it is fairly easy to calculate
by hand) and it gives a good indication of the
variability of a set of data. However it is not the
best statistic to use when comparing different sets
of data, especially if the data sets are different
sizes.
■ The standard error of the mean (SE) is given by
the formula:
=STDEV (range) / SQRT (COUNT (range))
This gives an indication of the confidence of the
mean, and is often used as an error measurement
simply because it is small rather than for any good
statistical reason.
■ The 95% confidence interval (CI) is given by the
formula:
=CONFIDENCE(0.05,STDEV(range),COUNT(range))
Figure 2 Eight descriptive statistics. The MODE formula returns #N/A because no values are duplicated, so
there is no modal value in these data. Note that Excel will always return the results of a calculation to about 8
decimal places. This is usually meaningless, and cells with calculated results should always be formatted to a
more sensible precision (Format menu > Cells > Number tab > Number).
Biology statistics made simple using Excel Millar
26 School Science Review, December 2001, 83(303)
The value of 0.05 is used to give the 95% (0.95)
confidence interval, and different values can be
used for different levels of confidence, such as
0.01 for a 99% confidence interval.There is a 95%
probability that the true mean lies within ± CI from
the measured mean, and the upper and lower
values of this range are called the confidence
limits.
Of these five, the 95% confidence interval is the most
useful measure of the dispersion of data around the
mean, and also the easiest to understand. It is not as
well known as the others because it is so difficult to
calculate, but using Excel it is no more difficult to
calculate than the others. It is the preferred statistic to
use when comparing different sets of data, and when
drawing error bars on a graph. Students should always
be encouraged to calculate a CI whenever they
calculate a mean, and to refer to it whenever they
evaluate their data. If the CI is small compared to the
mean then the mean is reliable, but if the CI is large
compared to the mean then the mean is unreliable. In
Figure 2 the two sets have the same means but
different spreads, and the statistics all show that the
data in groupAhave a smaller spread and are therefore
more reliable than those in group B.
2 Graphing data
Graphs are an important part of data analysis and are
closely connected to statistics, since the choice of
graph is connected to the choice of statistical test, as
the flow chart in Figure 1 shows. If you are investigat-
ing an association between two variables, then you
should plot a scatter graph; if you are comparing
different sets of data, you should plot a bar graph;
and if you are collecting frequency data, then you may
plot a bar or pie chart, or a graph may not be
appropriate. In Excel it is quite easy to plot these
graphs, as well as many other types. First enter the
data into columns or rows, and select them. Then click
on the chart wizard (or Insert menu > Chart). This
wizard has four steps:
1 In Graph Type, select the type you want and press
Next. Choose ‘Column’ for bar charts or ‘XY
(Scatter)’ for line and scatter graphs. Do not
choose ‘Line’, which plots the data against row
number. This is a very common mistake.
2 In Source Data, if the sample graph looks about
right, then just press Next. If it looks wrong, you
can correct it by clicking on the series tab, and
then the red arrow at the end of the X Values box.
Then highlight the cells containing the X data in
the spreadsheet and press the red arrow again.
Repeat for the Y Values box.
3 In Chart Options, the most important tasks are to
type in suitable titles for the graph and the two
axes. You can also turn off gridlines and legend,
which makes the chart look better.
4 In Graph Location, just press Finish. This puts
the chart beside the data so you can see both.
Excel graphs are quite flexible and almost everything
about them can be changed. Just double-click (or
sometimes right-click) on the part you want to change.
For example, you can move and re-shape the graph;
change the background colour (white is usually best);
change the shape and size of the markers (points);
join the points; change the axes scales and tick marks;
or add a trend line or error bars. Students should be
discouraged from using 3D or shadow effects, which
only serve to obscure the graph trend. It is worth taking
some time to get the graph right, because you can use
an existing graph as a template. Simply type the new
data in place of the existing data, and the graph
automatically changes. The sheet can then be saved
as a new file.
Error bars
If you are plotting averages on a scatter or bar graph,
then error bars are a very good way to illustrate the
confidence of the data on the graph. Again, they are
awkward to do by hand, but quite easy with Excel,
and students should be encouraged to use error bars
as a matter of course. Error bars usually show ± CI,
although you could also plot them from SD or SE.
Double-click on any data point or bar to get the Format
Data Series dialogue box, and choose theYError Bars
tab. Click in the Custom + box, and highlight the range
of cells containing your confidence intervals. Repeat
for the Custom – box, and then press OK. Error bars
are useful for the evaluation part of student
investigations. Small error bars suggest reliable data;
large error bars suggest dubious data. A line of best
fit should pass through the error bars, and a good
question to address in an evaluation is ‘Could I draw
a different line through my error bars?’ (in other
words, do the data support a different conclusion?).
Figure 3 shows a graph where a curve has been drawn,
but in fact a straight line would also pass through the
error bars, so a linear relation is also supported by the
data.
School Science Review, December 2001, 83(303) 27
Millar Biology statistics made simple using Excel
Lines
Scatter graphs often have lines, which either join the
data points or form a smooth ‘line of best fit’ (or trend
line) through the middle of the points. The choice
depends on the circumstances, but generally, if there
should be a continuous smooth relation between X
and Y, then a trend line is appropriate; otherwise the
points should be joined by straight lines. Trend lines
are best drawn on the graph by hand, unless you want
a linear regression line (see below). To join the points
with lines: double-click on any data point, select the
Patterns tab and click on Line-Automatic. It is not
usually a good idea to have Excel draw a curved or
smoothed line, as these curves can be highly
misleading and can create spurious peaks and troughs
for which there is no evidence.
3 Association statistics
A common task in data analysis is to investigate an
association between two variables. This can be a
correlation to see if two variables vary together, or a
regression to see how one variable affects another.
We’ll see how to do each of these in Excel. In both
cases a scatter graph should be plotted first.
Correlation
A correlation tells us whether the two variables vary
together, i.e. as one goes up the other goes up (or goes
down). The most common tests for correlation are
the Pearson product-moment correlation coefficient
(r) for normally-distributed (parametric) data, and the
Spearman rank-order correlation coefficient (rs
) for
data that are not normally distributed (non-parametric
data). Both vary from +1 (perfect correlation) through
0 (no correlation) to –1 (perfect negative correlation).
In Excel the Pearson coefficient can be found by two
alternative formulae:
=CORREL (range 1, range 2)
or
=PEARSON (range 1, range 2)
There is no direct formula for the Spearman
coefficient, but it can be calculated by first making
two new columns for the ranks of the original data.
For each of the two variables the largest value is given
a rank of 1, the next largest a rank of 2, and so on.
This can most simply be done by hand, or for large
data sets, by using Excel’s =RANK command.
The Spearman coefficient is then simply the
Pearson coefficient calculated on the rank data,
ignoring the original data. Both coefficients are
demonstrated in Figure 4. This shows measurements
on the size of breeding pairs of penguins to see if
there is a correlation between the sizes of the two
sexes. The Spearman coefficient rs
(0.77) is more
conservative than the Pearson coefficient r (0.88), but
both show a strong positive correlation.
Linear regression
Regression is used when we have reason to believe
that changes in one variable cause the changes in the
other. A correlation is not evidence for a causal
relationship, but very often we are aware of a causal
relationship and we design an experiment to
Figure 3 A scatter graph showing error bars. A curved line of best fit has been drawn through the data points,
but in fact a straight line can also be drawn within the error bars, so a linear relationship is not ruled out.
Biology statistics made simple using Excel Millar
28 School Science Review, December 2001, 83(303)
investigate it further. The simplest kind of causal
relationship is a straight-line relationship, and this can
be analysed using linear regression. This fits a straight
line to the data using a least squares method, and gives
the values of the slope and intercept that define the
line (m and c in the equation y = mx + c). There are
several different ways of calculating the slope and
intercept of a linear regression line in Excel, but the
simplest is to plot a scatter graph and use the
‘Trendline’ feature of the graph. Right-click on any
data point on the graph, select Add Trendline, and
choose Linear. Click on the Options tab, and select
Display equation on chart. You can also choose to set
the intercept to be zero (or some other value), and to
display r2
(the square of the Pearson correlation
coefficient). The full equation with the slope and
intercept values is now shown on the chart. This is
demonstrated in Figure 5, which shows data obtained
from counting a yeast cell suspension in a haemo-
cytometer and in a colorimeter. We expect a linear
causal relationship between cell density and turbidity,
so this is a good occasion to use regression, and we
can use the equation to predict the cell count for a
given absorbance.
4 Comparative statistics
Another common task in data analysis is to compare
two or more sets of data to determine whether they
are basically the same (i.e. they could come from the
same population) or one set is significantly different
from the others. To start with, it is good practice to
calculate the means and CIs for the different groups
and plot a bar chart with the CIs represented as error
bars. This gives us a good visual idea of how different
the groups are. It is sometimes thought that if the error
bars don’t overlap, then there must be a significant
difference between the data, but this is not necessarily
true, and a statistical test of comparison is needed to
test for significant differences. The end result of such
tests is a probability (P) that the ‘null hypothesis’
(which always states that there is no difference
between the sets of data) is true. In biology we usually
accept differences as being significant if P is less than
5%, so if P < 5% then we can say that there is a
significant difference between the sets of data (i.e.
reject the null hypothesis). If P > 5% then we can say
that there is no significant difference between the sets
of data (i.e. accept the null hypothesis).
Figure 4 Two types of
correlation coefficient. The data
are the lengths of a leg bone (in
mm) in penguin mating pairs.
The Pearson coefficient r can
be calculated directly from the
data, but the Spearman
coefficient rs
must be calculated
from the ranks of the data. The
ranks can either be entered by
hand or calculated using
Excel’s =RANK formula.
School Science Review, December 2001, 83(303) 29
Millar Biology statistics made simple using Excel
t-test
The most common comparative statistical test is the
t-test, which is used when there are just two sets of
normally-distributed data to compare. In Excel this is
performed by the formula
=TTEST (range 1, range 2, tails, type)
which returns P directly (not the t statistic itself, which
is not reported and we don’t need). Tails can be 1 for
a one-tailed test or 2 for a two-tailed test, but in biology
we generally want the two-tailed test, which tests for
differences regardless of sign. Type can either be 1
for paired data (when the two sets are from the same
individuals) or 2 for unpaired data (where the sets are
from different individuals), and both are common.
Both kinds of t-test are demonstrated in Figure 6.
In the unpaired test (type 2) the yield of potatoes in
10 plots treated with one fertiliser was compared to
that in 10 plots treated with another fertiliser. Fertiliser
B delivers a larger mean yield, but the t-test P shows
that there is an 8% probability that these two sets are
not really different. Since this is more than 5% we
must conclude that fertiliser B is not significantly
better than fertiliser A. In the paired test (type 1), the
pulse rate of 8 individuals was measured before and
after a large meal. The mean pulse rate is a little higher
after the meal, and the t-test P shows that there is
only a tiny 0.006% probability that the before and
after data are the same. So the pulse rate does
significantly increase after a meal. This demonstrates
the value of a paired test: although the data are quite
varied, with quite a high CI, the pulse rate increased
in each individual leading to the high significance of
the conclusion.
Excel provides two more formulae involving the
t-test. The formula
=TDIST (t, dof, tails)
can be used to replace a look-up table, since it returns
the probability corresponding to the given t value and
degrees of freedom. The formula
=TINV (P, dof)
does the reverse: it returns a t value corresponding to
a given probability P. You shouldn’t normally need
these formulae.
Mann-Whitney U-Test
The t-test requires that the data be continuous and
normally distributed. Sometimes this is not possible,
for example if the data are calculated rather than
measured, or if the data are counted. In this case the
Mann-Whitney U-test, which is the non-parametric
equivalent of the t-test, should be used. Unfortunately
Excel does not support this test. You could use Excel
to calculate the U statistic, but you would still need
probability tables to find the significance.
Figure 5 Linear regression. The scatter graph has a trend line with the regression equation displayed. In this
case the intercept was fixed at zero, which is appropriate for these data.
Biology statistics made simple using Excel Millar
30 School Science Review, December 2001, 83(303)
ANOVA
The t-test is limited to comparing two sets of data,
and to compare many groups at once you need analysis
of variance (ANOVA). This is normally considered
beyond the scope of a school biologist, since it is so
difficult to calculate by hand, but in fact it is just as
easy to perform with Excel as any other statistical test.
Since it is so useful (it can even replace the t-test)
there is no reason not to include ANOVA in the
repertoire of A-level biologists. ANOVA is part of
Excel’s Data Analysis Pack, which is part of normal
Excel, but not always installed. (If there is no Data
Analysis option on the Tools menu you need to run
Excel set-up to install the ‘Analysis Toolpak add-in’.)
Figure 6 Two kinds of t-test. Top: unpaired t-test (type 2). Bottom: paired t-test (type 1). The cells with the
t-test probabilities have been formatted as a percentage (Format menu > cell > number tab > percentage).
This automatically multiplies the value by 100 and adds the % sign. This can make probability values easier
to read and understand.
School Science Review, December 2001, 83(303) 31
Millar Biology statistics made simple using Excel
From the Tools menu select Data Analysis and then
ANOVA Single Factor. This brings up the ANOVA
dialogue box, as shown in the example in Figure 7,
which concerns the grain yield from three different
varieties of wheat. Enter the Input Range by clicking
in the box and then selecting the range of cells
containing the data, including the headings. Check
that the columns/rows choice is correct (this example
is in three columns), and click in Labels in First Row
if you have included these. The column headings will
appear in the results table. Leave Alpha at 0.05 (for
the usual 5% significance level), then click in the
Figure 7 Comparing three sets of data using ANOVA. The most important value is the P value, which has
been formatted as a percentage (cell F18, indicated by the arrow). The bar graph was drawn using the
average values (cells D12:D14) for the bars and the variance values (cells E12:E14) for the error bars.
Biology statistics made simple using Excel Millar
32 School Science Review, December 2001, 83(303)
Output Range box and click on a free cell on the
worksheet, which will become the top left cell of the
8 × 15-cell results table. Finally press OK.
The output is a large data table, and you may need
to adjust the column widths to read it all. The most
important cell is the P value, which as usual is the
probability that the null hypothesis (that there is no
difference between any of the data sets) is true. This
is the same as a t-test probability, and in fact if you
tryANOVAwith just two data sets, it returns the same
P as a t-test. If P > 5% then there is no significant
difference between any of the data sets (i.e. the null
hypothesis is true), but if P < 5% then at least one of
the groups is significantly different from the others.
In Figure 7 P is 0.14%, which is less than 5%, so
there is a significant difference somewhere. The
problem now is to identify where the difference lies.
The correct way to do this is to use further post hoc
tests, but unfortunately Excel doesn’t support any of
these, which is an unfortunate limitation of ANOVA
in Excel. However, in many cases the different
group(s) can be identified from the summary table
and the bar graph (if drawn). In Figure 7, for example,
varieties 2 and 3 are very similar, but variety 1 is
obviously different. So the conclusion would be that
variety 1 has a significantly lower yield than varieties
2 and 3.
5 Statistics for frequency data
χ2
-test
The statistics so far have concerned measurement data.
Sometimes in biology the results are not measure-
ments but counts (or frequencies) of things, such as
counts of different phenotypes in genetics experiments
or counts of species in different habitats. With
frequency data you can’t usually calculate means, or
SD, or do a t-test. Instead you do a ‘chi-squared’ (χ2
)
test, which is used to compare frequency data in
different categories with some expected data. The
Excel formula is
=CHITEST (observed range, expected range)
and it returns the probability P that the null hypothesis
(which states that there is no difference between the
observed and expected frequencies) is true. There are
Figure 8 Two kinds of χ2
-test. Top: expected values from theory, calculated assuming 3/4 of the flowers
should be red and 1/4 should be white. Bottom: expected values assuming equal distribution. Again the cells
with the χ2
-test probability have been formatted as a percentage.
School Science Review, December 2001, 83(303) 33
Millar Biology statistics made simple using Excel
three different uses of the χ2
-test depending on how
the expected data are calculated.
Sometimes the expected data can be calculated
from a quantitative theory, in which case you are
testing whether your observed data agree with the
theory (if P < 5% then the data do not agree with the
theory, and if P > 5% then the data do agree with the
theory). There aren’t many examples of quantitative
theories in biology, and the most common example is
a genetic cross, where Mendel’s laws can be used to
predict frequencies of different phenotypes. An
example of this is shown in Figure 8 (top), where we
expect the results of a genetic cross to be a 3:1 ratio
of red to white flowers. Simple Excel formulae can
be used to calculate the expected counts given the
total number of observations. The χ2
P is 53%, which
is much greater than 5%, so the results do indeed
support Mendel’s law. Incidentally a very high P
(>80%) is suspicious, as it means that the results are
just too good to be true. This suggests some bias in
the experiment, whether deliberate or accidental.
On other occasions the expected data are calcul-
ated by assuming that the counts in all the categories
should be the same, in which case you are testing
whether there is a difference between the sets (if
P < 5% then the sets of data are significantly different
from each other, and if P > 5% then there is no
significant difference between the sets). This version
is a bit like the t-test, but it is used with frequency
data and can compare more than two categories. An
example of this is also shown in Figure 8 (bottom),
where the sex of children born in a hospital over a
period of time is compared. There are more boys than
girls, but is the difference significant? The expected
values are calculated by assuming there should be
equal numbers, and the χ2
P of 6.4% is greater than
5%, so there is no significant difference between boys
and girls.
χ2
-test of association
The final use of the χ2
-test is to investigate
associations between frequency data in two separate
groups. This is called the χ2
-test of association (or χ2
contingency table), and the expected data are
calculated by assuming that the counts in one group
are not affected by the counts in the other group. In
other words you are testing whether there is an
association between the two groups, and if P < 5%
then there is a significant association between the two
groups, while if P > 5% then the two groups are
independent. Each group can have counts in two or
more categories, and the observed frequency data are
set out in a table, called a contingency table. A copy
of this table is then made for the expected data, which
are calculated for each cell from the corresponding
totals of the observed data using the formula:
Figure 9 shows an example of this in which the flow
rate of a stream (the two categories fast/slow) is com-
pared to the type of stream bed (the four categories
weed-choked/some weeds/shingle/silt) at 50 different
sites to see if there is an association between them.
Figure 9 The χ2
-test for association. The observed data were entered in the upper table, and the expected
data in the lower table were calculated from the sums for each column and row. Only some examples of the
formulae used are shown.
E = ____________________column total × row total
grand total
Biology statistics made simple using Excel Millar
34 School Science Review, December 2001, 83(303)
The χ2
P of 1.1% is less than 5%, so there is a signific-
ant association between flow rate and stream bed.
Excel provides two more formulae involving the χ2
-
test. The formula
=CHIDIST (χ2
, dof)
can be used to replace a look-up table, since it returns
the probability corresponding to the given χ2
value
and degrees of freedom. The formula
=CHIINV (P, dof)
does the reverse: it returns a χ2
value corresponding
to a given probability P.You shouldn’t normally need
these formulae.
Closing remarks
In the new GCE biology A-level, simple descriptive
statistics and graphs are required at AS level, while
some of the association, comparative and frequency
statistics are required at A2 level. A statistical test is
also required as part of the A2 coursework, and the
exam boards AQA, OCR and Edexcel have informed
me that it is quite acceptable for these tests to be
carried out using a computer program such as Excel.
The important skills are to choose the appropriate test,
apply it correctly, and interpret the result correctly.
Many of these statistical tests may also be required
by students studying sports science and psychology
at A-level. Note however that in some cases a know-
ledge of the equations and the use of probability tables
may be required in a written exam, so students may
still be stuck with these for now.
Further reading
These are a few recently published books for further
information.
Cadogan, A. and Sutton, R. (1994) Maths for Advanced
Biology. London: Nelson.
Dretzke, B. J. (2001) Statistics with Excel, 2nd ed. New York:
Prentice Hall.
Dytham, C. (1999) Choosing and using statistics. A
biologist’s guide. Oxford: Blackwell Science.
Ennos, R. (2000) Statistical and data handling skills in
biology. New York: Prentice Hall.
Morgan, L. A. and Triola, M. F. (2001) Elementary statistics
using Excel. London: Addison Wesley Longman.
An Excel file containing all the examples in this
article, together with statistics worksheets aimed at
A-level biology students, can be downloaded from
the Biology4all website (www.biology4all.com).
Select Teachers > Resource library > Statistics.
This site is run by Dr Peter Robinson at the
University of Central Lancashire and contains a large
number of resources for biology teachers and
students in secondary and further education.
Neil Millar is Head of Biology at Heckmondwike Grammar School, High Street, Heckmondwike, WH16 0AH.
E-mail: nmillar@cwcom.net

Weitere ähnliche Inhalte

Was ist angesagt? (20)

Data Analysis
Data AnalysisData Analysis
Data Analysis
 
Inferential Statistics
Inferential StatisticsInferential Statistics
Inferential Statistics
 
Descriptive Statistics - SPSS
Descriptive Statistics - SPSSDescriptive Statistics - SPSS
Descriptive Statistics - SPSS
 
Basics stat ppt-types of data
Basics stat ppt-types of dataBasics stat ppt-types of data
Basics stat ppt-types of data
 
Introduction to Statistics - Basic concepts
Introduction to Statistics - Basic conceptsIntroduction to Statistics - Basic concepts
Introduction to Statistics - Basic concepts
 
DATA Types
DATA TypesDATA Types
DATA Types
 
T test statistics
T test statisticsT test statistics
T test statistics
 
statistic
statisticstatistic
statistic
 
Introduction to statistics
Introduction to statisticsIntroduction to statistics
Introduction to statistics
 
Biostatistics Data
Biostatistics DataBiostatistics Data
Biostatistics Data
 
Statistical inference
Statistical inferenceStatistical inference
Statistical inference
 
Introduction to statistics...ppt rahul
Introduction to statistics...ppt rahulIntroduction to statistics...ppt rahul
Introduction to statistics...ppt rahul
 
Data
DataData
Data
 
Statistics for biology
Statistics for biologyStatistics for biology
Statistics for biology
 
Statistics "Descriptive & Inferential"
Statistics "Descriptive & Inferential"Statistics "Descriptive & Inferential"
Statistics "Descriptive & Inferential"
 
An introduction to spss
An introduction to spssAn introduction to spss
An introduction to spss
 
2. measures of dis[persion
2. measures of dis[persion2. measures of dis[persion
2. measures of dis[persion
 
Chi squared test
Chi squared testChi squared test
Chi squared test
 
Scales of measurement
Scales of measurementScales of measurement
Scales of measurement
 
Descriptive statistics
Descriptive statisticsDescriptive statistics
Descriptive statistics
 

Ähnlich wie Biology statistics made_simple_using_excel

Use of Excel in Statistics: Problem Solving Vs Problem Understanding
Use of Excel in Statistics: Problem Solving Vs Problem UnderstandingUse of Excel in Statistics: Problem Solving Vs Problem Understanding
Use of Excel in Statistics: Problem Solving Vs Problem UnderstandingIJITE
 
USE OF EXCEL IN STATISTICS: PROBLEM SOLVING VS PROBLEM UNDERSTANDING
USE OF EXCEL IN STATISTICS: PROBLEM SOLVING VS PROBLEM UNDERSTANDINGUSE OF EXCEL IN STATISTICS: PROBLEM SOLVING VS PROBLEM UNDERSTANDING
USE OF EXCEL IN STATISTICS: PROBLEM SOLVING VS PROBLEM UNDERSTANDINGIJITE
 
Use of Excel in Statistics: Problem Solving Vs Problem Understanding
Use of Excel in Statistics: Problem Solving Vs Problem Understanding Use of Excel in Statistics: Problem Solving Vs Problem Understanding
Use of Excel in Statistics: Problem Solving Vs Problem Understanding IJITE
 
EDUCATIONAL STATISTICS_Unit_I.ppt
EDUCATIONAL STATISTICS_Unit_I.pptEDUCATIONAL STATISTICS_Unit_I.ppt
EDUCATIONAL STATISTICS_Unit_I.pptSasi Kumar
 
Sheet1Number of Visits Per DayNumber of Status Changes Per WeekAge.docx
Sheet1Number of Visits Per DayNumber of Status Changes Per WeekAge.docxSheet1Number of Visits Per DayNumber of Status Changes Per WeekAge.docx
Sheet1Number of Visits Per DayNumber of Status Changes Per WeekAge.docxlesleyryder69361
 
Principal components
Principal componentsPrincipal components
Principal componentsHutami Endang
 
Correlations and Scatterplots MS Excel Lesson 2 Grade 8.ppt
Correlations and Scatterplots MS Excel Lesson 2 Grade 8.pptCorrelations and Scatterplots MS Excel Lesson 2 Grade 8.ppt
Correlations and Scatterplots MS Excel Lesson 2 Grade 8.pptJoshuaCasas7
 
Lab 4 excel basics
Lab 4 excel basicsLab 4 excel basics
Lab 4 excel basicsAnuja Lad
 
Use of-Excel
Use of-ExcelUse of-Excel
Use of-ExcelBrisbane
 
Geographical Skills
Geographical SkillsGeographical Skills
Geographical Skillsclemaitre
 
Business statistics (Basics)
Business statistics (Basics)Business statistics (Basics)
Business statistics (Basics)AhmedToheed3
 
Graphicalrepresntationofdatausingstatisticaltools2019_210902_105156.pdf
Graphicalrepresntationofdatausingstatisticaltools2019_210902_105156.pdfGraphicalrepresntationofdatausingstatisticaltools2019_210902_105156.pdf
Graphicalrepresntationofdatausingstatisticaltools2019_210902_105156.pdfHimakshi7
 
lecture 2 Centeral Tendency.pptx
lecture 2 Centeral Tendency.pptxlecture 2 Centeral Tendency.pptx
lecture 2 Centeral Tendency.pptxssuser378d7c
 

Ähnlich wie Biology statistics made_simple_using_excel (20)

Use of Excel in Statistics: Problem Solving Vs Problem Understanding
Use of Excel in Statistics: Problem Solving Vs Problem UnderstandingUse of Excel in Statistics: Problem Solving Vs Problem Understanding
Use of Excel in Statistics: Problem Solving Vs Problem Understanding
 
USE OF EXCEL IN STATISTICS: PROBLEM SOLVING VS PROBLEM UNDERSTANDING
USE OF EXCEL IN STATISTICS: PROBLEM SOLVING VS PROBLEM UNDERSTANDINGUSE OF EXCEL IN STATISTICS: PROBLEM SOLVING VS PROBLEM UNDERSTANDING
USE OF EXCEL IN STATISTICS: PROBLEM SOLVING VS PROBLEM UNDERSTANDING
 
Use of Excel in Statistics: Problem Solving Vs Problem Understanding
Use of Excel in Statistics: Problem Solving Vs Problem Understanding Use of Excel in Statistics: Problem Solving Vs Problem Understanding
Use of Excel in Statistics: Problem Solving Vs Problem Understanding
 
EDUCATIONAL STATISTICS_Unit_I.ppt
EDUCATIONAL STATISTICS_Unit_I.pptEDUCATIONAL STATISTICS_Unit_I.ppt
EDUCATIONAL STATISTICS_Unit_I.ppt
 
Sheet1Number of Visits Per DayNumber of Status Changes Per WeekAge.docx
Sheet1Number of Visits Per DayNumber of Status Changes Per WeekAge.docxSheet1Number of Visits Per DayNumber of Status Changes Per WeekAge.docx
Sheet1Number of Visits Per DayNumber of Status Changes Per WeekAge.docx
 
Principal components
Principal componentsPrincipal components
Principal components
 
Correlations and Scatterplots MS Excel Lesson 2 Grade 8.ppt
Correlations and Scatterplots MS Excel Lesson 2 Grade 8.pptCorrelations and Scatterplots MS Excel Lesson 2 Grade 8.ppt
Correlations and Scatterplots MS Excel Lesson 2 Grade 8.ppt
 
Lab 4 excel basics
Lab 4 excel basicsLab 4 excel basics
Lab 4 excel basics
 
Lab 4 excel basics
Lab 4 excel basicsLab 4 excel basics
Lab 4 excel basics
 
Use of-Excel
Use of-ExcelUse of-Excel
Use of-Excel
 
merge ppt.pptx
merge ppt.pptxmerge ppt.pptx
merge ppt.pptx
 
Statistics for ess
Statistics for essStatistics for ess
Statistics for ess
 
stats
statsstats
stats
 
Statistics
StatisticsStatistics
Statistics
 
Lab 4 Excel Basics.ppt
Lab 4 Excel Basics.pptLab 4 Excel Basics.ppt
Lab 4 Excel Basics.ppt
 
Lab 4 excel basics
Lab 4 excel basicsLab 4 excel basics
Lab 4 excel basics
 
Geographical Skills
Geographical SkillsGeographical Skills
Geographical Skills
 
Business statistics (Basics)
Business statistics (Basics)Business statistics (Basics)
Business statistics (Basics)
 
Graphicalrepresntationofdatausingstatisticaltools2019_210902_105156.pdf
Graphicalrepresntationofdatausingstatisticaltools2019_210902_105156.pdfGraphicalrepresntationofdatausingstatisticaltools2019_210902_105156.pdf
Graphicalrepresntationofdatausingstatisticaltools2019_210902_105156.pdf
 
lecture 2 Centeral Tendency.pptx
lecture 2 Centeral Tendency.pptxlecture 2 Centeral Tendency.pptx
lecture 2 Centeral Tendency.pptx
 

Mehr von haramaya university

Yesidetegnamastawesha 131015133004-phpapp02
Yesidetegnamastawesha 131015133004-phpapp02Yesidetegnamastawesha 131015133004-phpapp02
Yesidetegnamastawesha 131015133004-phpapp02haramaya university
 
Yeehadegchinqet 131015131752-phpapp01
Yeehadegchinqet 131015131752-phpapp01Yeehadegchinqet 131015131752-phpapp01
Yeehadegchinqet 131015131752-phpapp01haramaya university
 
Tesfayegebreabmannew2 131017153753-phpapp01
Tesfayegebreabmannew2 131017153753-phpapp01Tesfayegebreabmannew2 131017153753-phpapp01
Tesfayegebreabmannew2 131017153753-phpapp01haramaya university
 
Digitalstrategygivecamp 120506111603-phpapp02
Digitalstrategygivecamp 120506111603-phpapp02Digitalstrategygivecamp 120506111603-phpapp02
Digitalstrategygivecamp 120506111603-phpapp02haramaya university
 
Computerapplicationsnotesgrade6 120320153437-phpapp01
Computerapplicationsnotesgrade6 120320153437-phpapp01Computerapplicationsnotesgrade6 120320153437-phpapp01
Computerapplicationsnotesgrade6 120320153437-phpapp01haramaya university
 
Stressmanagement 121030071806-phpapp01
Stressmanagement 121030071806-phpapp01Stressmanagement 121030071806-phpapp01
Stressmanagement 121030071806-phpapp01haramaya university
 
Pastoral growth study policy retrospective paper 1 final p1
Pastoral growth study policy retrospective paper 1 final p1Pastoral growth study policy retrospective paper 1 final p1
Pastoral growth study policy retrospective paper 1 final p1haramaya university
 
Nber working paper series explaining recent trends in the u
Nber working paper series explaining recent trends in the uNber working paper series explaining recent trends in the u
Nber working paper series explaining recent trends in the uharamaya university
 
Methods of multivariate analysis
Methods of multivariate analysisMethods of multivariate analysis
Methods of multivariate analysisharamaya university
 
Kearney levine-trends-nov2013-new nber
Kearney levine-trends-nov2013-new nberKearney levine-trends-nov2013-new nber
Kearney levine-trends-nov2013-new nberharamaya university
 

Mehr von haramaya university (20)

Chem 10 night
Chem 10 nightChem 10 night
Chem 10 night
 
Yesidetegnamastawesha 131015133004-phpapp02
Yesidetegnamastawesha 131015133004-phpapp02Yesidetegnamastawesha 131015133004-phpapp02
Yesidetegnamastawesha 131015133004-phpapp02
 
Yeehadegchinqet 131015131752-phpapp01
Yeehadegchinqet 131015131752-phpapp01Yeehadegchinqet 131015131752-phpapp01
Yeehadegchinqet 131015131752-phpapp01
 
Tesfayegebreabmannew2 131017153753-phpapp01
Tesfayegebreabmannew2 131017153753-phpapp01Tesfayegebreabmannew2 131017153753-phpapp01
Tesfayegebreabmannew2 131017153753-phpapp01
 
Semayawi1 131015152400-phpapp01
Semayawi1 131015152400-phpapp01Semayawi1 131015152400-phpapp01
Semayawi1 131015152400-phpapp01
 
Digitalstrategygivecamp 120506111603-phpapp02
Digitalstrategygivecamp 120506111603-phpapp02Digitalstrategygivecamp 120506111603-phpapp02
Digitalstrategygivecamp 120506111603-phpapp02
 
Computerapplicationsnotesgrade6 120320153437-phpapp01
Computerapplicationsnotesgrade6 120320153437-phpapp01Computerapplicationsnotesgrade6 120320153437-phpapp01
Computerapplicationsnotesgrade6 120320153437-phpapp01
 
Stressmanagement 121030071806-phpapp01
Stressmanagement 121030071806-phpapp01Stressmanagement 121030071806-phpapp01
Stressmanagement 121030071806-phpapp01
 
Working 105 pdf d
Working 105  pdf dWorking 105  pdf d
Working 105 pdf d
 
What is econometrics
What is econometricsWhat is econometrics
What is econometrics
 
W17964
W17964W17964
W17964
 
Seefeld stats r_bio
Seefeld stats r_bioSeefeld stats r_bio
Seefeld stats r_bio
 
Report 339
Report 339Report 339
Report 339
 
Report 339 x
Report 339 xReport 339 x
Report 339 x
 
Pastoral growth study policy retrospective paper 1 final p1
Pastoral growth study policy retrospective paper 1 final p1Pastoral growth study policy retrospective paper 1 final p1
Pastoral growth study policy retrospective paper 1 final p1
 
No 105
No 105No 105
No 105
 
Nber working paper series explaining recent trends in the u
Nber working paper series explaining recent trends in the uNber working paper series explaining recent trends in the u
Nber working paper series explaining recent trends in the u
 
Name
NameName
Name
 
Methods of multivariate analysis
Methods of multivariate analysisMethods of multivariate analysis
Methods of multivariate analysis
 
Kearney levine-trends-nov2013-new nber
Kearney levine-trends-nov2013-new nberKearney levine-trends-nov2013-new nber
Kearney levine-trends-nov2013-new nber
 

Biology statistics made_simple_using_excel

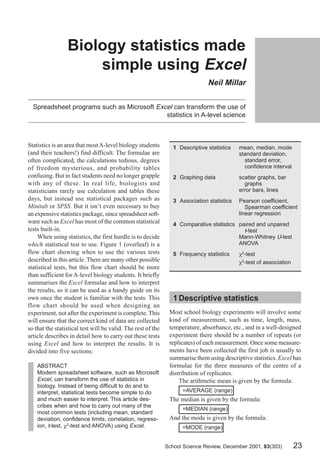
  • 1. School Science Review, December 2001, 83(303) 23 Millar Biology statistics made simple using Excel Biology statistics made simple using Excel Neil Millar Spreadsheet programs such as Microsoft Excel can transform the use of statistics in A-level science ABSTRACT Modern spreadsheet software, such as Microsoft Excel, can transform the use of statistics in biology. Instead of being difficult to do and to interpret, statistical tests become simple to do and much easier to interpret. This article des- cribes when and how to carry out many of the most common tests (including mean, standard deviation, confidence limits, correlation, regress- ion, t-test, χ2 -test and ANOVA) using Excel. Statistics is an area that mostA-level biology students (and their teachers!) find difficult. The formulae are often complicated, the calculations tedious, degrees of freedom mysterious, and probability tables confusing. But in fact students need no longer grapple with any of these. In real life, biologists and statisticians rarely use calculation and tables these days, but instead use statistical packages such as Minitab or SPSS. But it isn’t even necessary to buy an expensive statistics package, since spreadsheet soft- ware such as Excel has most of the common statistical tests built-in. When using statistics, the first hurdle is to decide which statistical test to use. Figure 1 (overleaf) is a flow chart showing when to use the various tests described in this article. There are many other possible statistical tests, but this flow chart should be more than sufficient for A-level biology students. It briefly summarises the Excel formulae and how to interpret the results, so it can be used as a handy guide on its own once the student is familiar with the tests. This flow chart should be used when designing an experiment, not after the experiment is complete. This will ensure that the correct kind of data are collected so that the statistical test will be valid. The rest of the article describes in detail how to carry out these tests using Excel and how to interpret the results. It is divided into five sections: 1 Descriptive statistics mean, median, mode standard deviation, standard error, confidence interval 2 Graphing data scatter graphs, bar graphs error bars, lines 3 Association statistics Pearson coefficient, Spearman coefficient linear regression 4 Comparative statistics paired and unpaired t-test Mann-Whitney U-test ANOVA 5 Frequency statistics χ2 -test χ2 -test of association 1Descriptive statistics Most school biology experiments will involve some kind of measurement, such as time, length, mass, temperature, absorbance, etc., and in a well-designed experiment there should be a number of repeats (or replicates) of each measurement. Once some measure- ments have been collected the first job is usually to summarise them using descriptive statistics. Excel has formulae for the three measures of the centre of a distribution of replicates. The arithmetic mean is given by the formula: =AVERAGE (range) The median is given by the formula: =MEDIAN (range) And the mode is given by the formula: =MODE (range)
  • 2. Biology statistics made simple using Excel Millar 24 School Science Review, December 2001, 83(303) Figure 1 Flow chart used to choose an appropriate statistical test.
  • 3. School Science Review, December 2001, 83(303) 25 Millar Biology statistics made simple using Excel These formulae are illustrated in Figure 2. In many cases the quantities measured in biology will show a normal distribution, and so the mean is the most appro- priate statistic to use. It is also the one students are most likely to know already, and to be able to do by hand. The median and mode are less likely to be needed for experimental data, but someA-level speci- fications require a knowledge of them. It is unfortunate that Excel uses the word ‘average’ for ‘mean’, as some textbooks use average as a general term to refer to any measure of the centre of a distribution. A statistician will tell you that there is no point in calculating a mean without also calculating some measure of the variation or spread of the measure- ments, but students often don’t bother because of the difficulty of the calculations. Figure 2 shows five different measures of the spread, and shows how easy they are to calculate using Excel. ■ The range is given by the Excel formula: =MAX (range) - MIN (range) This is the simplest, but least useful. ■ The variance is given by the Excel formula: =VAR (range) This is used in calculations, but has little use as a descriptive statistic since it is not in the same units as the measurements. ■ The standard deviation (SD) is given by the Excel formula: =STDEV (range) This is common (since it is fairly easy to calculate by hand) and it gives a good indication of the variability of a set of data. However it is not the best statistic to use when comparing different sets of data, especially if the data sets are different sizes. ■ The standard error of the mean (SE) is given by the formula: =STDEV (range) / SQRT (COUNT (range)) This gives an indication of the confidence of the mean, and is often used as an error measurement simply because it is small rather than for any good statistical reason. ■ The 95% confidence interval (CI) is given by the formula: =CONFIDENCE(0.05,STDEV(range),COUNT(range)) Figure 2 Eight descriptive statistics. The MODE formula returns #N/A because no values are duplicated, so there is no modal value in these data. Note that Excel will always return the results of a calculation to about 8 decimal places. This is usually meaningless, and cells with calculated results should always be formatted to a more sensible precision (Format menu > Cells > Number tab > Number).
  • 4. Biology statistics made simple using Excel Millar 26 School Science Review, December 2001, 83(303) The value of 0.05 is used to give the 95% (0.95) confidence interval, and different values can be used for different levels of confidence, such as 0.01 for a 99% confidence interval.There is a 95% probability that the true mean lies within ± CI from the measured mean, and the upper and lower values of this range are called the confidence limits. Of these five, the 95% confidence interval is the most useful measure of the dispersion of data around the mean, and also the easiest to understand. It is not as well known as the others because it is so difficult to calculate, but using Excel it is no more difficult to calculate than the others. It is the preferred statistic to use when comparing different sets of data, and when drawing error bars on a graph. Students should always be encouraged to calculate a CI whenever they calculate a mean, and to refer to it whenever they evaluate their data. If the CI is small compared to the mean then the mean is reliable, but if the CI is large compared to the mean then the mean is unreliable. In Figure 2 the two sets have the same means but different spreads, and the statistics all show that the data in groupAhave a smaller spread and are therefore more reliable than those in group B. 2 Graphing data Graphs are an important part of data analysis and are closely connected to statistics, since the choice of graph is connected to the choice of statistical test, as the flow chart in Figure 1 shows. If you are investigat- ing an association between two variables, then you should plot a scatter graph; if you are comparing different sets of data, you should plot a bar graph; and if you are collecting frequency data, then you may plot a bar or pie chart, or a graph may not be appropriate. In Excel it is quite easy to plot these graphs, as well as many other types. First enter the data into columns or rows, and select them. Then click on the chart wizard (or Insert menu > Chart). This wizard has four steps: 1 In Graph Type, select the type you want and press Next. Choose ‘Column’ for bar charts or ‘XY (Scatter)’ for line and scatter graphs. Do not choose ‘Line’, which plots the data against row number. This is a very common mistake. 2 In Source Data, if the sample graph looks about right, then just press Next. If it looks wrong, you can correct it by clicking on the series tab, and then the red arrow at the end of the X Values box. Then highlight the cells containing the X data in the spreadsheet and press the red arrow again. Repeat for the Y Values box. 3 In Chart Options, the most important tasks are to type in suitable titles for the graph and the two axes. You can also turn off gridlines and legend, which makes the chart look better. 4 In Graph Location, just press Finish. This puts the chart beside the data so you can see both. Excel graphs are quite flexible and almost everything about them can be changed. Just double-click (or sometimes right-click) on the part you want to change. For example, you can move and re-shape the graph; change the background colour (white is usually best); change the shape and size of the markers (points); join the points; change the axes scales and tick marks; or add a trend line or error bars. Students should be discouraged from using 3D or shadow effects, which only serve to obscure the graph trend. It is worth taking some time to get the graph right, because you can use an existing graph as a template. Simply type the new data in place of the existing data, and the graph automatically changes. The sheet can then be saved as a new file. Error bars If you are plotting averages on a scatter or bar graph, then error bars are a very good way to illustrate the confidence of the data on the graph. Again, they are awkward to do by hand, but quite easy with Excel, and students should be encouraged to use error bars as a matter of course. Error bars usually show ± CI, although you could also plot them from SD or SE. Double-click on any data point or bar to get the Format Data Series dialogue box, and choose theYError Bars tab. Click in the Custom + box, and highlight the range of cells containing your confidence intervals. Repeat for the Custom – box, and then press OK. Error bars are useful for the evaluation part of student investigations. Small error bars suggest reliable data; large error bars suggest dubious data. A line of best fit should pass through the error bars, and a good question to address in an evaluation is ‘Could I draw a different line through my error bars?’ (in other words, do the data support a different conclusion?). Figure 3 shows a graph where a curve has been drawn, but in fact a straight line would also pass through the error bars, so a linear relation is also supported by the data.
  • 5. School Science Review, December 2001, 83(303) 27 Millar Biology statistics made simple using Excel Lines Scatter graphs often have lines, which either join the data points or form a smooth ‘line of best fit’ (or trend line) through the middle of the points. The choice depends on the circumstances, but generally, if there should be a continuous smooth relation between X and Y, then a trend line is appropriate; otherwise the points should be joined by straight lines. Trend lines are best drawn on the graph by hand, unless you want a linear regression line (see below). To join the points with lines: double-click on any data point, select the Patterns tab and click on Line-Automatic. It is not usually a good idea to have Excel draw a curved or smoothed line, as these curves can be highly misleading and can create spurious peaks and troughs for which there is no evidence. 3 Association statistics A common task in data analysis is to investigate an association between two variables. This can be a correlation to see if two variables vary together, or a regression to see how one variable affects another. We’ll see how to do each of these in Excel. In both cases a scatter graph should be plotted first. Correlation A correlation tells us whether the two variables vary together, i.e. as one goes up the other goes up (or goes down). The most common tests for correlation are the Pearson product-moment correlation coefficient (r) for normally-distributed (parametric) data, and the Spearman rank-order correlation coefficient (rs ) for data that are not normally distributed (non-parametric data). Both vary from +1 (perfect correlation) through 0 (no correlation) to –1 (perfect negative correlation). In Excel the Pearson coefficient can be found by two alternative formulae: =CORREL (range 1, range 2) or =PEARSON (range 1, range 2) There is no direct formula for the Spearman coefficient, but it can be calculated by first making two new columns for the ranks of the original data. For each of the two variables the largest value is given a rank of 1, the next largest a rank of 2, and so on. This can most simply be done by hand, or for large data sets, by using Excel’s =RANK command. The Spearman coefficient is then simply the Pearson coefficient calculated on the rank data, ignoring the original data. Both coefficients are demonstrated in Figure 4. This shows measurements on the size of breeding pairs of penguins to see if there is a correlation between the sizes of the two sexes. The Spearman coefficient rs (0.77) is more conservative than the Pearson coefficient r (0.88), but both show a strong positive correlation. Linear regression Regression is used when we have reason to believe that changes in one variable cause the changes in the other. A correlation is not evidence for a causal relationship, but very often we are aware of a causal relationship and we design an experiment to Figure 3 A scatter graph showing error bars. A curved line of best fit has been drawn through the data points, but in fact a straight line can also be drawn within the error bars, so a linear relationship is not ruled out.
  • 6. Biology statistics made simple using Excel Millar 28 School Science Review, December 2001, 83(303) investigate it further. The simplest kind of causal relationship is a straight-line relationship, and this can be analysed using linear regression. This fits a straight line to the data using a least squares method, and gives the values of the slope and intercept that define the line (m and c in the equation y = mx + c). There are several different ways of calculating the slope and intercept of a linear regression line in Excel, but the simplest is to plot a scatter graph and use the ‘Trendline’ feature of the graph. Right-click on any data point on the graph, select Add Trendline, and choose Linear. Click on the Options tab, and select Display equation on chart. You can also choose to set the intercept to be zero (or some other value), and to display r2 (the square of the Pearson correlation coefficient). The full equation with the slope and intercept values is now shown on the chart. This is demonstrated in Figure 5, which shows data obtained from counting a yeast cell suspension in a haemo- cytometer and in a colorimeter. We expect a linear causal relationship between cell density and turbidity, so this is a good occasion to use regression, and we can use the equation to predict the cell count for a given absorbance. 4 Comparative statistics Another common task in data analysis is to compare two or more sets of data to determine whether they are basically the same (i.e. they could come from the same population) or one set is significantly different from the others. To start with, it is good practice to calculate the means and CIs for the different groups and plot a bar chart with the CIs represented as error bars. This gives us a good visual idea of how different the groups are. It is sometimes thought that if the error bars don’t overlap, then there must be a significant difference between the data, but this is not necessarily true, and a statistical test of comparison is needed to test for significant differences. The end result of such tests is a probability (P) that the ‘null hypothesis’ (which always states that there is no difference between the sets of data) is true. In biology we usually accept differences as being significant if P is less than 5%, so if P < 5% then we can say that there is a significant difference between the sets of data (i.e. reject the null hypothesis). If P > 5% then we can say that there is no significant difference between the sets of data (i.e. accept the null hypothesis). Figure 4 Two types of correlation coefficient. The data are the lengths of a leg bone (in mm) in penguin mating pairs. The Pearson coefficient r can be calculated directly from the data, but the Spearman coefficient rs must be calculated from the ranks of the data. The ranks can either be entered by hand or calculated using Excel’s =RANK formula.
  • 7. School Science Review, December 2001, 83(303) 29 Millar Biology statistics made simple using Excel t-test The most common comparative statistical test is the t-test, which is used when there are just two sets of normally-distributed data to compare. In Excel this is performed by the formula =TTEST (range 1, range 2, tails, type) which returns P directly (not the t statistic itself, which is not reported and we don’t need). Tails can be 1 for a one-tailed test or 2 for a two-tailed test, but in biology we generally want the two-tailed test, which tests for differences regardless of sign. Type can either be 1 for paired data (when the two sets are from the same individuals) or 2 for unpaired data (where the sets are from different individuals), and both are common. Both kinds of t-test are demonstrated in Figure 6. In the unpaired test (type 2) the yield of potatoes in 10 plots treated with one fertiliser was compared to that in 10 plots treated with another fertiliser. Fertiliser B delivers a larger mean yield, but the t-test P shows that there is an 8% probability that these two sets are not really different. Since this is more than 5% we must conclude that fertiliser B is not significantly better than fertiliser A. In the paired test (type 1), the pulse rate of 8 individuals was measured before and after a large meal. The mean pulse rate is a little higher after the meal, and the t-test P shows that there is only a tiny 0.006% probability that the before and after data are the same. So the pulse rate does significantly increase after a meal. This demonstrates the value of a paired test: although the data are quite varied, with quite a high CI, the pulse rate increased in each individual leading to the high significance of the conclusion. Excel provides two more formulae involving the t-test. The formula =TDIST (t, dof, tails) can be used to replace a look-up table, since it returns the probability corresponding to the given t value and degrees of freedom. The formula =TINV (P, dof) does the reverse: it returns a t value corresponding to a given probability P. You shouldn’t normally need these formulae. Mann-Whitney U-Test The t-test requires that the data be continuous and normally distributed. Sometimes this is not possible, for example if the data are calculated rather than measured, or if the data are counted. In this case the Mann-Whitney U-test, which is the non-parametric equivalent of the t-test, should be used. Unfortunately Excel does not support this test. You could use Excel to calculate the U statistic, but you would still need probability tables to find the significance. Figure 5 Linear regression. The scatter graph has a trend line with the regression equation displayed. In this case the intercept was fixed at zero, which is appropriate for these data.
  • 8. Biology statistics made simple using Excel Millar 30 School Science Review, December 2001, 83(303) ANOVA The t-test is limited to comparing two sets of data, and to compare many groups at once you need analysis of variance (ANOVA). This is normally considered beyond the scope of a school biologist, since it is so difficult to calculate by hand, but in fact it is just as easy to perform with Excel as any other statistical test. Since it is so useful (it can even replace the t-test) there is no reason not to include ANOVA in the repertoire of A-level biologists. ANOVA is part of Excel’s Data Analysis Pack, which is part of normal Excel, but not always installed. (If there is no Data Analysis option on the Tools menu you need to run Excel set-up to install the ‘Analysis Toolpak add-in’.) Figure 6 Two kinds of t-test. Top: unpaired t-test (type 2). Bottom: paired t-test (type 1). The cells with the t-test probabilities have been formatted as a percentage (Format menu > cell > number tab > percentage). This automatically multiplies the value by 100 and adds the % sign. This can make probability values easier to read and understand.
  • 9. School Science Review, December 2001, 83(303) 31 Millar Biology statistics made simple using Excel From the Tools menu select Data Analysis and then ANOVA Single Factor. This brings up the ANOVA dialogue box, as shown in the example in Figure 7, which concerns the grain yield from three different varieties of wheat. Enter the Input Range by clicking in the box and then selecting the range of cells containing the data, including the headings. Check that the columns/rows choice is correct (this example is in three columns), and click in Labels in First Row if you have included these. The column headings will appear in the results table. Leave Alpha at 0.05 (for the usual 5% significance level), then click in the Figure 7 Comparing three sets of data using ANOVA. The most important value is the P value, which has been formatted as a percentage (cell F18, indicated by the arrow). The bar graph was drawn using the average values (cells D12:D14) for the bars and the variance values (cells E12:E14) for the error bars.
  • 10. Biology statistics made simple using Excel Millar 32 School Science Review, December 2001, 83(303) Output Range box and click on a free cell on the worksheet, which will become the top left cell of the 8 × 15-cell results table. Finally press OK. The output is a large data table, and you may need to adjust the column widths to read it all. The most important cell is the P value, which as usual is the probability that the null hypothesis (that there is no difference between any of the data sets) is true. This is the same as a t-test probability, and in fact if you tryANOVAwith just two data sets, it returns the same P as a t-test. If P > 5% then there is no significant difference between any of the data sets (i.e. the null hypothesis is true), but if P < 5% then at least one of the groups is significantly different from the others. In Figure 7 P is 0.14%, which is less than 5%, so there is a significant difference somewhere. The problem now is to identify where the difference lies. The correct way to do this is to use further post hoc tests, but unfortunately Excel doesn’t support any of these, which is an unfortunate limitation of ANOVA in Excel. However, in many cases the different group(s) can be identified from the summary table and the bar graph (if drawn). In Figure 7, for example, varieties 2 and 3 are very similar, but variety 1 is obviously different. So the conclusion would be that variety 1 has a significantly lower yield than varieties 2 and 3. 5 Statistics for frequency data χ2 -test The statistics so far have concerned measurement data. Sometimes in biology the results are not measure- ments but counts (or frequencies) of things, such as counts of different phenotypes in genetics experiments or counts of species in different habitats. With frequency data you can’t usually calculate means, or SD, or do a t-test. Instead you do a ‘chi-squared’ (χ2 ) test, which is used to compare frequency data in different categories with some expected data. The Excel formula is =CHITEST (observed range, expected range) and it returns the probability P that the null hypothesis (which states that there is no difference between the observed and expected frequencies) is true. There are Figure 8 Two kinds of χ2 -test. Top: expected values from theory, calculated assuming 3/4 of the flowers should be red and 1/4 should be white. Bottom: expected values assuming equal distribution. Again the cells with the χ2 -test probability have been formatted as a percentage.
  • 11. School Science Review, December 2001, 83(303) 33 Millar Biology statistics made simple using Excel three different uses of the χ2 -test depending on how the expected data are calculated. Sometimes the expected data can be calculated from a quantitative theory, in which case you are testing whether your observed data agree with the theory (if P < 5% then the data do not agree with the theory, and if P > 5% then the data do agree with the theory). There aren’t many examples of quantitative theories in biology, and the most common example is a genetic cross, where Mendel’s laws can be used to predict frequencies of different phenotypes. An example of this is shown in Figure 8 (top), where we expect the results of a genetic cross to be a 3:1 ratio of red to white flowers. Simple Excel formulae can be used to calculate the expected counts given the total number of observations. The χ2 P is 53%, which is much greater than 5%, so the results do indeed support Mendel’s law. Incidentally a very high P (>80%) is suspicious, as it means that the results are just too good to be true. This suggests some bias in the experiment, whether deliberate or accidental. On other occasions the expected data are calcul- ated by assuming that the counts in all the categories should be the same, in which case you are testing whether there is a difference between the sets (if P < 5% then the sets of data are significantly different from each other, and if P > 5% then there is no significant difference between the sets). This version is a bit like the t-test, but it is used with frequency data and can compare more than two categories. An example of this is also shown in Figure 8 (bottom), where the sex of children born in a hospital over a period of time is compared. There are more boys than girls, but is the difference significant? The expected values are calculated by assuming there should be equal numbers, and the χ2 P of 6.4% is greater than 5%, so there is no significant difference between boys and girls. χ2 -test of association The final use of the χ2 -test is to investigate associations between frequency data in two separate groups. This is called the χ2 -test of association (or χ2 contingency table), and the expected data are calculated by assuming that the counts in one group are not affected by the counts in the other group. In other words you are testing whether there is an association between the two groups, and if P < 5% then there is a significant association between the two groups, while if P > 5% then the two groups are independent. Each group can have counts in two or more categories, and the observed frequency data are set out in a table, called a contingency table. A copy of this table is then made for the expected data, which are calculated for each cell from the corresponding totals of the observed data using the formula: Figure 9 shows an example of this in which the flow rate of a stream (the two categories fast/slow) is com- pared to the type of stream bed (the four categories weed-choked/some weeds/shingle/silt) at 50 different sites to see if there is an association between them. Figure 9 The χ2 -test for association. The observed data were entered in the upper table, and the expected data in the lower table were calculated from the sums for each column and row. Only some examples of the formulae used are shown. E = ____________________column total × row total grand total
  • 12. Biology statistics made simple using Excel Millar 34 School Science Review, December 2001, 83(303) The χ2 P of 1.1% is less than 5%, so there is a signific- ant association between flow rate and stream bed. Excel provides two more formulae involving the χ2 - test. The formula =CHIDIST (χ2 , dof) can be used to replace a look-up table, since it returns the probability corresponding to the given χ2 value and degrees of freedom. The formula =CHIINV (P, dof) does the reverse: it returns a χ2 value corresponding to a given probability P.You shouldn’t normally need these formulae. Closing remarks In the new GCE biology A-level, simple descriptive statistics and graphs are required at AS level, while some of the association, comparative and frequency statistics are required at A2 level. A statistical test is also required as part of the A2 coursework, and the exam boards AQA, OCR and Edexcel have informed me that it is quite acceptable for these tests to be carried out using a computer program such as Excel. The important skills are to choose the appropriate test, apply it correctly, and interpret the result correctly. Many of these statistical tests may also be required by students studying sports science and psychology at A-level. Note however that in some cases a know- ledge of the equations and the use of probability tables may be required in a written exam, so students may still be stuck with these for now. Further reading These are a few recently published books for further information. Cadogan, A. and Sutton, R. (1994) Maths for Advanced Biology. London: Nelson. Dretzke, B. J. (2001) Statistics with Excel, 2nd ed. New York: Prentice Hall. Dytham, C. (1999) Choosing and using statistics. A biologist’s guide. Oxford: Blackwell Science. Ennos, R. (2000) Statistical and data handling skills in biology. New York: Prentice Hall. Morgan, L. A. and Triola, M. F. (2001) Elementary statistics using Excel. London: Addison Wesley Longman. An Excel file containing all the examples in this article, together with statistics worksheets aimed at A-level biology students, can be downloaded from the Biology4all website (www.biology4all.com). Select Teachers > Resource library > Statistics. This site is run by Dr Peter Robinson at the University of Central Lancashire and contains a large number of resources for biology teachers and students in secondary and further education. Neil Millar is Head of Biology at Heckmondwike Grammar School, High Street, Heckmondwike, WH16 0AH. E-mail: nmillar@cwcom.net