79088 a4 girls_low_birth_weight_april09
•
1 gefällt mir•884 views

growth chart girls_low_birth_weight_april09

Empfohlen
Weitere ähnliche Inhalte
Andere mochten auch
Andere mochten auch (10)
Ähnlich wie 79088 a4 girls_low_birth_weight_april09
Ähnlich wie 79088 a4 girls_low_birth_weight_april09 (20)
Kürzlich hochgeladen
Kürzlich hochgeladen (20)
79088 a4 girls_low_birth_weight_april09
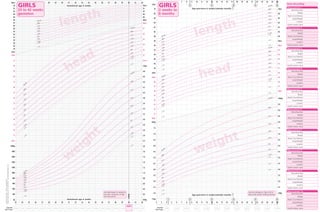
- 1. head length weight D/M D/M D/M D/M D/M D/M D/M D/M D/M D/M D/M D/MExpected date at age 3 4 5 6 7 8 9 10 11 12 13 14 15 16 17 18 19 20 21 22 23 24 25 72cm 70 68 66 64 62 60 58 56 54 52 50 48 46 44 42cm 39cm 38 37 36 35 34 33 32 31 30cm 8.0kg 7.5 7.0 6.5 6.0 5.5 5.0 4.5 4.0 3.5 3.0 2.5 2.0 1.5kg 70cm 68 66 64 62 60 58 56cm 46cm 45 44 43 42 41 40 39 38 37 36cm 10.0kg 9.5 9.0 8.5 8.0 7.5 7.0 6.5 6.0 5.5 5.0 4.5 4.0 3.5 3.0 2.5 2.0kg 1 2 3 4 Age post-term in weeks/calendar months GIRLS 2 weeks to 6 months 99.6th 98th 91st 75th 50th 25th 9th 2nd 0.4th 99.6th 98th 91st 75th 50th 25th 9th 2nd 0.4th 99.6th 98th 91st 75th 50th 25th 9th 2nd 0.4th 98th 91st 75th 50th 25th 9th 2nd 0.4th 99.6th 98th 91st 75th 50th 25th 9th 2nd 0.4th 99.6th 98th 91st 75th 50th 25th 9th 2nd 0.4th -3 SD -4 SD -5 SD -3 SD -4 SD -5 SD -3 SD -4 SD -5 SD -3 SD -4 SD -5 SD -3 SD -4 SD -5 SD -3 SD -4 SD -5 SD 32 4 5 7 8 9 10 11 12 13 14 15 16 17 18 19 20 21 22 23 24 25 99.6th Age post-term in weeks/calendar months 5 w eight head length 56cm 54 52 50 48 46 44 42 40 38 36 34 32 30 28 26 24 22cm 32cm 31 30 29 28 27 26 25 24 23 22 21 20 19 18 17 16cm 2000g 1800 1600 1400 1200 1000 800 600 400 200 0g 54cm 52 50 48 46 44cm 38cm 37 36 35 34 33 32 31cm 5.0kg 4.8 4.6 4.4 4.2 4.0 3.8 3.6 3.4 3.2 3.0 2.8 2.6 2.4 2.2 2.0 1.8 1.6 1.4 1.2 1.0 0.8 0.6 0.4 0.2 0.0kg D/M D/M D/M D/M D/M D/M D/M D/M D/M D/M D/M D/M D/M D/M D/M D/M D/M D/M D/M 24 28 29 30 31 32 33 34 35 36 37 38 39 41 Expected date at age TERM 40 Gestational age in weeks Gestational age in weeks 98th 91st 75th 50th 25th 9th 2nd 0.4th -3 SD -4 SD 0.4th 2nd 9th 25th 50th 75th 91st 98th 99.6th 99.6th 98th 91st 75th 50th 25th 9th 2nd 0.4th -3 SD -4 SD -3 SD -4 SD 99.6th 99.6th 98th 91st 75th 50th 25th 9th 2nd 0.4th -3 SD -4 SD 99.6th 98th 91st 75th 50th 25th 9th 2nd 0.4th -3 SD -4 SD EDD D/M Data Recording Recording Date Weight Head Circumference Length/Height Location Health worker name Measurement 1 Recording Date Weight Head Circumference Length/Height Location Health worker name Measurement 2 Recording Date Weight Head Circumference Length/Height Location Health worker name Measurement 4 Recording Date Weight Head Circumference Length/Height Location Health worker name Measurement 6 Recording Date Weight Head Circumference Length/Height Location Health worker name Measurement 8 Recording Date Weight Head Circumference Length/Height Location Health worker name Measurement 10 Recording Date Weight Head Circumference Length/Height Location Health worker name Measurement 3 Recording Date Weight Head Circumference Length/Height Location Health worker name Measurement 5 Recording Date Weight Head Circumference Length/Height Location Health worker name Measurement 7 Recording Date Weight Head Circumference Length/Height Location Health worker name Measurement 9 Use date boxes for speedy & accurate calculation of age: see instructions. Use the calendar on flap to fill in date boxes before starting plotting. GIRLS 23 to 42 weeks gestation 2 2 6 6 2 6 6 42 24 25 26 27 28 29 30 31 32 33 34 35 36 37 38 39 4140 4223 UK-WHOChart2009©DHCopyright2009 HarlowPrintingLimitedTel:01914554286www.healthforallchildren.co.uk
- 2. head length GIRLS UK–WHO Low Birthweight Growth Chart Royal College of Paediatrics and Child Health D/M/Y Expected date at age D/M D/M D/M D/M D/M D/M D/M D/M D/M D/M D/M D/M D/M D/M D/M D/M D/M D/M Please place sticker (if available) otherwise write in space provided. Name: ____________________________________________ NHS/CHI No: Hospital No: Date of Birth: EDD: Gestation: __________weeks __________days New users need to be taught how to use this chart. A fact sheet and powerpoint can be downloaded free from www.growthcharts.rcpch.ac.uk Plotting instructions From birth until 2 weeks after the expected date of delivery (EDD) plot measurements on the 23-42 weeks gestation chart. From EDD plus 2 weeks (42 weeks gestation) plot measurements on the 2 weeks to 6 months chart. Gestational correction is always required when plotting babies born preterm (before 37 completed weeks of gestation). Do not apply any gestational correction for term babies (37-42 completed weeks of gestation). If desired the chart may also be used to look up relative size for gestation but always plot birth data for term babies at term (40 weeks). Calculating age and gestational age from dates is difficult and mistakes are common. Although the chart can be plotted in the conventional way, this chart provides date boxes which will allow you to move directly from dates to gestational age and reduce the risk of error. To do this effectively, when first used the chart needs to be prepared as below. Use date boxes for speedy and accurate calculation of age. For preterm infants 1. If expected date of delivery (EDD) is not known, plot birthweight at the exact gestational age and then calculate the date of the next completed week (e.g. for date of birth (DOB) 24/2/09 at 27 weeks +3 days gestation, date at 28 weeks gestation will be 28/2/09). Then write in the date (day and month only) at each completed week of gestation, using the calendar (left) as a guide, until EDD is reached. 2. If EDD is known, write into the date box marked EDD then work backwards on the 23-42 weeks chart, writing in the date (day and month only) using the calendar (left) as a guide, for each completed week of gestation until birth gestation is reached. Use the calendar to fill in date boxes before starting plotting. For all infants After 42 weeks gestation use the 2 weeks to 6 months chart. Mark the expected date of each completed fortnight after EDD (or DOB for term infants) in the boxes at the bottom of the chart, using the calendar (left) as a guide, and use these to identify the gestationally corrected age. Date boxes from 6 months are per calendar month. On the 6 months to 2 years chart the date boxes are per calendar month (4.33 weeks). These dates can be calculated using the day of the EDD (or DOB for a term infant). If a child’s EDD was 23/1/10 then mark 23/7/10 in the 6 month box, 23/8 in the 7 month box, 23/9 in the 8 month box, etc. Which children is this chart suitable for? This chart has been designed for plotting growth measurements of preterm and/or low birthweight infants from birth to the age of 2 years, after which the UK-WHO 0-4 years charts can be used. For healthy preterm babies born at or after 32 weeks gestation the UK-WHO 0-4 years charts can be used from birth, unless there is need for detailed growth assessment. The chart is also suitable for term neonates or young infants requiring close monitoring. A specialist growth chart for low birthweight The special features of this chart include: • A ‘date box’ system to assist accurate calculation of gestational age • Large scale for detailed monitoring • Low reading (SD) lines to allow assessment of very small infants The three charts display data from two sources: 1. 23-42 weeks gestation. This chart is based on reanalysed UK1990 data and illustrates the size at birth of UK infants born at 23-42 weeks gestation around 1990 1 . The 23-42 weeks gestation chart does not describe how preterm infants grow after birth because it shows only birth measurements of infants born at different gestational ages. The weight of many babies born before 32 weeks, particularly the sickest and most immature, may fall by two centile spaces in the early days. 2. 2 weeks to 6 months corrected age and 6 months to 2 years corrected age charts. These charts are derived from the UK-WHO 0-4 years growth charts and use World Health Organization (WHO) data on healthy, non-deprived breastfed children of mothers who did not smoke 2 . These charts do not reflect the usual growth of the preterm infant population. However individual infants who have remained well should follow the trajectory indicated by the centile lines at their corrected age. For babies born at or after 32 weeks gestation, correction should stop at 1 year and this change should be clearly marked. After the age of 2 years all gestational correction should stop and plotting should be on the UK-WHO 0-4 years chart. Measuring Remove all clothing, including caps or bonnets, boots and nappy. Weight: Use class III electronic scales. Length: Use length board or mat. Do not use measuring tape. Head circumference: Use non-stretchable tape. Anyone who takes measurements should be suitably trained or supervised by someone competent. For further information and training materials see www.growthcharts.rcpch.ac.uk This is a new chart which is still being evaluated and any feedback will be appreciated, via the feedback form on www.growthcharts.rcpch.ac.uk References 1. Cole TJ, Freeman JV, Preece MA. British 1990 growth reference centiles for weight, height, body mass index and head circumference fitted by maximum penalized likelihood. Stat.Med. 1998;17:407-29. 2. WHO Child Growth Standards www.who.int/childgrowth/en © DH Copyright 2009 head length weight D/M D/M D/M D/M D/M D/M D/M D/M D/M D/M D/M D/MExpected date at age 3 4 5 6 7 8 9 10 11 12 13 14 15 16 17 18 19 20 21 22 23 24 25 72cm 70 68 66 64 62 60 58 56 54 52 50 48 46 44 42cm 39cm 38 37 36 35 34 33 32 31 30cm 8.0kg 7.5 7.0 6.5 6.0 5.5 5.0 4.5 4.0 3.5 3.0 2.5 2.0 1.5kg 70cm 68 66 64 62 60 58 56cm 46cm 45 44 43 42 41 40 39 38 37 36cm 10.0kg 9.5 9.0 8.5 8.0 7.5 7.0 6.5 6.0 5.5 5.0 4.5 4.0 3.5 3.0 2.5 2.0kg 1 2 3 4 Age post-term in weeks/calendar months GIRLS 2 weeks to 6 months 99.6th 98th 91st 75th 50th 25th 9th 2nd 0.4th 99.6th 98th 91st 75th 50th 25th 9th 2nd 0.4th 99.6th 98th 91st 75th 50th 25th 9th 2nd 0.4th 98th 91st 75th 50th 25th 9th 2nd 0.4th 99.6th 98th 91st 75th 50th 25th 9th 2nd 0.4th 99.6th 98th 91st 75th 50th 25th 9th 2nd 0.4th -3 SD -4 SD -5 SD -3 SD -4 SD -5 SD -3 SD -4 SD -5 SD -3 SD -4 SD -5 SD -3 SD -4 SD -5 SD -3 SD -4 SD -5 SD 32 4 5 7 8 9 10 11 12 13 14 15 16 17 18 19 20 21 22 23 24 25 99.6th Age post-term in weeks/calendar months 5 w eight head length 56cm 54 52 50 48 46 44 42 40 38 36 34 32 30 28 26 24 22cm 32cm 31 30 29 28 27 26 25 24 23 22 21 20 19 18 17 16cm 2000g 1800 1600 1400 1200 1000 800 600 400 200 0g 54cm 52 50 48 46 44 38cm 37 36 35 34 33 32 31cm 5.0kg 4.8 4.6 4.4 4.2 4.0 3.8 3.6 3.4 3.2 3.0 2.8 2.6 2.4 2.2 2.0 1.8 1.6 1.4 1.2 1.0 0.8 0.6 0.4 0.2 0.0kg D/M D/M D/M D/M D/M D/M D/M D/M D/M D/M D/M D/M D/M D/M D/M D/M D/M D/M D/M 24 28 29 30 31 32 33 34 35 36 37 38 39 41 Expected date at age TERM 40UK-WHOChart2009©DHCopyright2009 Gestational age in weeks Gestational age in weeks 98th 91st 75th 50th 25th 9th 2nd 0.4th -3 SD -4 SD 0.4th 2nd 9th 25th 50th 75th 91st 98th 99.6th 99.6th 98th 91st 75th 50th 25th 9th 2nd 0.4th -3 SD -4 SD -3 SD -4 SD 99.6th 99.6th 98th 91st 75th 50th 25th 9th 2nd 0.4th -3 SD -4 SD 99.6th 98th 91st 75th 50th 25th 9th 2nd 0.4th -3 SD -4 SD EDD D/M Data Recording Recording Date Weight Head Circumference Length/Height Location Health worker name Measurement 1 Recording Date Weight Head Circumference Length/Height Location Health worker name Measurement 2 Recording Date Weight Head Circumference Length/Height Location Health worker name Measurement 4 Recording Date Weight Head Circumference Length/Height Location Health worker name Measurement 6 Recording Date Weight Head Circumference Length/Height Location Health worker name Measurement 8 Recording Date Weight Head Circumference Length/Height Location Health worker name Measurement 10 Recording Date Weight Head Circumference Length/Height Location Health worker name Measurement 3 Recording Date Weight Head Circumference Length/Height Location Health worker name Measurement 5 Recording Date Weight Head Circumference Length/Height Location Health worker name Measurement 7 Recording Date Weight Head Circumference Length/Height Location Health worker name Measurement 9 Use date boxes for speedy & accurate calculation of age: see instructions. Use the calendar on flap to fill in date boxes before starting plotting. 23/516/59/52/525/418/411/44/428/321/314/37/328/2 / birth < GIRLS 23 to 42 weeks gestation 2 2 6 6 2 6 6 42 24 25 26 27 28 29 30 31 32 33 34 35 36 37 38 39 4140 4223 weight 99.6th 98th 91st 75th 50th 25th 9th 2nd 0.4th 99.6th 98th 91st 75th 50th 25th 9th 2nd 0.4th 99.6th 98th 91st 75th 50th 25th 9th 2nd 0.4th 99.6th 98th 91st 75th 50th 25th 9th 2nd 0.4th 99.6th 98th 91st 75th 50th 25th 9th 2nd 0.4th -3 SD -4 SD -5 SD -3 SD -4 SD -5 SD -3 SD -4 SD -5 SD -3 SD -4 SD -5 SD -3 SD -4 SD -5 SD -3 SD -4 SD -5 SD 16 17 181110 99.6th 98th 91st 75th 50th 25th 9th 2nd 0.4th 96cm 94 92 90 88 86 84 82 80 78 76 74 72 70 68 66 64 62 60 58 56cm 46cm 45 44 43 42 41 40 39 38 37 36 35 34cm 13.0kg 12.5 12.0 11.5 11.0 10.5 10.0 9.5 9.0 8.5 8.0 7.5 7.0 6.5 6.0 5.5 5.0 4.5 4.0kg 94cm 92 90 88 86 84 82 80 78 76 74 72 70cm 53cm 52 51 50 49 48 47 46 45 44 43 42 41 40cm 16.0kg 15.5 15.0 14.5 14.0 13.5 13.0 12.5 12.0 11.5 11.0 10.5 10.0 9.5 9.0 8.5 8.0 7.5 7.0 6.5 6.0 5.5 5.0 4.5 4.0kgAge post-term in calendar months 12 13 14 15 19 20 21 22 23 GIRLS 6 months to 2 years Age post-term in calendar months 12 13 14 15 16 17 18 19 20 21 22 231110987 Instructions Find the expected date of delivery (EDD) on the calendar and work upwards in the same column to find the weekly dates needed for the preterm date boxes until birth gestation is reached. For expected date per fortnight on the 2 weeks to 6 months chart, work downwards in the same column from EDD (or DOB for term infants). In a leap year: working downwards: move one column to the left at the end of February; working upwards: move one column to the right as you move from March to February. Working upwards, when you pass January, start again at the bottom of the calendar, one column to the right ³ Once you reach the end of the year (working downwards) start again at the top, one column to the left 1 2 3 4 5 6 7 8 9 10 11 12 13 14 15 16 17 18 19 20 21 22 23 24 25 26 27 28 29 30 31 32 33 34 35 36 37 38 39 40 41 42 43 44 45 46 47 48 49 50 51 52 Week Month DecemberNovemberOctoberSeptemberAugustJulyJuneMayAprilMarchFebruaryJanuary 1 2 3 4 5 6 7 8 9 10 11 12 13 14 15 16 17 18 19 20 21 22 23 24 25 26 27 28 29 30 31 1 2 3 4 5 6 7 8 9 10 11 12 13 14 15 16 17 18 19 20 21 22 23 24 25 26 27 28 1 2 3 4 5 6 7 8 9 10 11 12 13 14 15 16 17 18 19 20 21 22 23 24 25 26 27 28 29 30 31 1 2 3 4 5 6 7 8 9 10 11 12 13 14 15 16 17 18 19 20 21 22 23 24 25 26 27 28 29 30 1 2 3 4 5 6 7 8 9 10 11 12 13 14 15 16 17 18 19 20 21 22 23 24 25 26 27 28 29 30 31 1 2 3 4 5 6 7 8 9 10 11 12 13 14 15 16 17 18 19 20 21 22 23 24 25 26 27 28 29 30 1 2 3 4 5 6 7 8 9 10 11 12 13 14 15 16 17 18 19 20 21 22 23 24 25 26 27 28 29 30 31 1 2 3 4 5 6 7 8 9 10 11 12 13 14 15 16 17 18 19 20 21 22 23 24 25 26 27 28 29 30 31 1 2 3 4 5 6 7 8 9 10 11 12 13 14 15 16 17 18 19 20 21 22 23 24 25 26 27 28 29 30 1 2 3 4 5 6 7 8 9 10 11 12 13 14 15 16 17 18 19 20 21 22 23 24 25 26 27 28 29 30 31 1 2 3 4 5 6 7 8 9 10 11 12 13 14 15 16 17 18 19 20 21 22 23 24 25 26 27 28 29 30 1 2 3 4 5 6 7 8 9 10 11 12 13 14 15 16 17 18 19 20 21 22 23 24 25 26 27 28 29 30 Date boxes on this page are per calendar month. To complete, use the EDD day. e.g. If EDD = 23/1/10, enter 23/7/10 at 6m, 23/8 at 7m, 23/9 at 8m, etc. ³ Day 6 24 24