ITS in Bahrain

Bahrain is developing an Intelligent Transportation System (ITS) to address traffic challenges. ITS uses information and communication technologies to improve mobility, reduce pollution, and increase safety with tight budgets. Bahrain faces increasing traffic volumes, with over 800,000 vehicle trips daily and vehicle registrations growing 10% annually. Congestion is a major issue, costing the economy millions annually in lost time and productivity. Bahrain's ITS strategy aims to enhance safety, reduce accidents, improve traffic flow, provide traveler information, and support efficient road network management through technologies like traffic monitoring and dynamic message signs. The goal is to increase average speeds by 40% and reduce accidents by 24% from 2014 levels.

Empfohlen
Empfohlen
Weitere ähnliche Inhalte
Was ist angesagt?
Was ist angesagt? (20)
Ähnlich wie ITS in Bahrain
Ähnlich wie ITS in Bahrain (20)
Mehr von Loay Ghazaleh MBA, BSc Civil Eng.
Mehr von Loay Ghazaleh MBA, BSc Civil Eng. (20)
Kürzlich hochgeladen
Kürzlich hochgeladen (20)
ITS in Bahrain
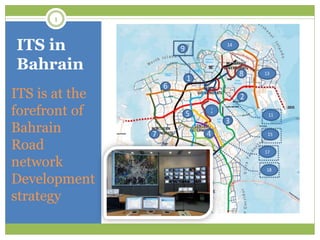
- 1. ITS in Bahrain ITS is at the forefront of Bahrain Road network Development strategy 1
- 2. Intelligent Information Systems (ITS) 2 Cities’ and urban regions are faced with challenges to Improve Mobility, Reduce Pollution and Increase Safety ,; All within Tight Budgets. ITS allows support travelers of all classes and to assist in road network management and performance by using systems for information, communication, and control, to provide improved safety and an enhanced traveling experience.
- 3. Contents ITS Scope & Management Why ITS in Bahrain (Traffic Overview) Bahrain ITS Developments Conclusion & Takeaways 3
- 4. ITS Scope & Management 4 National ITS Solutions National Multimodal ITS Plans Regional Transportation Goals / Objectives
- 5. In the US, average delay of passengers increased by 50% over the last ten years In European Union, road traffic accounts for one fifth of the total CO2 emissions. Worldwide, 1.2 million people killed and 50 million injured every year (over 3,000 deaths a day) In Bahrain, Personal income loss with congestion delays amounts to BD 21.7M per annum for all 19 major routes ** Also in Bahrain, The trend of Number of Fatal & Serious Accidents are off the Desired. At the end of 2014 the Desired Reduction was -24% but the actual was +11.5%! (Desired 411 accidents, Actual 601) Examples On the Need For ITS ** Source MOW = Peak Hour Traffic Volume [X] Congestion Loss Time (in Hours) per vehicle [X] 2.5 BD Hour [X] Number of Peak Hours per day [X] 225 working days per annum / 60
- 6. ITS Deployment Areas Road Safety Traffic Management Traveller Information Freight and logistics Public Transport “The application of information and communications technology (ICT) to the transport sector in the interests of safer, more sustainable & more efficient movement of goods & people”. “The integration of information and communications technology with transport infrastructure, vehicles and users” “IITS = Intelligent Infrastructure + Intelligent Vehicles + (People) ” 6 ITS is about Delivering Outcomes, not Implementing Technologies Intelligent Transport Systems (ITS) Most Common Definitions
- 7. Data collection for traffic management Wireless networks Systems & Applications (e.g. travel time, air quality, etc.) Congestion charging Electronic Toll charging 7 Features of Intelligent Infrastructure Enhance Safety Reduce Traffic Accidents Smoother Traffic Lower Congestion Reliable Journey Times Accurate Travel Information Improved Customer Satisfaction Informed Public Typical Strategic National ITS Programs Objectives
- 8. Why Safety: Provides consistent level of quality Reflective of cost- effectiveness Protection from legal claims Traffic Information has to be: Immediately available Universally understood Triggers intuitive reaction 8 Automatic Incident Detection Travel data dynamic message signs Variable speed limits Fog warning and dust storm warning Lane use management Automatic enforcement /police dispatch systems Real-time warning Spot speed enforcement Average speed enforcement Navigation systems Parking guidance Connected Vehicles technologies Emergency vehicle priority systems Animal and pedestrian presence detectors Examples of ITS Tools Employed to Improve Safety ITS & Safety
- 9. Factors Causing Crashes: Drivers Vehicles Roadway condition Environment Accident Causes: Poor visibility High traffic volume Inappropriate speed Missing attention Missing information Speed reduction is an indicator for drivers: Risk awareness Increased attention Adaption to traffic flow Safety Goals Adopted ITS Strategy Reduce Emergency Response Time Signal prioritization systems for emergency vehicles Improve Speed Limit Compliance Speed warning systems using detectors and electronic warning signs on approach to curves on highways Reduce Accidents Deployment of “Warning Signs - VMS” and speed cameras Reduce Secondary Crashes Eliminate crashes within coverage area as well as employing response routing system (Traffic Diversion) Reduce Incident Duration Coordinated Highway Action Response (Clearing of Accident Areas) 9 Safety Goals & ITS Strategies
- 10. ITS Stage Implementation in GCC ConstructNetwork Expand network Signaling OptimizeNetwork Add Control Rooms Operation Control Systems IncreasePublicOffering Invest in mass transit (incl. Bus Rapid Transit) Passenger Comfort Systems ManagePrivateDemand Traffic Charging systems Dynamic Pricing (off peak versus peak pricing) QatarBahrain UAE 10 Typical ITS Sub Programs Public Transport Program (e.g. Fleet Management Systems) National Transportation Management Centers (e.g. IT Connected Vehicle Program) Smart Zones Programs (e.g. Integrated Toll Payment Mechanism) Roadway Incident Management (e.g. ITS Parking Management Program)
- 11. Roles of ITS Contact Centers; Solve / reduce customer inconvenience as a result of the implementation of ITS initiatives. Demonstrate empathy and reduce customer, fear, distress, irritation or anger. Increase accessibility to useful , responsive and dynamic traffic service / travel information. Communicate route and diversion planning. Reduce traffic congestion by communicating relevant initiatives. Reasons Customers Contact ITS Centers; To make complaints about; Traffic and travel impacts Project construction travel delays Environmental impacts To make a payment of fines and license renewals To request help in an emergency. To provide / request general information. 11 ITS Contact centers are key to success full ITS initiatives. ITS Contact Centers Citizens may not empathize with Country’s long term ITS vision if they are experiencing inconvenience.
- 12. 12 ITS is Implemented in a step-by-step process ITS National Master Plan is needed to prioritize implementation of ITS to meet stated objectives. Adoption of ITS standards to ensure systems inter-operability (systems compatibility). Engaging all stakeholders to agree on respective roles. Managing the supply chain of business partners / products providers. Developing ITS procurement capability based on product fit for purpose, best technology and life cycle costs. Maintaining future operational needs of the whole transport network. Standards for IT Connected vehicles Integration Across ITS Systems Inter-operability Across ITS Systems Smart Cities (Linking to wider social objective) Social Media as Means to Change Traffic Behavior Potential of Smartphones for ITS Data Collection ITS for Older Demographic Current ITS Implementation Issues ITS Implementation Roadmap
- 13. 13 Why ITS in Bahrain (Traffic Overview)
- 14. Tendering ITS – (Typical RFP Technology Packages) Software systems Detection technologies Information provision technologies Parking and access control systems Traffic signals Payment systems Security and safety systems Telecommunications technology IT Connected vehicle program 14 ITS Life Cycles Cost Categories Research Cost of up-front evaluation study Cost of up-front proof of concept Acquisition Cost of Software Cost of Customization for business needs Cost of Integration (to current platform) Integration Cost of Migration (to current platform) Cost of Training Cost of Process and Best Practice change Usage Cost of Support services – in house Cost of Support services – contracted Cost of Maintenance and Upgrades Software scaling (user / transactions) Retirement Hardware and software exit costs Exit costs (system change, re-training) ITS costs incurred in Bahrain ITS program
- 15. 15 The General Directorate of Traffic accounted for 500,000 cars by the end of 2015 compared to 220,000 cars in 2002, a growth rate of about 10% per annum, which confirms that it will exceed the ceiling of 550 thousand cars by the end of 2016. The volume of traffic inside and outside the capital Manama reaches more than 800,000 vehicles a day With ITS (Scott System) it was possible to reduce the waiting time by 20% on King Faisal Avenue and Government Avenue and the intersection of the Al Fartha Avenue and Salmaniya Interchange. Needs for ITS Bahrain Congestions Examples
- 16. Vehicle Registration Versus Population Growth in Bahrain Average of 1 car for every two persons, 2000 cars registered every month
- 17. Congestion Index Index- 2013 Rank Route-7 Janabiya Highway/Wali Al Ahed Highway 3.52 19 Route-16 Ave-13/Ave23, Tubli 3.46 18 Route-15 Kuwait Avenue 2.84 17 Route-8 Khalifa Al Kabeer Highway 2.78 16 Route-11 Palace Avenue-Salmaniya Ave- Highway 35 2.77 15 Route-12 Sh. Zayed Highway/16th December Highway 2.56 14 Route-6 Budaiyah Highway 2.5 13 Route-9 Inner Manama Loop (Isa Al Kabeer Avenue) 2.32 12 Route-5 Sh. Salman Highway 2.32 11 Route-14 Aradous Highway 2.29 10 Route-18 Muharraq Ave/ Um Al Nassan Ave 2.19 9 Route-17 Amman Ave/Ave-77 2.18 8 Route-13 Dry Dock Highway 2.16 7 Route-4 Al Estiglal Highway 1.71 6 Route-1 King Faisal Highway/ Sh. Khalifa Bin Salman 1.65 5 Route-10 Zallaq Highway/Al Muaskar Highway 1.61 4 Route-3 Al Fateh Highway/SJAS Highway 1.46 3 Route-2 Sh. Isa Bin Salman Highway 1.46 2 Route-19 Sh. Hamad Avenue 1.09 1 17 Most Congested To Least Congested Roads in Bahrain Congestion Index is the ratio of travel times in peak hour and off-peak hour
- 18. 18 2013 - Traffic Volume / Day On Major Routes These are Average Daily Traffic , Not Peak / Off Peak Traffic Route Name Traffic / day Route-1 King Faisal Highway/ Sh. Khalifa Bin Salman 138,953 Route-2 Sh. Isa Bin Salman Highway 99,160 Route-3 Al Fateh Highway/SJAS Highway 83,662 Route-4 Al Estiglal Highway 71,210 Route-5 Sh. Salman Highway 73,682 Route-6 Budaiyah Highway 56,446 Route-7 Janabiya Highway/Wali Al Ahed Highway 43,020 Route-8 Khalifa Al Kabeer Highway 64,326 Route-9 Inner Manama Loop (Isa Al Kabeer Avenue) 37,058 Route-10 Zallaq Highway/Al Muaskar Highway 44,635 Route-11 Palace Avenue-Salmaniya Ave- Highway 35 50,340 Route-12 Sh. Zayed Highway/16th December Highway 39,836 Route-13 Dry Dock Highway 61,082 Route-14 Aradous Highway 18,456 Route-15 Kuwait Avenue 54,076 Route-16 Ave-13/Ave23, Tubli 55,275 Route-17 Amman Ave/Ave-77 Route-18 Muharraq Ave/ Um Al Nassan Ave 41,398 Route-19 Sh. Hamad Avenue 29,944
- 19. Bahrain Average Traffic Flow on the Strategic Road Network Average growth in traffic is 3% per annum on major roads corridors. Average growth in registered vehicles amounts to 8% 19 Note: Volume Traffic Data For years 2013 on wards grew consistently at 3% 58231 60371 59561 64057 65978 67957 69995 0 10000 20000 30000 40000 50000 60000 70000 80000 2009 2010 2011 2012 2013 2014 2015 Average Daily Traffic Flow Pattern along All Routes
- 20. Bahrain Congestion Index (2.4) Compared Worldwide for 2012-13 Average Congested Time in Peak Hours- 9.85Min (~10Min) per vehicle Wage loss with Congestion delays for road users amounts to near BD 187,500 per day (or BD 42M per annum) 0 0.5 1 1.5 2 2.5 Paris Moscow Bahrain London Vienna Stockholm Sydney Berlin Copenhagen Dublin Istanbul Vancouver LosAngeles SanFransisco Toronto NewYork Johannesburg 1.36 1.65 2.4 1.29 1.27 1.36 1.35 1.28 1.21 1.25 1.57 1.36 1.35 1.32 1.27 1.26 1.31 Source: http://www.tomtom.com/en_gb/trafficindex/ 20 Congestion Index is the ratio of travel times in peak hour and off-peak hour
- 21. Bahrain Targeted Speed Compare d to Current Speed on Strategic Road Network The goal is to increase the trip speed by 40% by Q4 - 2015 through the implementation of the mitigation strategies of congestion The average speed at rush hour is targeted at 80% of the speed limit on roads corridors 21 7.5% increase in journey speeds from 40kph to 43kph (2009-2014) for the 10 key routes is observed, i.e. average 1.5% increase per annum.
- 22. Bahrain National Road Safety Strategy The trend of Number of Fatal & Serious Accidents are still off from the Desired Bahrain National Strategy target At the end of 2014 the Desired Reduction was - 24% but the actual was +11.5% 22 Note: Accident data for year 2015 is not available
- 23. Number of Fatalities per 100,000 People (2013) – Bahrain & Arab Countries Fatality Rates of Bahrain are lowest compared to other Arab Countries, 8.0 per 100,000 Population Source: World Health Organization, Global Status Report On Road Safety 2015 23 0 5 10 15 20 25 30 8 12.8 20.2 20.8 21.5 22.6 23.8 24.3 24.4 26.3 Rate Road Fatalities / 100,000 Population ( Arabian Countries )
- 24. Number of Fatalities per 100,000 People (2013) – Worldwide Comparison As per World Health Organization report data from 180 countries, Bahrain ranks 44 for the lowest fatalities per 100,000 population Source: World Health Organization, Global Status Report On Road Safety 2015 24 0 5 10 15 20 25 2.8 3.4 3.6 4.3 4.7 8 8.7 9.1 10.6 15.3 16.6 23.4 24 Rate Road Fatalities / 100,000 Population ( Global Countries )
- 25. Number of Fatalities per 100,000 People (2013) – Bahrain & GCC Fatality Rates of Bahrain are lowest compared to other GCC Countries, 8.0 per 100,000 Population. Source: World Health Organization, Global Status Report On Road Safety 2015 25 0 5 10 15 20 25 30 Bahrain United Arab Emirates (UAE) Qatar Kuwait Oman Saudi Arabia 8 10.9 15.2 18.7 25.4 27.4 Rate Road Fatalities / 100,000 Population ( GCC Countries )
- 27. 6 Arterial Roads 1. Sh.Khalifa Bin Salman Highway 2. Sh. Isa Bin Salman Highway 3. Al Fateh Highway/ Sitra Causeway/ Sh. Jaber Al Ahmed Al Sabah Highway 4. Estiglal Highway 10. Al Zallaq Highway/ Al Muaskar Highway 13. Dry Dock Highway 7 Collector Roads 5. Shaikh Salman Highway 6. Budaiyah Highway 7. Janabiya Highway 8. Al Ghous Avenue/ Khalifa Al Kabeer Ave/ Al Hidd Highway 12. Shaikh Zayed Highway 15. Kuwait Avenue 18. Muharraq Avenue/ Um Al Nassan Avenue 6 Distributor Roads 9. Inner Manama Loop Road 11. Palace Avenue/ Salmaniya Avenue 14.Aradous Highway/ Avenue-20 16.Avenue-13/ Avenue-23 in Tubli 19. Shaikh Hamad Avenue, Hamad Town 27 Bahrain; 19 Key Road Corridors of 247km length
- 28. Bahrain ITS Program ITS Program will be implemented in three stages Total Cost & O&M for 5 years; BD11.5Million (~USD 30Million) Permanent Traffic Control Center (TCC) to be at Salmabad (Temporary TCC at MoW) Bahrain ITS Program Goals; Focus on real time traffic monitoring and control using (CCTV Cameras, Intelligent traffic signals, Speed Cameras, Incident Detection Devices, Electronic Variable Message Signs (VMS) etc.) Provide Innovative Mobility Solutions Establish Collaborative Partnerships Develop and Adopt ITS Standards Challenge ; Limited land space and increasing population and increasing travel demand. Approach ; Utilizing public transport systems and using technology to optimize existing roads
- 29. Sh. Khalifa Bin Salman Port To KSA Bahrain International Airport Stage-2 SKBS South Stage-3 King Hamad Highway Integrated TCC at Salmabad Temporary TCC at MoW Secondary (GDT) Control Center @Isa Town Phase -1 shall focus on: Sh. Isa Bin Salman H/way, Al Fateh H/way Sh. Salman H/way Stage-1 ITS
- 30. Equipping 28 Kms of Sh. Khalifa Bin Salman Highway (between Al Fateh Highway and Bahrain International Circuit ) with: 52 CCTV/ AID Cameras 39 VMS (variable messaging signs) 30 sets of cameras 56 communication cabinets Potential to extend ITS works by additional 8km to connect to Bahrain International Airport. 30 Sh. Khalifa Bin Salman Port To KSA Bahrain International Airport Stage-2 SKBS South Stage-3 King Hamad Highway Integrated TCC at Salmabad Temporary TCC at MoW Secondary (GDT) Control Center @Isa Town Stage-2 ITS
- 31. Equipping 20km of King Hamad Highway (between Alba Roundabout & Durrat Al Bahrain ) with; 30 CCTV/ AID Cameras 30 VMS (variable messaging signs) 30 Sets of cameras 25 Communication cabinets Potential to extend ITS works by 10km to connect with stage-1 network (with Sh. Isa Bin Salman (SIBS) Highway). 31 Stage-3 ITS
- 32. Current ITS Developments in Bahrain: 1- Developing existing fiber optic communication systems 2- Developing Urban Traffic Control (SCOOT) Signals. 3- Introduce Traveller Information Systems Expand Fibre Optic Communication Network Expand Centrally Controlled Traffic Signals Network Introduce Traveller Information Systems 32
- 33. 33 - Routes where ducts for OFC are available - Routes where ducts for OFC available but need checking - Routes where ducts for OFC are proposed - Routes where ducts for OFC are under construction - Sections where the duct caps need to be filled. Bahrain’s Fibre Optic Network1- Status of Optic Fiber Cable (OFC) Ducts The OFC network is used for connecting traffic signal controllers & ITS systems. The Objective is to expand existing OFC communication network in phases. Mission is to connect all traffic signal controllers using OFC for control & monitoring.
- 34. 2- Centralized Control of Traffic Signals Bahrain uses Split Cycle Offset Optimisation Technique (SCOOT) for centralised control and monitoring of signalised junctions. 34 Existing SCOOT Regions: Manama Region – 13 junctions Airport Avenue Region - 5 junctions Salmaniya Region - 3 junctions SCOOT Regions Being Developed: Al Fateh Highway Region– 9 junctions Palace Avenue Region– 4 junctions Airport Avenue Region Salmaniya Region Manama Region
- 35. 3- Traveller Information System Once the Variable Message Sign (VMS) project is successful, Phase 1 expansion will commence. VMS will be programmed remotely for: Strategic diversion messaging, Incident and congestion warning, Traffic regulatory sign display including speed limit, Directional messaging etc. 35 Examples
- 36. 36 Conclusions & Takeaways Traffic Efficiency •Reliability •System Condition •Operational Efficiency •Mobility Safety •Accidents •Direct Impact •In Direct Impact Social Inclusion & Land Use •Accessibility •Special Groups •Total Covered Area Pollution Reduction •Motor Vehicles •Electric Vehicles