3. Understanding the Economic Crisis in
Four Pictures - Picture 2
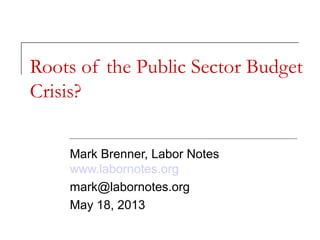
Real Wages for Nonsupervisory Workers
$0
$5
$10
$15
$20
$25
1947 1954 1961 1968 1975 1982 1989 1996 2003 2010
4. Understanding the Economic Crisis in
Four Pictures - Picture 3
Union Density
10.0
12.0
14.0
16.0
18.0
20.0
22.0
24.0
26.0
28.0
1973 1978 1983 1988 1993 1998 2003 2008
5. Understanding the Economic Crisis in
Four Pictures - Picture 4
Financial Profits as Share of All Corporate Profits
0.0%
5.0%
10.0%
15.0%
20.0%
25.0%
30.0%
35.0%
40.0%
45.0%
1948 1953 1958 1963 1968 1973 1978 1983 1988 1993 1998 2003 2008
6.
7. Wall Street Continues to Rake it In
0
5
10
15
20
25
30
35
40
1985 1990 1995 2000 2005 2010
Wall Street Bonus Pool (Billions)
8. Rising Inequality – CEO Pay to
Average Workers’ Wages
0
50
100
150
200
250
300
350
400
1965 1973 1978 1989 1995 2000 2007 2008 2009 2010 2011
9.
10. Raking it In
Share of U.S. Income Going to Top 10 Percent and Top 1%
0
5
10
15
20
25
30
35
40
45
50
1928 1938 1948 1958 1968 1978 1988 1998 2008 2010
12. 1% of
POP. 35.4% Wealth
41.3% Wealth
23.3% Wealth
9% of
POP.
of
population
Year: 2010
13. Shifting Burden off Corporations and
onto Individual Taxpayers
Corporate Taxes as a Percentage of Total Taxes
0.0%
5.0%
10.0%
15.0%
20.0%
25.0%
30.0%
35.0%
40.0%
1945 1955 1965 1975 1985 1995 2005 2010
14. Shifting Taxes from the 1% to 99%
State and Local Taxes as % of Household Income, 2010
$10,700 $25,600 $42,900 $69,000 $118,100 $253,700 $1.3 million
Avg.
Income
Lowest 20% Second 20% Middle 20% Fourth 20% Next 15% Next 4% Top 1%
0
2
4
6
8
10
12
US Average New York State
15. Shifting Taxes from the 1% to 99%, Cont'd
Average Tax Rates for .01% (blue) and .1% (red)
1945 1950 1955 1960 1965 1970 1975 1980 1985 1990 1995 2000 2005 2009
0
10
20
30
40
50
60
70
16. Economic Toll on New York
Year
2009
Budget Shortfall
4.9 billion
% of State
Budget
17.2%
2010 17.9 billion 38.8%
2011 8.5 billion 15.9%
2012 10 billion 18.2%
2013 2 billion 3.4%
Total 43.3 billion 18.7%
17. How Have Shortfalls Been Closed?
Spending Cuts
Emergency
Federal Aid
Taxes and Fees
Reserves
Other
45%
24%
16%
9%
7%
18. 1% Agenda for Public Sector
Medicaid “Redesign” and Other Cuts
“Reforming” Pensions and Retiree Health
Privatizing Services and Assets
Raising Revenue with “Fee for Service”
Tax Breaks and Corporate Giveaways to
Spur “Job Creation”
19. Sources
Corporate Profits as % of GDP: Calculated from the Bureau of Economic Analysis, National Income
and Product Accounts, Tables 1.1.5 Gross Domestic Product, and 6.16A-D Corporate Profits by
Industry
Real Wages for Non-Supervisory Workers: Calculated from Bureau of Labor Statistics, Series
CEU0500000008 (Average Hourly Earnings for Production and Non-Supervisory Employees) and
CWUR0000SA0,CWUS0000SA0 (Consumer Price Index for Urban Wage Earners and Clerical
Workers)
Union Density: Calculated from Current Population Survey by Barry T. Hirsch and David A.
Macpherson, http://www.unionstats.com
Financial Profits as Share of All Corporate Profits: Calculated from the Bureau of Economic
Analysis, National Income and Product Accounts, Tables 6.16A-D Corporate Profits by Industry
Wall Street Bonus Pool: Report from NY State Comptroller, February 26, 2013
Ratio of CEO Pay to Average Workers Wages: from Economic Policy Institute, State of Working
America, Table 4.43 (view on web)
Share of US Income Going to Top 10% and 1%: Emmanuel Saez and Thomas Piketty, "Income
Inequality in the United States, 1913-1998", Quarterly Journal of Economics, 118(1), 2003.
(Updated to 2011 from authors website)
New York Income Distribution: Graphic from The Nation, May 6, 2013, Source: Fiscal Policy
Institute, based on Pilketty and Saez's top 1% income share for the US and FPI analysis of NYS
Department of Tax and Finance and Division of the Budget data for NYS and NYC top 1%
income share, 2010-2012 projected. View online
Wealth Distribution: Edward N. Wolff, “The Asset Price Meltdown and the Wealth of the Middle
Class” New York University, August 26, 2012 (view online)
20. Sources, Cont’d
Corporate Taxes as % of Total Taxes: Calculated from data compiled by Brookings Institution, Tax
Policy Center, “Historical Amount of Revenue by Source (online here)
State and Local Taxes as % of Household Income: Institute for Taxation and Economic Policy,
“Who Pays? A Distributional Analysis of Tax Systems in All 50 States. January 2013 (available
online)
Average Tax Rates for .01% and .1%: Thomas L. Hungerford “Taxes and the Economy: An
Economic Analysis of the Top Tax Rates Since 1945,” Congressional Research Service,
September 14, 2012, data provided by author.
Cumulative Budget Shortfall in New York: Phil Oliff, Chris Mai, and Vincent Palacios, “States
Continue to Feel Recession’s Impact” Center for Budget and Policy Priorities, June 27, 2012
(available online)
How Have Shortfalls Been Closed?: Elizabeth McNichol, “Out of Balance: Cuts in Services Have
Been States’ Primary Response to Budget Gaps, Harming the Nation’s Economy” April 18, 2012
(available here)