1. R&D /61
Autumn 08 – the markit magazine
Volatility arbitrage
indices – a primer
I
n broad terms, volatility arbitrage
can be used to describe trading
strategies based on the difference in
volatility between related assets – for
instance, the implied volatility of two
options based on the same underly-
ing asset. However, the term is most
commonly used to describe strategies
that take advantage of the difference
between the forecasted future volatility
of an asset and the implied volatility of
options based on that asset. For more
detail on volatility see ‘box’ on page 67.
Keith Loggie, director global research & design
at Standard & Poor’s Index Services, looks at the
instruments and their context
This strategy is often implemented
through a delta-neutral portfolio consist-
ing of an option and its underlying asset.
The return on such a portfolio will be
based not on the future returns of the
underlying asset, but rather on the
volatility of its future price movements.
Buying an option and selling the
underlying asset results in a long
volatility position, while selling an option
and buying the underlying asset results
in a short volatility position. A long
volatility position will be profitable to the
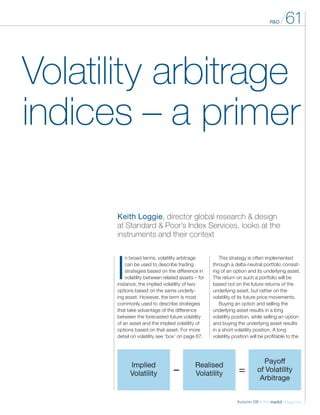
Implied
Volatility
Realised
Volatility
Payoff
of Volatility
Arbitrage
– =
2. /62R&D
the markit magazine – Autumn 08
R&D /63
Autumn 08 – the markit magazine
extent that the realised volatility on the
underlying is ultimately higher than the
implied volatility on the option at the time
of the trade.
While delta-neutral options-based
trades provide a means for investing
based on a view of future volatility, they
do present some drawbacks. Since the
delta of an option changes as the price
of the underlying asset changes over
time, a portfolio consisting of an option
and its underlying asset that is initially
delta-neutral will soon no longer be so.
At this point, the performance of the
portfolio is no longer based solely on
volatility of the underlying asset but also
on the performance of the underlying
asset. This can be prevented by
continuous delta hedging, or rebalancing
of the portfolio to ensure that it is delta
neutral. However, this not only creates
transaction costs, but also it is not
feasible for traders as they cannot
constantly alter their hedge. Thus the
position will generally not be solely
dependent on volatility and is therefore
not an ideal means of trading volatility.
Variance swaps
An alternative to options-based volatility
trading is to use variance swaps. In
a variance swap, one leg is valued
based on the realised variance (volatility
squared) of the underlying asset, as
measured by logarithmic returns, while
the other leg, the strike, is set at the
inception of the swap and is based
on the squared amount of the implied
volatility of the underlying asset at the
time the swap is struck.
The strike price of the swap is
determined by the implied volatility of the
options currently traded in the market
based on the underlying asset. Thus a
variance swap position is equivalent to a
portfolio of options on the underlying
asset and can be hedged in such
a manner.
5
10
15
20
25
30
35
%
Feb
90
Feb
91
Feb
92
Feb
93
Feb
94
Feb
95
Feb
96
Feb
97
Feb
98
Feb
99
Feb
00
Feb
01
Feb
02
Feb
03
Feb
04
Feb
05
Feb
06
Feb
07
Feb
08
Implied Volatility Realised Volatility
Exhibit 1: Implied and Realised Volatility of S&P 500
Source: Standard & Poor’s, CBOE.
Variance
swap buyer
Variance
swap seller
Implied Variance
Realised Variance
A long variance swap position will
profit if the realised variance of the
underlying asset is greater than the
implied variance at the time the swap is
struck. A variance swap provides pure
exposure to volatility, as, unlike options
prices, its value is based solely on
changes to volatility.
The payoff of a variance swap is equal
to the difference between realised
variance and implied variance, multiplied
by the number of contract units. The
number of contract units is set such that
if the realised volatility is one volatility
point above the strike, the payoff to the
receiver of realised volatility will be equal
to the notional value of the contract.
The variance swap market has grown
exponentially over the past decade and
is among the most liquid equity deriva-
tives contracts in the over-the-counter
markets. While the most liquid underly-
ing index is the S&P 500, there are also
markets in EuroStoxx 50, FTSE 100 and
Nikkei 225 contracts as well.
An interesting characteristic of
volatility is that for most traded assets,
implied volatility tends to be higher than
actual realised volatility. This is due to
the fact that options are often used as a
hedge or insurance. An investor will
purchase a put option to hedge against
large downward price movements or a
call option to hedge against large
upward price movements.
The options market is in many ways
similar to the home insurance market.
Investors using options buy protection
from changes in prices, much as a
homeowner purchases insurance
against fire, flood damage, etc. In both
cases, the provider of the insurance is
paid a premium to compensate for the
risk that is being taken.
Just as insurance companies price
their policies so that they expect to
make a profit based on estimates of their
eventual payouts, options writers will
only be willing to write options if they can
expect a sufficient profit to compensate
for the risks they are assuming. Thus,
options and options-based structures
such as variance swaps will tend to be
priced at a higher implied volatility than
is actually expected to be realised.
Based on the above discussion,
writers of options and investors who take
a short volatility position in a variance
swap or similar product should profit
over time. Historical data bears this out.
As noted above, the most popular
underlying index for variance swaps is
the S&P 500 and the implied volatility of
the S&P 500 is measured by VIX, the
CBOE Volatility Index. VIX measures the
implied volatility of the S&P 500 based
on the entire strip of S&P 500 options
contracts and uses the near-term and
next-term options to calculate the
implied volatility of the S&P 500 over the
next 30 calendar days.
Exhibit 1 tracks the implied volatility of
the S&P 500 as measured by VIX
against the actual realised volatility for
the following one-month period. The
start and end dates of each monthly
period are determined by the expiration
date of VIX options, generally the third
Friday of each month. One can see that
in general the implied volatility is higher
than the realised volatility.
The trend for implied volatility to be
higher than realised volatility is quite
consistent. Exhibit 2 shows that implied
volatility exceeds realised volatility in 86
per cent of the months. Furthermore,
the average and median differences
where implied exceeds realised is more
than the months where realised
exceeds implied.
Indexation of volatility arbitrage
Over the past year, transparent
indexation of volatility arbitrage has been
Implied Exceeds Realised Exceeds
Realised Implied
Number (%) of Observations 190 (86.36%) 30 (13.64%)
Average Monthly Difference 5.34% 3.63%
Median Monthly Difference 5.00% 3.13%
Exhibit 2: One-Month Implied versus Realised Volatility
Source: Standard & Poor’s. Data from February 1990 to June 2008.
" The variance swap market has grown
exponentially over the past decade and is
among the most liquid equity derivatives
contracts in the over-the-counter markets."
3. /64R&D
the markit magazine – Autumn 08
R&D /65
Autumn 08 – the markit magazine
introduced to serve as benchmarks for
volatility arbitrage strategies and to serve
as underlyings for index-linked products.
The S&P 500 Volatility Arbitrage Index
measures the performance of a variance
swap strategy that consists of receiving
the implied variance of the S&P 500
and paying the realised variance of the
S&P 500.
The index assumes a one-month
variance swap is entered into on the
third Friday of a given month and is held
until the third Friday of the following
month, at which time the position is
rolled over. The index is calculated on a
price return (unfunded) and total return
(funded) basis. The total return index
includes interest accrual on the notional
value of the index based on the one-
month US dollar Libor rate.
The implied variance used for the
index, equivalent to the strike price of a
corresponding variance swap, is
measured based on the average level of
VIX between 12.00pm and 1.00pm on
the roll date, less 1 per cent to account
for implementation slippage. The
performance of the index is calculated
based on the difference in the implied
variance less the realised variance of the
S&P 500 from the prior rebalancing date
through the current date.
This difference is multiplied by the
variance notional, equal to vega
(a volatility exposure modifier) divided
by twice the strike price (which converts
volatility points into dollar amounts).
For more details see the ‘box’ on
page 65.
The choice of vega is an important
determinant, and probably the principal
qualitative element in design of volatility
arbitrage indices. As Exhibit 3 shows, the
higher the vega, the higher the expected
return and risk from the index. For the
S&P 500 Volatility Arbitrage index, the
vega is set at a level of 30 per cent.
Index methodology
As noted in the main text, the S&P 500 Volatility Arbitrage
Index is rebalanced on the third Friday of each month. The
methodology approximates a one-month variance swap
position that receives implied variance on the S&P 500, as
measured by the VIX, the Chicago Board Option Exchange
Volatility Index, and pays realised variance on the S&P 500.
The total return version of the index incorporates interest
accrual on the notional value of the index. Interest accrues
based on the one-month US dollar Libor rate.
Index calculations
On any rebalancing date, t, the index is calculated as follows:
IndexValuet
= IndexValuet-1 * (1+ VolArbStrategyt
) (1)
where:
IndexValuet-1
= The index value as of the last
rebalancing date (t-1).
VolArbStrategyt
= A percentage, as determined
by the following formula:
VolArbStrategyt
= VarianceNotionalt-1 * [(IVSt-1
)2
– (RVSt-1,t
)2
] (2)
where:
t-1 = The last rebalancing date
IVSt
= Implied Volatility Strike. On any
rebalancing date, t, it is represented by
the equally-weighted average of the levels
of VIX, the CBOE Volatility Index as
published by the CBOE, minus 1 per
cent. The average is calculated using the
index levels as published by the CBOE
every five minutes from, and including,
12:00pm to, and including, 01:00pm (ET),
divided by 100. For index history prior to
January 18 2007, IVSt
is represented by
the average of the high value and low
value of VIX as published by the CBOE,
divided by 100, minus 1 per cent.
RVSt-1,t
= Realised Volatility Strike of the S&P 500
calculated using the following formula:
RVSt-1,t
= (3)
where:
Indexi
= The closing price of the S&P 500 on day i.
n = The number of trading days from, and including,
the prior rebalancing date, t-1, but excluding the
current rebalancing date, t.
VarianceNotionalt
= * Vega (4)
where:
Vega = A limit to the exposure on the spread.
30 per cent is used for this index.
Total Return Index
A total return version of the index is calculated, which
includes interest accrual on the notional value of the index
based on the one-month US dollar Libor rate, as follows:
TRIVt
= TRIVt-1 * (1+LIBORt-1 * (dt-1,t
/360) +VolArbStrategyt
)
where:
TRIVt
= Total return index value as of the current
rebalancing date, t.
TRIVt-1
= Total return index value as of the last
rebalancing date, t-1.
dt-1,t
= Count of calendar days from the prior
rebalancing date, t-1, to the current rebalancing
date, t, but excluding the prior rebalancing date.
LIBORt-1
= 1 month US dollar Libor rate as of the last
rebalancing date, t-1.
Base Date
The index base date is February 16 1990 at a base value
of 100.
Index committee
The S&P Arbitrage Index Committee maintains the S&P
500 Volatility Arbitrage Index. The Index Committee meets
regularly. At each meeting, the Index Committee reviews any
significant market events. In addition, the Committee may
revise index policy for timing of rebalancings or other matters.
Standard & Poor’s considers information about changes to
its indices and related matters to be potentially market
moving and material. Therefore, all Index Committee discus-
sions are confidential.
" The choice of vega is an important
determinant, and probably the principal
qualitative element in design of volatility
arbitrage indices."
0%
5%
10%
15%
20%
25%
30%
35%
Return
Risk
10% 30% 50% 100%
Vega
7%
13%
4%
19%
7%
15%
34%
2%
Exhibit 3: Impact of Vega on Volatility Arbitrage Index Returns
Source: Standard & Poor’s. Data from February 1990 to June 2008.