SlideShare ist ein Scribd-Unternehmen logo
1 von 33
Chemistry
Ammonia act as a weak base in water where it dissociates to form ionized ammonium as shown in Equation (1). In order
to remove ammonia we need to shift the reaction left to yield more unionized ammonia, which can be easily liberated
out of water. Consequently we can increase the pH to make this shift occur and as shown on Figure 995, that for a pH
above 10 almost 90% of the ammonia exists as the desired unionized form and at pH 11 almost 99% of the ammonia
exist as the desired form. At pH less than 10, unionized ammonia content decreased significantly, thus for a robust
operation it is desirable to keep the pH above 11.
(1)
Figure 995. Ammonia Dissociation at Different pH (Gay, 2009)
Pilot Plant Study
A pilot stripping column is constructed to simulate the ammonia stripping process. The data obtained
showed significant ammonia removal at pH 10 and greater and at pH 10 and greater less than 20 ppm
of ammonia is left in the treated stream.
Mass and Energy Balance
Mass Balance
The backwash system contain complex system that allows different modes of operation to regenerate the backwash
sand filter without causing any down time. For different modes of operation, flow path and flow rate are altered
resulting difficulty to perform mass balance. However the backwash system is designed to meet the objective of
delivering 10 m3
/hr of feed to the stripping column and thus simplified process shown in Figure 996 is used to perform
mass balance.
Table 994. Mass Balance Table
Mass Balance (kg/hr)
Storm Water Heated Feed Alkaline Stream Air
Air +
NH3 Water Sulfuric Acid Product
NH3 10 10 0 0 10 0 0 0
H2O 9964 9964 0.25 0 0 9964 0.25 9965
NaOH 0 0 0.25 0 0 0.25 0 0.25
H2SO4 0 0 0 4268 4268 0 0.25 0.25
Air 0 0 0 0 0 0 0 0
Sum 9974 9974 0.5 4268 4278 9964.25 0.5 9965.5
The hand calculated mass balance is shown in the Table xxx. Storm water contains ammonia and trace amount of other
impurities which may yield unexpected reaction and affect the result of this study. However, a pilot plant study was
conducted by Yara, and no unexpected reaction was observed and the design objective of less than 20 ppm of ammonia
in the product stream was achieved. Consequently, it is safe to assume impurities pose negligible effect on the removal
of ammonia. Under the condition that the storm water is assumed to contain only ammonia and no unexpected
reactions would occur in the process, the mass balance is significantly simplified and the hand calculated data Table xxx
replicated the data calculated using HYSYS, Figure 998.
Energy Balance
Energy balance was performed on the over all system and the system has a net of 540 kW consumption. This system was
assumed to operate under adiabatic, 100% efficient with no unexpected reactions. In order to consider these factors we
will have to consult distributors to find the type of insulation, the brand of pumps and perform a more detailed reaction
analysis. These details are recommended for future work but are not included in the scope of this design.
There are three types of energy conversion considered and they are shown in Table xxx below. The three types of energy
include chemical, electrical, and thermal energy conversion. The chemical energy is associated with enthalpy of
dissociation, via when solid NaOH dissociates in water heat is produced. Enthalpy of dissociation calculation was
performed and a sample calculation is shown in Appendix A. The electrical energy are associated with running the pump.
The thermal energy is required to bring up the temperature of storm water and air feed. When comparing chemical,
electrical and thermal energy transfer, heating yield the most significance and enthalpy of formation is almost negligible.
The total energy balance yield a deficit of 540 kW for an adiabatic, 100% efficient system with no unexpected reactions.
Table xxx. Energy Balance Table
Energy Balance ΔHf (kJ/mol) Amount (mol/hr) Energy Input (kW)
-44.5 6.25 -0.077
-206.96 2.54 -0.15
3.62 10 0.010
Pumps 40 horsepower 29.8 29.8
Cp (kJ/kg*K) ∆T
Air 4268 kg/hr 1.005 40 47.66
Storm Water 9974 kg/hr 4.179 40 463.13
Sum 540.40
Sample Calculation: Enthalpy of Ammonia Dissociation at Standard Condition
Table xxx. Enthalpy of Formation (Politechnika Gdanska)
Species ΔHo
f (kJ/mol)
NH3(aq) -80.29
H2O(l) -285.83
NH4
+
(aq) -132.51
OH-
(aq) -229.99
HYSYS Simulation
Figure 996 HYSYS Simulation
The process simulation was performed using AspenTech’s HYSYS 2006 version and the pfd is shown in
Figure 996. The purpose of this simulation is to assess the feasibility of the chemistry of removing
Ammonia to the desire level of less than 10 ppm. Control and backwash sand filtration systems are not
included because HYSYS lacked the ability to perform these simulations. For the complete over view
and discussion of the process please see the PFD section below.
A decision tree was used to find a suitable simulation thermodynamic model is shown in the Apendix
Figure 999. The decision tree has suggested Henry’s Law to be sufficient, however there is not such
model in the ASPEN HYSYS 2006 version. Consequently we have chosen General NRTL model which
complies with Henry’s law at low pressure and temperature, and thus was an ideal selection.
As shown in Figure 996, the Storm Water feed is preheated to 60 degree Celsius and alkalized with
NaOH to PH 11 and sent to the randomly packed stripping column. According to our chemistry, more
than 99% of the ammonia will be in the unionized form at this temperature and pH and can be easily
removed. The column packing and counter current air provides the disturbance required to break the
suspension of the ammonia and water and thus liberating ammonia out of water. The resulting product
stream contains almost no ammonia as shown in the simulation report, Figure 998.
PFD
The complete process Flow diagram is shown below.
Figure 997. Process Flow Diagram
NaOH/H2SO4 Addition
T-100 NaOH Mixing tank and T-300 H2SO4 are units used to add NaOH and H2SO4 respectively. Sodium
Hydroxide is required to raise the pH of the storm water to shift the ammonia from ionized form to unionized
form for ease of separation as discussed in the chemistry section above. The amount of NaOH required to
alkalize 10 m3
of storm water to PH 11 is determined to be 0.4 kg/hr and amount of H2SO4 required to
neutralize the same amount of sodium hydroxide is determined to be 0.5kg/hr. These results are based on
following equations (2) and (3) and the sample calculation for the amount of NaOH required is shown in
Appendix A.
(2)
(3)
From our research that PH 10 is sufficient to achieve our design objective, however at pH 10 the process are
not robust for fluctuation and may result ineffective removal of ammonia when pH is below 10. Since these
calculations show that the amount of acid and base required is small and thus it is economically sustainable to
bring pH to 11 and make the process more robust to fluctuations. In reality, because the predominant
importance of maintaining desired pH, pH controls are implemented to prevent undesired pH change and the
details will be discussed in the process control section.
Figure 998. HYSYS Simulation Report
Figure 999. EOS Flow Table (Hamid, 2007, p. 8)
Hazard and Operability Study
The relative risk of a deviation was defined as the product of the frequency and consequence. Both
frequency and consequence were ranked relatively on a scale of 1-4, where 4 represent a frequent
deviation or severe safety concerns. Frequency rating is based on Ulrich, where likeliness of incident
for common plant units is listed. Consequence rating is based on human judgment with reference to
Material Safety Data Sheets listed in Appendix D. The maximum relative risk achievable on this scale is
16. The 3D diagram of the relative risk graph is shown below in Figure 995.
Figure 995. HAZOP
Heat Exchanges
Stripping Column
NaOH Mixing Tank
Sulfuric Acid Mixing Tank
Backwash Sand Filter
Pumps
Piping
0
2
4
6
8
10
12
RelativeRisk
HAZOP
HAZOP analysis identified some severe problems such as heat exchanger subject to no flow, backwash
sand filter subject to high flow or high pressure, stripping column subject to high temperature etc.
Most these problems were identified as the result of pressure build up from abnormal flow condition.
Thus flow meter and pressure relief should be installed to provide methods of controlling flow and
mitigate the risk of pressure build up. For detailed HAZOP and list of recommendations please refer to
Table 996. HAZOP Decision Table in Appendix E.
Table 996. HAZOP Decision Table
Company: Yara HAZOP Team: Ahmed Agina, Hoss Agina, Jian Gu, Jingjin Chen
Process: Ammonia
Absorbtion Drawing: Ammonia absorbtion column
Date: March 10,
2014
Item: Heat
Exchanger
Process
Parameter
Guide
word
Possible
Causes Possible consequences
Freque
ncy
Consequ
ence
Ri
sk
Recommendati
on
Storm water
flow into heat
exchanger No Frozen Pipe
Pressurized pipe (steam
generation) 4 3 12
Implement flow
control
Plugged Pipe
Pressure relief
valve
Pump
malfunctioned
Higher
Improper flow
control
Insufficient removal of
ammonia 3 2 6
Lower
Improper flow
control
Pressurized pipe (steam
generation) 3 3 9
Implement flow
control
Cavitation in pump
Pressure relief
valve
Heated oil flow
into heat
exchanger No
Pump
malfunctioned Pressure build up 1 3 3
Pressure relief
valve
Pressure Higher
Storm water
flow below
normal Pipe rapture hazard 3 3 9
Flow rate meter
for monitoring
Storm water
flow
Pump Caviation
Lower Leakage None 1 0 0 None
Pump
malfunctioned
Temperature Higher
Storm water
flow below
normal Pressure build up 3 3 9
Flow rate meter
for monitoring
Storm water
flow
Lower
Oil flow rate
below normal Poor Ammonia removal 1 2 2
Item:Absorptio
n Column
Storm water
flow into column No Frozen Pipe None 4 0 0
Flow rate meter
for monitoring
Storm water
flow
Plugged Pipe
Pump
malfunctioned
Higher
Improper flow
control
Insufficient removal of
ammonia 3 2 6
Flow rate meter
for monitoring
Storm water
flow
Flooding/Leaking Storm
water solution
Lower
Improper flow
control None 3 0 0
Flow rate meter
for monitoring
Storm water
flow
Air rate into
column No
Pump
malfunctioned Poor ammonia removal 1 2 2
Preform regular
lab test for the
product
Pressure Higher
Improper flow
control
Flooding/Leaking Storm
water solution 3 1 3
Flow rate meter
for monitoring
Storm water
flow
Lower Leakage None 1 0 0
Pump
malfunctioned
Temperature Higher
Storm water
flow below
normal Incrustation 3 4 12
Flow rate meter
for monitoring
Storm water
flow
Lower
Heat
exchanger
malfunctioned Poor ammonia removal 1 2 2
Preform regular
lab test for the
product
Item:NaOH
mixing tank
Storm water
flow into column No Frozen Pipe None 4 0 0
Plugged Pipe
Pump
malfunctioned
Higher
Improper flow
control Overflow 3 2 6
Flow rate meter
for monitoring
Storm water
flow
Improper NaOH mixing
Lower
Improper flow
control None 3 0 0
NaOH Flow No
PH control
malfunctioned Poor ammonia removal 3 2 6
Preform regular
lab test for the
product
Pressure Higher
Improper flow
control
Flooding/Leaking NaOH
solution 3 3 9
Flow rate meter
for monitoring
Storm water
flow
Lower Leakage None 1 0 0
Pump
malfunctioned
Temperature Higher
Heat
exchanger
malfunctioned Incrustation 1 4 4
Clean the tank
peroidically
Lower
Heat
exchanger
malfunctioned None 1 0 0
Item:H2SO4
mixing tank
Storm water
flow into column No Frozen Pipe None 4 0 0 none
Plugged Pipe
Pump
malfunctioned
Higher
Improper flow
control Overflow 3 2 6
Flow rate meter
for monitoring
Storm water
flow
Improper H2SO4 mixing
Lower
Improper flow
control None 3 0 0
H2SO4 Flow No
PH control
malfunctioned
Basic solution/bad
product 3 3 9
Preform regular
lab test for the
product
Higher
PH control
malfunctioned
Acidic solution/bad
product, PH induced
corrosion 3 3 9
Preform regular
lab test for the
product
Lower
PH control
malfunctioned
Basic solution/bad
product 3 3 9
Preform regular
lab test for the
product
Item: Back wash sand
filter
Storm water
flow into filter No Frozen Pipe None 4 0 0 None
Plugged Pipe
Pump
malfunctioned
Higher
Improper flow
control Pressure build up 3 4 12
Flow rate meter
for monitoring
Storm water
flow
Lower
Improper flow
control None 3 0 0 None
Percipate
removal Lower
Sand was not
regenerated in
time
crustation/ Pump
damages 2 4 8
Strict
maintenance
scheduel
Pressure Higher
Storm water
flow above
normal Equipment rapture hazard 3 4 12
Flow rate meter
for monitoring
Storm water
flow
Lower Leakage None 1 0 0 None
Pump
malfunctioned
Temperature Higher
Heat exchange
malfunctioned None 1 0 0 None
Lower
Heat exchange
malfunctioned None 1 0 0 None
Item: Pumps
Storm water
flow into pumps No Frozen Pipe Cavitation in pump 4 2 8
Implement flow
control
Plugged Pipe
Pump
malfunctioned
Pressure Loss
Pump was not
primed Pump Caviation 1 2 2
Flow rate meter
for monitoring
Storm water
flow
High
Excess friction
from blocked
pipe Pressure build up 4 3 12
Pressure relief
valve
Control valve
malfunctioned
Temperature Higher
Heat
exchanger
malfunctioned Cavitation in pump 1 2 2
Flow rate meter
for monitoring
Storm water
flow
Item: Pipe
Blockage No Frozen Pipe Pressure build up 4 3 12
Implement flow
control
Plugged Pipe
Pressure relief
valve
Pump
malfunctioned
Precipatation on
the pipe wall
Signific
ant Incrustation Pressure build up 2 3 6
Replace pipe if
necessary
Corrosion
Signific
ant
failed PH
control Leakage 3 3 9
Use
Polyethylene or
Fiber glass pipe
Steam
generation
Signific
ant Flow varation Pressure build up 3 3 9
Implement flow
control
Heat
exchanger
malfunction
Pressure relief
valve
Sulfuric Acid S2SO4
Sodium Hydroxide (NaOH)
Ammonium Hydroxide (NH4OH)
Appendices
Sample Calculation: amount of NaOH required to alkailize 10 m3
/h storm water to pH 11
M
http://www.engr.usask.ca/classes/CHE/422/notes/ClassOrientation-Final%20Report%20Jan%202014.pptx
http://www.engr.usask.ca/classes/CHE/422/notes/2011/guideforreport.doc

Weitere ähnliche Inhalte

Was ist angesagt?

Final Year Thesis.PDF
Final Year Thesis.PDFFinal Year Thesis.PDF
Final Year Thesis.PDFOmer Farooqi
 
Economics of ammonia production from offgases
Economics of ammonia production from offgasesEconomics of ammonia production from offgases
Economics of ammonia production from offgasesVK Arora
 
Process improvement
Process improvementProcess improvement
Process improvementLeeya Najwa
 
A Unique Syngas Cleanup Scheme - China Syngas to Acetic Acid
A Unique Syngas Cleanup Scheme - China Syngas to Acetic Acid A Unique Syngas Cleanup Scheme - China Syngas to Acetic Acid
A Unique Syngas Cleanup Scheme - China Syngas to Acetic Acid James Bixby
 
Developments in Ammonia Production Technology
Developments in Ammonia Production TechnologyDevelopments in Ammonia Production Technology
Developments in Ammonia Production TechnologyJahanzeb Khan
 
Ammonia plant material balance
Ammonia plant material balanceAmmonia plant material balance
Ammonia plant material balancePrem Baboo
 
Topsoe large scale_methanol_prod_paper
Topsoe large scale_methanol_prod_paperTopsoe large scale_methanol_prod_paper
Topsoe large scale_methanol_prod_paperabodin
 
Operation of urea fertilizers plant
Operation of urea fertilizers plantOperation of urea fertilizers plant
Operation of urea fertilizers plantPrem Baboo
 
Optimization of H2 Production in a Hydrogen Generation Unit
Optimization of H2 Production in a Hydrogen Generation UnitOptimization of H2 Production in a Hydrogen Generation Unit
Optimization of H2 Production in a Hydrogen Generation UnitMárcio Garcia
 
Ammonia mass-balance
Ammonia mass-balanceAmmonia mass-balance
Ammonia mass-balancebalas1943
 
334529321 production-of-acetic-acid-pptx
334529321 production-of-acetic-acid-pptx334529321 production-of-acetic-acid-pptx
334529321 production-of-acetic-acid-pptxBatuhanKse1
 
132952928 4th-yr-dsgn-pro
132952928 4th-yr-dsgn-pro132952928 4th-yr-dsgn-pro
132952928 4th-yr-dsgn-proBatuhanKse1
 
Process simulation of urea plant
Process simulation of urea plantProcess simulation of urea plant
Process simulation of urea plantGajanan Hange
 
F E R T I L I Z E R I N D U S T R Y L E C T U R E 1
F E R T I L I Z E R  I N D U S T R Y  L E C T U R E 1F E R T I L I Z E R  I N D U S T R Y  L E C T U R E 1
F E R T I L I Z E R I N D U S T R Y L E C T U R E 1Rishi Yadav
 
Ammonia plant efficiency
Ammonia plant efficiencyAmmonia plant efficiency
Ammonia plant efficiencyHimanshu Sharma
 
Methanol Synthesis Chemistry
Methanol Synthesis ChemistryMethanol Synthesis Chemistry
Methanol Synthesis ChemistryGerard B. Hawkins
 

Was ist angesagt? (20)

Acetic Acid Process Plant Design
Acetic Acid Process Plant DesignAcetic Acid Process Plant Design
Acetic Acid Process Plant Design
 
Final Year Thesis.PDF
Final Year Thesis.PDFFinal Year Thesis.PDF
Final Year Thesis.PDF
 
Economics of ammonia production from offgases
Economics of ammonia production from offgasesEconomics of ammonia production from offgases
Economics of ammonia production from offgases
 
Process improvement
Process improvementProcess improvement
Process improvement
 
Kbr[1] report
Kbr[1] reportKbr[1] report
Kbr[1] report
 
A Unique Syngas Cleanup Scheme - China Syngas to Acetic Acid
A Unique Syngas Cleanup Scheme - China Syngas to Acetic Acid A Unique Syngas Cleanup Scheme - China Syngas to Acetic Acid
A Unique Syngas Cleanup Scheme - China Syngas to Acetic Acid
 
Developments in Ammonia Production Technology
Developments in Ammonia Production TechnologyDevelopments in Ammonia Production Technology
Developments in Ammonia Production Technology
 
Ammonia plant material balance
Ammonia plant material balanceAmmonia plant material balance
Ammonia plant material balance
 
Topsoe large scale_methanol_prod_paper
Topsoe large scale_methanol_prod_paperTopsoe large scale_methanol_prod_paper
Topsoe large scale_methanol_prod_paper
 
Operation of urea fertilizers plant
Operation of urea fertilizers plantOperation of urea fertilizers plant
Operation of urea fertilizers plant
 
Ammonia Industries
Ammonia IndustriesAmmonia Industries
Ammonia Industries
 
Optimization of H2 Production in a Hydrogen Generation Unit
Optimization of H2 Production in a Hydrogen Generation UnitOptimization of H2 Production in a Hydrogen Generation Unit
Optimization of H2 Production in a Hydrogen Generation Unit
 
Ammonia mass-balance
Ammonia mass-balanceAmmonia mass-balance
Ammonia mass-balance
 
334529321 production-of-acetic-acid-pptx
334529321 production-of-acetic-acid-pptx334529321 production-of-acetic-acid-pptx
334529321 production-of-acetic-acid-pptx
 
132952928 4th-yr-dsgn-pro
132952928 4th-yr-dsgn-pro132952928 4th-yr-dsgn-pro
132952928 4th-yr-dsgn-pro
 
SLIDE FYDP2
SLIDE FYDP2SLIDE FYDP2
SLIDE FYDP2
 
Process simulation of urea plant
Process simulation of urea plantProcess simulation of urea plant
Process simulation of urea plant
 
F E R T I L I Z E R I N D U S T R Y L E C T U R E 1
F E R T I L I Z E R  I N D U S T R Y  L E C T U R E 1F E R T I L I Z E R  I N D U S T R Y  L E C T U R E 1
F E R T I L I Z E R I N D U S T R Y L E C T U R E 1
 
Ammonia plant efficiency
Ammonia plant efficiencyAmmonia plant efficiency
Ammonia plant efficiency
 
Methanol Synthesis Chemistry
Methanol Synthesis ChemistryMethanol Synthesis Chemistry
Methanol Synthesis Chemistry
 

Andere mochten auch

All the Years of Her Life
All the Years of Her LifeAll the Years of Her Life
All the Years of Her Lifemikeyiz
 
A Mother in Manville
A Mother in ManvilleA Mother in Manville
A Mother in Manvillemikeyiz
 
NACES Plant Design Report - SynTech Curtin Sarawak
NACES Plant Design Report - SynTech Curtin SarawakNACES Plant Design Report - SynTech Curtin Sarawak
NACES Plant Design Report - SynTech Curtin SarawakLee Ren Jie
 
RITUXIMAB PLANT DESIGN
RITUXIMAB PLANT DESIGNRITUXIMAB PLANT DESIGN
RITUXIMAB PLANT DESIGNAnil Vibhute
 
Hazop study on sewage treatment plant at educational institution
Hazop study on sewage treatment plant at educational institutionHazop study on sewage treatment plant at educational institution
Hazop study on sewage treatment plant at educational institutioneSAT Publishing House
 
Hazop suplimentry study
Hazop suplimentry studyHazop suplimentry study
Hazop suplimentry studyAneel Ahmad
 
HAZOP - AN INTEGRATED SAFETY ASSESSMENT STUDY
HAZOP - AN INTEGRATED SAFETY ASSESSMENT STUDYHAZOP - AN INTEGRATED SAFETY ASSESSMENT STUDY
HAZOP - AN INTEGRATED SAFETY ASSESSMENT STUDYOsho Shemil Baba
 

Andere mochten auch (10)

FYDP Sem 2
FYDP Sem 2FYDP Sem 2
FYDP Sem 2
 
All the Years of Her Life
All the Years of Her LifeAll the Years of Her Life
All the Years of Her Life
 
A Mother in Manville
A Mother in ManvilleA Mother in Manville
A Mother in Manville
 
NACES Plant Design Report - SynTech Curtin Sarawak
NACES Plant Design Report - SynTech Curtin SarawakNACES Plant Design Report - SynTech Curtin Sarawak
NACES Plant Design Report - SynTech Curtin Sarawak
 
RITUXIMAB PLANT DESIGN
RITUXIMAB PLANT DESIGNRITUXIMAB PLANT DESIGN
RITUXIMAB PLANT DESIGN
 
HAZOP Basics
HAZOP BasicsHAZOP Basics
HAZOP Basics
 
Hazop study on sewage treatment plant at educational institution
Hazop study on sewage treatment plant at educational institutionHazop study on sewage treatment plant at educational institution
Hazop study on sewage treatment plant at educational institution
 
Hazop method
Hazop methodHazop method
Hazop method
 
Hazop suplimentry study
Hazop suplimentry studyHazop suplimentry study
Hazop suplimentry study
 
HAZOP - AN INTEGRATED SAFETY ASSESSMENT STUDY
HAZOP - AN INTEGRATED SAFETY ASSESSMENT STUDYHAZOP - AN INTEGRATED SAFETY ASSESSMENT STUDY
HAZOP - AN INTEGRATED SAFETY ASSESSMENT STUDY
 

Ähnlich wie Design finalreport2

Final_Report_124
Final_Report_124Final_Report_124
Final_Report_124Alan Tam
 
WASTEWATER TREATMENT TECHNOLOGIES FOR THE REMOVAL OF NITROGEN & PHOSPHORUS
WASTEWATER TREATMENT TECHNOLOGIES FOR THE REMOVAL OF NITROGEN & PHOSPHORUS WASTEWATER TREATMENT TECHNOLOGIES FOR THE REMOVAL OF NITROGEN & PHOSPHORUS
WASTEWATER TREATMENT TECHNOLOGIES FOR THE REMOVAL OF NITROGEN & PHOSPHORUS Rabia Aziz
 
OPERATION AND TROUBLE SHOOTING IN UREA SYNTHESI SSECTION.pdf
OPERATION AND TROUBLE SHOOTING IN UREA SYNTHESI SSECTION.pdfOPERATION AND TROUBLE SHOOTING IN UREA SYNTHESI SSECTION.pdf
OPERATION AND TROUBLE SHOOTING IN UREA SYNTHESI SSECTION.pdfPremBaboo4
 
OPERATION AND TROUBLE SHOOTING IN UREA SYNTHESI SSECTION.pdf
OPERATION AND TROUBLE SHOOTING IN UREA SYNTHESI SSECTION.pdfOPERATION AND TROUBLE SHOOTING IN UREA SYNTHESI SSECTION.pdf
OPERATION AND TROUBLE SHOOTING IN UREA SYNTHESI SSECTION.pdfPremBaboo4
 
انتاج اليوريا
انتاج اليورياانتاج اليوريا
انتاج اليورياAli Zamel
 
006a.docx
006a.docx006a.docx
006a.docxusto
 
AICHE Senior Design Project
AICHE Senior Design ProjectAICHE Senior Design Project
AICHE Senior Design ProjectJonathan Sherwin
 
Ureaplantenergysavingbyselectionoflinermaterialandinernals
UreaplantenergysavingbyselectionoflinermaterialandinernalsUreaplantenergysavingbyselectionoflinermaterialandinernals
UreaplantenergysavingbyselectionoflinermaterialandinernalsPrem Baboo
 
Accidental Releases Analysis for Toxic Aqueous Solutions
Accidental Releases Analysis for Toxic Aqueous SolutionsAccidental Releases Analysis for Toxic Aqueous Solutions
Accidental Releases Analysis for Toxic Aqueous SolutionsBREEZE Software
 
OPERATION AND TROUBLE SHOOTING IN LP AND VACUUM SECTION FOR MS SAIPEM PROCESS...
OPERATION AND TROUBLE SHOOTING IN LP AND VACUUM SECTION FOR MS SAIPEM PROCESS...OPERATION AND TROUBLE SHOOTING IN LP AND VACUUM SECTION FOR MS SAIPEM PROCESS...
OPERATION AND TROUBLE SHOOTING IN LP AND VACUUM SECTION FOR MS SAIPEM PROCESS...PremBaboo4
 
ethanol production from molasses is analysed with Aspen
ethanol production from molasses is analysed with Aspenethanol production from molasses is analysed with Aspen
ethanol production from molasses is analysed with AspenSNSEnerji
 
Description of nitric acid manufacturing process
Description of nitric acid manufacturing processDescription of nitric acid manufacturing process
Description of nitric acid manufacturing processSameer Pandey
 
mitacs uoit study it05701 july 2015 vezina comparative ammonia costs producti...
mitacs uoit study it05701 july 2015 vezina comparative ammonia costs producti...mitacs uoit study it05701 july 2015 vezina comparative ammonia costs producti...
mitacs uoit study it05701 july 2015 vezina comparative ammonia costs producti...Steve Wittrig
 
Design and Operation of a Distillation Column for the Binary Mixture
Design and Operation of a Distillation Column for the Binary MixtureDesign and Operation of a Distillation Column for the Binary Mixture
Design and Operation of a Distillation Column for the Binary MixtureJonathan Sherwin
 

Ähnlich wie Design finalreport2 (20)

Final_Report_124
Final_Report_124Final_Report_124
Final_Report_124
 
Final_Report_124
Final_Report_124Final_Report_124
Final_Report_124
 
Final_Report_124
Final_Report_124Final_Report_124
Final_Report_124
 
WASTEWATER TREATMENT TECHNOLOGIES FOR THE REMOVAL OF NITROGEN & PHOSPHORUS
WASTEWATER TREATMENT TECHNOLOGIES FOR THE REMOVAL OF NITROGEN & PHOSPHORUS WASTEWATER TREATMENT TECHNOLOGIES FOR THE REMOVAL OF NITROGEN & PHOSPHORUS
WASTEWATER TREATMENT TECHNOLOGIES FOR THE REMOVAL OF NITROGEN & PHOSPHORUS
 
OPERATION AND TROUBLE SHOOTING IN UREA SYNTHESI SSECTION.pdf
OPERATION AND TROUBLE SHOOTING IN UREA SYNTHESI SSECTION.pdfOPERATION AND TROUBLE SHOOTING IN UREA SYNTHESI SSECTION.pdf
OPERATION AND TROUBLE SHOOTING IN UREA SYNTHESI SSECTION.pdf
 
OPERATION AND TROUBLE SHOOTING IN UREA SYNTHESI SSECTION.pdf
OPERATION AND TROUBLE SHOOTING IN UREA SYNTHESI SSECTION.pdfOPERATION AND TROUBLE SHOOTING IN UREA SYNTHESI SSECTION.pdf
OPERATION AND TROUBLE SHOOTING IN UREA SYNTHESI SSECTION.pdf
 
انتاج اليوريا
انتاج اليورياانتاج اليوريا
انتاج اليوريا
 
006a.docx
006a.docx006a.docx
006a.docx
 
Ijetr042158
Ijetr042158Ijetr042158
Ijetr042158
 
barba1985.pdf
barba1985.pdfbarba1985.pdf
barba1985.pdf
 
AICHE Senior Design Project
AICHE Senior Design ProjectAICHE Senior Design Project
AICHE Senior Design Project
 
Ureaplantenergysavingbyselectionoflinermaterialandinernals
UreaplantenergysavingbyselectionoflinermaterialandinernalsUreaplantenergysavingbyselectionoflinermaterialandinernals
Ureaplantenergysavingbyselectionoflinermaterialandinernals
 
Accidental Releases Analysis for Toxic Aqueous Solutions
Accidental Releases Analysis for Toxic Aqueous SolutionsAccidental Releases Analysis for Toxic Aqueous Solutions
Accidental Releases Analysis for Toxic Aqueous Solutions
 
OPERATION AND TROUBLE SHOOTING IN LP AND VACUUM SECTION FOR MS SAIPEM PROCESS...
OPERATION AND TROUBLE SHOOTING IN LP AND VACUUM SECTION FOR MS SAIPEM PROCESS...OPERATION AND TROUBLE SHOOTING IN LP AND VACUUM SECTION FOR MS SAIPEM PROCESS...
OPERATION AND TROUBLE SHOOTING IN LP AND VACUUM SECTION FOR MS SAIPEM PROCESS...
 
OPERATION AND TROUBLE SHOOTING IN LP AND VACUUM SECTION FOR MS SAIPEM PROCESS...
OPERATION AND TROUBLE SHOOTING IN LP AND VACUUM SECTION FOR MS SAIPEM PROCESS...OPERATION AND TROUBLE SHOOTING IN LP AND VACUUM SECTION FOR MS SAIPEM PROCESS...
OPERATION AND TROUBLE SHOOTING IN LP AND VACUUM SECTION FOR MS SAIPEM PROCESS...
 
ethanol production from molasses is analysed with Aspen
ethanol production from molasses is analysed with Aspenethanol production from molasses is analysed with Aspen
ethanol production from molasses is analysed with Aspen
 
Description of nitric acid manufacturing process
Description of nitric acid manufacturing processDescription of nitric acid manufacturing process
Description of nitric acid manufacturing process
 
mitacs uoit study it05701 july 2015 vezina comparative ammonia costs producti...
mitacs uoit study it05701 july 2015 vezina comparative ammonia costs producti...mitacs uoit study it05701 july 2015 vezina comparative ammonia costs producti...
mitacs uoit study it05701 july 2015 vezina comparative ammonia costs producti...
 
Design and Operation of a Distillation Column for the Binary Mixture
Design and Operation of a Distillation Column for the Binary MixtureDesign and Operation of a Distillation Column for the Binary Mixture
Design and Operation of a Distillation Column for the Binary Mixture
 
Ammonia Synthesis
Ammonia SynthesisAmmonia Synthesis
Ammonia Synthesis
 

Design finalreport2

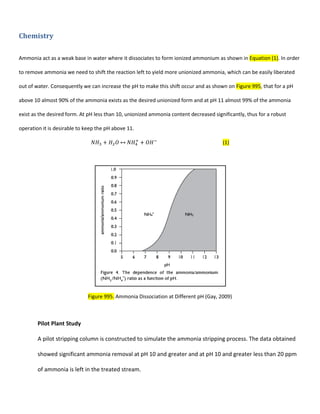
  • 1. Chemistry Ammonia act as a weak base in water where it dissociates to form ionized ammonium as shown in Equation (1). In order to remove ammonia we need to shift the reaction left to yield more unionized ammonia, which can be easily liberated out of water. Consequently we can increase the pH to make this shift occur and as shown on Figure 995, that for a pH above 10 almost 90% of the ammonia exists as the desired unionized form and at pH 11 almost 99% of the ammonia exist as the desired form. At pH less than 10, unionized ammonia content decreased significantly, thus for a robust operation it is desirable to keep the pH above 11. (1) Figure 995. Ammonia Dissociation at Different pH (Gay, 2009) Pilot Plant Study A pilot stripping column is constructed to simulate the ammonia stripping process. The data obtained showed significant ammonia removal at pH 10 and greater and at pH 10 and greater less than 20 ppm of ammonia is left in the treated stream.
  • 2. Mass and Energy Balance Mass Balance The backwash system contain complex system that allows different modes of operation to regenerate the backwash sand filter without causing any down time. For different modes of operation, flow path and flow rate are altered resulting difficulty to perform mass balance. However the backwash system is designed to meet the objective of delivering 10 m3 /hr of feed to the stripping column and thus simplified process shown in Figure 996 is used to perform mass balance. Table 994. Mass Balance Table Mass Balance (kg/hr) Storm Water Heated Feed Alkaline Stream Air Air + NH3 Water Sulfuric Acid Product NH3 10 10 0 0 10 0 0 0 H2O 9964 9964 0.25 0 0 9964 0.25 9965 NaOH 0 0 0.25 0 0 0.25 0 0.25 H2SO4 0 0 0 4268 4268 0 0.25 0.25 Air 0 0 0 0 0 0 0 0 Sum 9974 9974 0.5 4268 4278 9964.25 0.5 9965.5 The hand calculated mass balance is shown in the Table xxx. Storm water contains ammonia and trace amount of other impurities which may yield unexpected reaction and affect the result of this study. However, a pilot plant study was conducted by Yara, and no unexpected reaction was observed and the design objective of less than 20 ppm of ammonia in the product stream was achieved. Consequently, it is safe to assume impurities pose negligible effect on the removal of ammonia. Under the condition that the storm water is assumed to contain only ammonia and no unexpected reactions would occur in the process, the mass balance is significantly simplified and the hand calculated data Table xxx replicated the data calculated using HYSYS, Figure 998. Energy Balance Energy balance was performed on the over all system and the system has a net of 540 kW consumption. This system was assumed to operate under adiabatic, 100% efficient with no unexpected reactions. In order to consider these factors we will have to consult distributors to find the type of insulation, the brand of pumps and perform a more detailed reaction analysis. These details are recommended for future work but are not included in the scope of this design.
  • 3. There are three types of energy conversion considered and they are shown in Table xxx below. The three types of energy include chemical, electrical, and thermal energy conversion. The chemical energy is associated with enthalpy of dissociation, via when solid NaOH dissociates in water heat is produced. Enthalpy of dissociation calculation was performed and a sample calculation is shown in Appendix A. The electrical energy are associated with running the pump. The thermal energy is required to bring up the temperature of storm water and air feed. When comparing chemical, electrical and thermal energy transfer, heating yield the most significance and enthalpy of formation is almost negligible. The total energy balance yield a deficit of 540 kW for an adiabatic, 100% efficient system with no unexpected reactions. Table xxx. Energy Balance Table Energy Balance ΔHf (kJ/mol) Amount (mol/hr) Energy Input (kW) -44.5 6.25 -0.077 -206.96 2.54 -0.15 3.62 10 0.010 Pumps 40 horsepower 29.8 29.8 Cp (kJ/kg*K) ∆T Air 4268 kg/hr 1.005 40 47.66 Storm Water 9974 kg/hr 4.179 40 463.13 Sum 540.40 Sample Calculation: Enthalpy of Ammonia Dissociation at Standard Condition Table xxx. Enthalpy of Formation (Politechnika Gdanska) Species ΔHo f (kJ/mol) NH3(aq) -80.29 H2O(l) -285.83 NH4 + (aq) -132.51 OH- (aq) -229.99
  • 4. HYSYS Simulation Figure 996 HYSYS Simulation The process simulation was performed using AspenTech’s HYSYS 2006 version and the pfd is shown in Figure 996. The purpose of this simulation is to assess the feasibility of the chemistry of removing Ammonia to the desire level of less than 10 ppm. Control and backwash sand filtration systems are not included because HYSYS lacked the ability to perform these simulations. For the complete over view and discussion of the process please see the PFD section below. A decision tree was used to find a suitable simulation thermodynamic model is shown in the Apendix Figure 999. The decision tree has suggested Henry’s Law to be sufficient, however there is not such model in the ASPEN HYSYS 2006 version. Consequently we have chosen General NRTL model which complies with Henry’s law at low pressure and temperature, and thus was an ideal selection. As shown in Figure 996, the Storm Water feed is preheated to 60 degree Celsius and alkalized with NaOH to PH 11 and sent to the randomly packed stripping column. According to our chemistry, more than 99% of the ammonia will be in the unionized form at this temperature and pH and can be easily removed. The column packing and counter current air provides the disturbance required to break the suspension of the ammonia and water and thus liberating ammonia out of water. The resulting product stream contains almost no ammonia as shown in the simulation report, Figure 998.
  • 5. PFD The complete process Flow diagram is shown below. Figure 997. Process Flow Diagram NaOH/H2SO4 Addition T-100 NaOH Mixing tank and T-300 H2SO4 are units used to add NaOH and H2SO4 respectively. Sodium Hydroxide is required to raise the pH of the storm water to shift the ammonia from ionized form to unionized form for ease of separation as discussed in the chemistry section above. The amount of NaOH required to alkalize 10 m3 of storm water to PH 11 is determined to be 0.4 kg/hr and amount of H2SO4 required to neutralize the same amount of sodium hydroxide is determined to be 0.5kg/hr. These results are based on following equations (2) and (3) and the sample calculation for the amount of NaOH required is shown in Appendix A. (2) (3) From our research that PH 10 is sufficient to achieve our design objective, however at pH 10 the process are not robust for fluctuation and may result ineffective removal of ammonia when pH is below 10. Since these
  • 6. calculations show that the amount of acid and base required is small and thus it is economically sustainable to bring pH to 11 and make the process more robust to fluctuations. In reality, because the predominant importance of maintaining desired pH, pH controls are implemented to prevent undesired pH change and the details will be discussed in the process control section.
  • 7. Figure 998. HYSYS Simulation Report
  • 8. Figure 999. EOS Flow Table (Hamid, 2007, p. 8)
  • 9. Hazard and Operability Study The relative risk of a deviation was defined as the product of the frequency and consequence. Both frequency and consequence were ranked relatively on a scale of 1-4, where 4 represent a frequent deviation or severe safety concerns. Frequency rating is based on Ulrich, where likeliness of incident for common plant units is listed. Consequence rating is based on human judgment with reference to Material Safety Data Sheets listed in Appendix D. The maximum relative risk achievable on this scale is 16. The 3D diagram of the relative risk graph is shown below in Figure 995. Figure 995. HAZOP Heat Exchanges Stripping Column NaOH Mixing Tank Sulfuric Acid Mixing Tank Backwash Sand Filter Pumps Piping 0 2 4 6 8 10 12 RelativeRisk HAZOP
  • 10. HAZOP analysis identified some severe problems such as heat exchanger subject to no flow, backwash sand filter subject to high flow or high pressure, stripping column subject to high temperature etc. Most these problems were identified as the result of pressure build up from abnormal flow condition. Thus flow meter and pressure relief should be installed to provide methods of controlling flow and mitigate the risk of pressure build up. For detailed HAZOP and list of recommendations please refer to Table 996. HAZOP Decision Table in Appendix E. Table 996. HAZOP Decision Table Company: Yara HAZOP Team: Ahmed Agina, Hoss Agina, Jian Gu, Jingjin Chen Process: Ammonia Absorbtion Drawing: Ammonia absorbtion column Date: March 10, 2014 Item: Heat Exchanger Process Parameter Guide word Possible Causes Possible consequences Freque ncy Consequ ence Ri sk Recommendati on Storm water flow into heat exchanger No Frozen Pipe Pressurized pipe (steam generation) 4 3 12 Implement flow control Plugged Pipe Pressure relief valve Pump malfunctioned Higher Improper flow control Insufficient removal of ammonia 3 2 6 Lower Improper flow control Pressurized pipe (steam generation) 3 3 9 Implement flow control Cavitation in pump Pressure relief valve Heated oil flow into heat exchanger No Pump malfunctioned Pressure build up 1 3 3 Pressure relief valve Pressure Higher Storm water flow below normal Pipe rapture hazard 3 3 9 Flow rate meter for monitoring Storm water flow Pump Caviation Lower Leakage None 1 0 0 None Pump malfunctioned Temperature Higher Storm water flow below normal Pressure build up 3 3 9 Flow rate meter for monitoring Storm water flow Lower Oil flow rate below normal Poor Ammonia removal 1 2 2
  • 11. Item:Absorptio n Column Storm water flow into column No Frozen Pipe None 4 0 0 Flow rate meter for monitoring Storm water flow Plugged Pipe Pump malfunctioned Higher Improper flow control Insufficient removal of ammonia 3 2 6 Flow rate meter for monitoring Storm water flow Flooding/Leaking Storm water solution Lower Improper flow control None 3 0 0 Flow rate meter for monitoring Storm water flow Air rate into column No Pump malfunctioned Poor ammonia removal 1 2 2 Preform regular lab test for the product Pressure Higher Improper flow control Flooding/Leaking Storm water solution 3 1 3 Flow rate meter for monitoring Storm water flow Lower Leakage None 1 0 0 Pump malfunctioned Temperature Higher Storm water flow below normal Incrustation 3 4 12 Flow rate meter for monitoring Storm water flow Lower Heat exchanger malfunctioned Poor ammonia removal 1 2 2 Preform regular lab test for the product Item:NaOH mixing tank Storm water flow into column No Frozen Pipe None 4 0 0 Plugged Pipe Pump malfunctioned Higher Improper flow control Overflow 3 2 6 Flow rate meter for monitoring Storm water flow Improper NaOH mixing Lower Improper flow control None 3 0 0 NaOH Flow No PH control malfunctioned Poor ammonia removal 3 2 6 Preform regular lab test for the product Pressure Higher Improper flow control Flooding/Leaking NaOH solution 3 3 9 Flow rate meter for monitoring Storm water flow
  • 12. Lower Leakage None 1 0 0 Pump malfunctioned Temperature Higher Heat exchanger malfunctioned Incrustation 1 4 4 Clean the tank peroidically Lower Heat exchanger malfunctioned None 1 0 0 Item:H2SO4 mixing tank Storm water flow into column No Frozen Pipe None 4 0 0 none Plugged Pipe Pump malfunctioned Higher Improper flow control Overflow 3 2 6 Flow rate meter for monitoring Storm water flow Improper H2SO4 mixing Lower Improper flow control None 3 0 0 H2SO4 Flow No PH control malfunctioned Basic solution/bad product 3 3 9 Preform regular lab test for the product Higher PH control malfunctioned Acidic solution/bad product, PH induced corrosion 3 3 9 Preform regular lab test for the product Lower PH control malfunctioned Basic solution/bad product 3 3 9 Preform regular lab test for the product Item: Back wash sand filter Storm water flow into filter No Frozen Pipe None 4 0 0 None Plugged Pipe Pump malfunctioned Higher Improper flow control Pressure build up 3 4 12 Flow rate meter for monitoring Storm water flow Lower Improper flow control None 3 0 0 None Percipate removal Lower Sand was not regenerated in time crustation/ Pump damages 2 4 8 Strict maintenance scheduel Pressure Higher Storm water flow above normal Equipment rapture hazard 3 4 12 Flow rate meter for monitoring Storm water flow Lower Leakage None 1 0 0 None Pump malfunctioned Temperature Higher Heat exchange malfunctioned None 1 0 0 None
  • 13. Lower Heat exchange malfunctioned None 1 0 0 None Item: Pumps Storm water flow into pumps No Frozen Pipe Cavitation in pump 4 2 8 Implement flow control Plugged Pipe Pump malfunctioned Pressure Loss Pump was not primed Pump Caviation 1 2 2 Flow rate meter for monitoring Storm water flow High Excess friction from blocked pipe Pressure build up 4 3 12 Pressure relief valve Control valve malfunctioned Temperature Higher Heat exchanger malfunctioned Cavitation in pump 1 2 2 Flow rate meter for monitoring Storm water flow Item: Pipe Blockage No Frozen Pipe Pressure build up 4 3 12 Implement flow control Plugged Pipe Pressure relief valve Pump malfunctioned Precipatation on the pipe wall Signific ant Incrustation Pressure build up 2 3 6 Replace pipe if necessary Corrosion Signific ant failed PH control Leakage 3 3 9 Use Polyethylene or Fiber glass pipe Steam generation Signific ant Flow varation Pressure build up 3 3 9 Implement flow control Heat exchanger malfunction Pressure relief valve
  • 15.
  • 16.
  • 17.
  • 18.
  • 19.
  • 20.
  • 22.
  • 23.
  • 24.
  • 25.
  • 26.
  • 28.
  • 29.
  • 30.
  • 31.
  • 32.
  • 33. Appendices Sample Calculation: amount of NaOH required to alkailize 10 m3 /h storm water to pH 11 M http://www.engr.usask.ca/classes/CHE/422/notes/ClassOrientation-Final%20Report%20Jan%202014.pptx http://www.engr.usask.ca/classes/CHE/422/notes/2011/guideforreport.doc