Buy the report "Future of Italian Defense Industry – Market Attractiveness, Competitive Landscape and Forecasts to 2017" at US $4650 for a Single User PDF License from RnR Market Research Reports Library.The Italian Defense Industry Market Opportunities and Entry Strategies, Analyses and Forecasts to 2017offers the reader an insight into the market opportunities and entry strategies adopted by foreign original equipment manufacturers (OEMs) to gain market share in the Italian defense industry.
Italian Defense Industry Market Attractiveness and Forecasts to 2017
1. RnR Market Research Offers “Future of Italian Defense Industry – Market Attractiveness,
Competitive Landscape and Forecasts to 2017” Report at US$ 1250 (Single User License).
The report got published in Sep 2012 & Contains 148 Pages.
This report offers insights into the market opportunities and entry strategies adopted by foreign OEMs
(original equipment manufacturers) to gain a market share in the Italian defense industry. In particular, it
offers in-depth analysis of the following:
- Market opportunity and attractiveness
- Procurement dynamics
- Industry structure
- Market entry strategy
- Competitive landscape and strategic insights
- Business environment and country risk
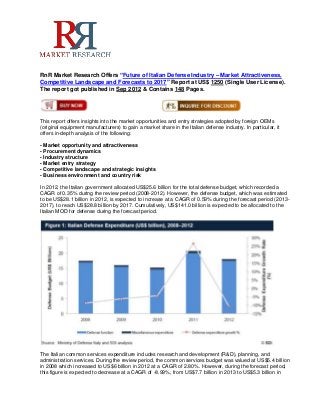
In 2012, the Italian government allocated US$25.6 billion for the total defense budget, which recorded a
CAGR of 0.35% during the review period (2008-2012). However, the defense budget, which was estimated
to be US$28.1 billion in 2012, is expected to increase at a CAGR of 0.59% during the forecast period (2013-
2017), to reach US$28.8 billion by 2017. Cumulatively, US$141.0 billion is expected to be allocated to the
Italian MOD for defense during the forecast period.
The Italian common services expenditure includes research and development (R&D), planning, and
administration services. During the review period, the common services budget was valued at US$5.4 billion
in 2008 which increased to US$6 billion in 2012 at a CAGR of 2.80%. However, during the forecast period,
this figure is expected to decrease at a CAGR of -8.99%, from US$7.7 billion in 2013 to US$5.3 billion in
2. 2017. The gradual decline in expenditure on common services can be attributed to the gradual completion of
a number of training and R&D programs that are to be executed over the forecast period. The Italian Army’s
budget accounted for 33.2% of the overall defense function in 2012, followed by the Air force at 18.1%, and
the Navy at 14.2%.
The Air force is expected to grow at the fastest rate during forecast period with expenditure in 2013 valued
at US$3.3 billion, which is anticipated to grow at an estimated CAGR of 7.30% to reach US$4.4 billion in
2017. This high rate of growth is expected to be fuelled by the continuing procurement of Fighter planes and
Multi Role Aircraft over the forecast period.
Inquire For Disocunt @ http://www.rnrmarketresearch.com/contacts/discount?rname=80184
Reasons to buy
- Includes trend analysis of imports and exports, together with their implications and impact on the Italian
defense industry.
- Provides detailed analysis of the current industry size and growth expectations from 2013 to 2017,
including highlights of key growth stimulators, and also benchmarks the industry against key global markets
and provides a detailed understanding of emerging opportunities in specific areas.
- The report uncovers the business outlook, key challenges, and opportunities identified by suppliers and
buyers, enabling industry stakeholders to understand the business sentiment prevailing in the industry.
Allows marketing agencies in the industry to promote their business by aligning their capabilities and
business practices with their customers’ changing needs, while it also helps suppliers to benchmark their
efforts with those of their competitors.
Buy a Report Copy @ http://www.rnrmarketresearch.com/contacts/purchase?rname=80184
Table of Content
1 Introduction
1.1. What is this Report About?
1.2. Definitions
1.3. Summary Methodology
1.4. SDI Terrorism Index
1.5. About Strategic Defence Intelligence
2 Executive Summary
3 Market Attractiveness and Emerging Opportunities
3.1. Defense Market Size Historical and Forecast
3.1.1. Italy's annual defense expenditure to reach US$XX billion by 2017
3.1.2. Modernization of armed forces and participation in international peacekeeping missions are major
drivers of defense expenditure
3.1.3. Defense expenditure as a percentage of GDP expected to decline to XX% of GDP by 2017
3.2. Analysis of Defense Budget Allocation
3.2.1. Capital expenditure allocation to increase during the forecast period
3.2.2. A cumulative US$XX billion expected to be spent on military procurements during the forecast period
3.2.3. Army receives the majority of defense function budget
3.2.4. Army expenditure expected to reach US$XX billion by 2017
3.2.5. Cumulative navy expenditure expected to reach US$XX billion during the forecast period
3.2.6. Air force expenditure expected to grow at a CAGR of XX% during the forecast period
3.2.7. Common services expenditure expected to decline to US$XX billion by 2017
3.3. Homeland Security Market Size and Forecast
3.3.1. Homeland security expenditure expected to reach US$XX billion by 2017
3. 3.3.2. Terrorist threats, mafia wars and internal insurgent organizations expected to increase homeland
security expenditure
3.3.3. Italy faces “some risk” of terrorism
3.3.4. Italy has a score of XX on the SDI Terrorism Index
3.4. Benchmarking with Key Global Markets
3.4.1. Italy has one of the largest defense industries in the world
3.4.2. Italy has the tenth largest defense budget in the world
3.4.3. France allocates a greater percentage of GDP for defense than Italy
3.4.4. Italy ranked seventh among top arms exporting countries over the review period
3.5. Market Opportunities: Key Trends and Growth Stimulators
3.5.1. C4-ISTAR systems to witness a stable demand in the forecast period
3.5.2. Italy to spend on joint development projects for missile defense systems
3.5.3. Advance weapon systems and armory required for various peacekeeping initiatives
3.5.4. Air force to develop, Modernize and acquire new fighter, patrol and training aircraft
3.5.5. Naval force to be upgraded with submarines, frigates and aircraft carriers
3.5.6. The mobility of land forces to be improved to enhance efficiency for international missions
3.5.7. Italian MoD to expand airborne C4ISR capabilities
4 Defense Procurement Market Dynamics
4.1. Import Market Dynamics
4.1.1. Defense imports expected to grow significantly in the forecast period
4.1.2. The US entered the Italian defense market, which was previously dominated by the European
countries
4.1.3. Missiles, ships, aircraft and engines are the main import categories
4.2. Export Market Dynamics
4.2.1. Defense exports increased during 2009-2011
4.2.2. India and the US are the major arms importers of Italian defense products
4.2.3. Italy has multiple defense export partners
4.2.4. Aircraft, ships, sensors and missiles account for majority of exports
5 Industry Dynamics
5.1. Five Forces Analysis
5.1.1. Bargaining power of Supplier: Low to Medium
5.1.2. Bargaining power of Buyer: Medium
5.1.3. Barrier to entry: Medium to High
5.1.4. Intensity of rivalry: Low to High
5.1.5. Threat of Substitution: Low to High
6 Market Entry Strategy
6.1. Market Regulation
6.1.1. Offset policy aids development of domestic defense industry
6.1.2. Defense sector is not open for foreign investors in the interest of national security
6.2. Market Entry Route
6.2.1. Technology transfer provides good market entry opportunities
6.2.2. Research and development collaborations offer market access
6.2.3. Joint ventures, partnerships and licensing agreements open new market entry strategy choices
6.3. Key Challenges
6.3.1. Defense budget cuts across Europe challenge domestic defense companies
6.3.2. Policy to buy European equipment discourages non-European defense suppliers
7 Competitive Landscape and Strategic Insights
7.1. Competitive Landscape Overview
7.2. Key Domestic Companies
7.2.1. Finmeccanica: overview
7.2.2. Finmeccanica: products and services
7.2.3. Finmeccanica: recent announcements and strategic initiatives
4. 7.2.4. Finmeccanica: alliances
7.2.5. Finmeccanica: recent contract wins
7.2.6. Finmeccanica: financial analysis
7.2.7. AgustaWestland: overview
7.2.8. AgustaWestland: products and services
7.2.9. AugustaWestland: recent announcements and strategic initiatives
7.2.10. AugustaWestland: alliances
7.2.11. AugustaWestland: recent contract wins
7.2.12. Alenia Aermacchi: overview
7.2.13. Alenia Aermacchi: products and services
7.2.14.Alenia Aermacchi: recent announcements and strategic initiatives
7.2.15.Alenia Aermacchi: alliances
7.2.16.Alenia Aermacchi: recent contract wins
7.2.17.Selex Galileo: overview
7.2.18.Selex Galileo: products and services
7.2.19.Selex Galileo: recent announcements and strategic initiatives
7.2.20.Selex Galileo: alliances
7.2.21.Selex Galileo: recent contract wins
7.2.22.Selex Sistemi Integrati: overview
7.2.23.Selex Sistemi Integrati: products and services
7.2.24.Selex Sistemi Integrati: recent announcements and strategic initiatives
7.2.25.Selex Sistemi Integrati: alliances
7.2.26.Selex Sistemi Integrati: recent contract wins
7.2.27.Oto Melara: overview
7.2.28.Oto Melara: products and services
7.2.29.Oto Melara: recent announcements and strategic initiatives
7.2.30.Oto Melara: alliances
7.2.31.Oto Melara: recent contract wins
7.2.32.Fincantieri: overview
7.2.33.Fincantieri: defense products
7.2.34.Fincantieri: recent announcements and strategic initiatives
7.2.35.Fincantieri: alliances
7.2.36.Fincantieri: recent contract wins
7.2.37.Fincantieri: financial analysis
7.2.38.MBDA: overview
7.2.39.MBDA: defense products
7.2.40.MBDA: recent announcements and strategic initiatives
7.2.41.MBDA: alliances
7.2.42.MBDA: recent contract wins
7.2.43.WASS: overview
7.2.44.WASS: products and services
7.2.45.WASS: alliances
7.2.46.WASS: recent contract wins
7.3.Key Private Companies
7.3.1.Elettronica: overview
7.3.2.Elettronica: products and services
7.3.3.Elettronica: recent announcements and strategic initiatives
7.3.4.Elettronica: alliances
7.3.5.Elettronica: recent contract wins
8 Business Environment and Country Risk
8.1.Demographics and Social Statistics
8.1.1.Population - Female
5. 8.1.2.Population - Male
8.2.Economic Performance
8.2.1.Construction Output, Current Prices, Local Currency
8.2.2.Construction Output, Current Prices, US Dollars
8.2.3.Exports of goods and services, current prices
8.2.4.Fiscal Balance as a percentage of GDP
8.2.5.Foreign Direct Investment
8.2.6.GDP at Purchasing Power Parity
8.2.7.GDP, Constant Prices (Local Currency)
8.2.8.GDP, Constant Prices (US$)
8.2.9.GDP, Current Prices (US$)
8.2.10.General Government Final Consumption Expenditure
8.2.11.Gross Fixed Capital Formation, Current Prices
8.2.12.Imports of goods and services
8.2.13.Interest rate (Lending)
8.2.14.Manufacturing Output, Current Prices (Local Currency Bn)
8.2.15.Manufacturing Output, Current Prices (US$ Billions)
8.2.16.Market cap of Stock Exchange (US$ mn)
8.2.17.US$- Exchange Rate (EoP)
8.2.18.Wholesale Price Index
8.3.Energy and Utilities
8.3.1.Crude Oil Distillation Capacity
8.3.2.Electricity Installed Capacity
8.3.3.Hydroelectricity Installed Capacity
8.3.4.Natural Gas Consumption
8.3.5.Natural Gas Imports
8.3.6.Net Conventional Thermal Electricity Generation
8.3.7.Net Geothermal, Solar, Wind, and Wood Electric Power Generation
8.3.8.Net Hydroelectric Power Generation
8.3.9.Petroleum, Consumption
8.3.10.Petroleum, Production
8.4.Minerals
8.4.1.Coal Consumption
8.4.2.Coal Production
8.5.Social and Political Risk
8.5.1.Political Stability Index
8.6.Technology
8.6.1.Fixed Broadband Internet Subscribers
8.6.2.Gross Domestic Expenditure on Research and Development as % of GDP
8.6.3.Patents Granted
8.6.4.Software Patents
9 Appendix
9.1.Contact Us
9.2.About SDI
9.3.Disclaimer
For more details contact Mr. Priyank Tiwari: sales@rnrmarketresearch.com / +18883915441
Website: http://www.rnrmarketresearch.com/