
Empfohlen
Empfohlen
Weitere ähnliche Inhalte
Was ist angesagt?
Was ist angesagt? (19)
Ähnlich wie The Effect of Capital Structure on Profitability of Energy American Firms:
Ähnlich wie The Effect of Capital Structure on Profitability of Energy American Firms: (20)
Kürzlich hochgeladen
Kürzlich hochgeladen (20)
The Effect of Capital Structure on Profitability of Energy American Firms:
- 1. International Journal of Business and Management Invention ISSN (Online): 2319 – 8028, ISSN (Print): 2319 – 801X www.ijbmi.org || Volume 3 Issue 12 || December. 2014 || PP.54-61 www.ijbmi.org 54 | Page The Effect of Capital Structure on Profitability of Energy American Firms: Mohamed M. Khalifa Tailab (Finance and Investments, Lincoln University, CA, U.S.) ABSTRACT : This paper empirically aims to analyze the effect of capital structure on financial performance. Two main sets of variables were used: For profitability, return on assets (ROA) as the ratio of net income to total assets, and return on equity (ROE) as the ratio of net income to total shareholders’ equity were adopted as a proxy for financial performance; and to indicate capital structure, short-term debt, long-term debt, total debt, debt to equity ratio, and firm’s size were used. A sample of 30 Energy American firms for a period of nine years from 2005 – 2013 was considered. Secondary data were collected from financial statements which were taken from Mergent online. The data were analyzed by using Smart PLS (Partial Least Square) version 3. Multiple regressions indicated that 10% of ROE and 34% of ROA were predicted by the independent variables. Findings also presented that the total debt has a significant negative impact on ROE and ROA, while size in terms of sales has significantly negative effect only on ROE of the American firms. However, a short debt significantly has a positive influence on ROE. An insignificant either negative or positive relationship was observed between long term debt, debt to equity and size in terms of total assets and profitability. A generalization of the results is limited because of the small sample size. For future research, the author suggests addressing a longer period of time with a large sample size of firms. It would be more accurate if future studies included more independent variables such as taxation and concentration. KEYWORDS: Financial Performance, Capital Structure, Leverage, Return on Equity, Return on Assets, and Profitability. I. INTRODUCTION The capital structure is defined as the combine of debt and equity that the firm utilizes in its operation. It is very commonly known that the value of a firm can be maximized by minimizing its capital cost. Therefore, one of the major goal in current strategic management is to identify the optimal capital structure. The optimal capital structure is existed when the debt and equity can be combined to reduce the cost of capital and enhance the firms’ profitability. If this did not happen, and firm’s manager failed to manage it properly then it is reasonable to expect that the firm’s capital structure would affect firm’s growth and profitability which will further escort to financial distress and finally firms can go bankrupt. Researchers in finance have never yet find a model to determine an optimal capital structure despite the fact that there are many theories tried to explain the capital structure (Gill et al., 2011, P. 3). A number of these theories explain the relationship between cost of capital, and value of the firm. It has been argued that that firms with a high growth rate have a high debt to equity ratio, and it was observed that bankruptcy costs (peroxide by firm size) has an important effect on capital structure (Zeituna and Tianb, 2007). This discussion on the importance of capital structure management, its various components and their impact on profitability leads the author to examine the relationship between capital structure and profitability of the 30 Energy American firms for the nine-year period between 2005 – 2013. Several factors play an important role directly or indirectly in effecting profitability. In this research, and after going through the literature review, profitability is measured and explained by the internal factors (Short-Term Debt, Long-Term Debt, Total Debt, Debt to Equity Ratio, and Firm’s Size). It is hypothesized that these factors have no significant impact on financial performance. This study adopted this tool, which relies on traditional accounting report systems, because it is still being utilized nowadays. The rest of the research is organized as follows: Section two summarizes the results of previous empirical studies Section three specifies the research method, estimation model, and data used in the study. Section four concludes the research II. LITERATURE REVIEW This section sheds some light on previous empirical research. These empirical studies attempted to measure firms' financial performance by analyzing the effect of various financial and non-financial factors. The final results of these studies proved inconsistent in some areas, and consistent in others.
- 2. The Effect Of Capital Structure On Profitability… www.ijbmi.org 55 | Page Performance Measure : Financial performance plays a large role in measuring the success of business firms. Evaluating the firm’s performance has three dimensions: the firms’ productivity, profitability, and market premium (Omondi & Muturi, 2013, p. 100). To this end, there are a plethora of measures of financial performance; such as return on assets (ROA), return on investment (ROI), return on equity (ROE), and operation profit margin (OPM). ROA, which was developed by Dupont (1919), is the most common measure used as a proxy for financial performance (Liargovas, 2008, p. 8; Mishra, Wilson, and Williams, 2009, p.7). The early contribution to empirical literature about profitability analysis began mainly with Bain (1951) who studied the relationship between profitability and structural variables, such as concentration, growth, economics of scales, and advertising. Bain found that concentration had a positive impact on profitability. Mann (1966) supported Bain’s findings when he indicated that there was a positive relationship between concentration and profitability. Additionally, other researchers such as Collins and Perston (1968), Weiss (1974), Porter (1979), Marvel (1980), and Bradburd and Caves (1982) have showed that industry concentration had a positive effect on profitability (Elmendorf, p.62). In the stock market, Ghosh, Nag, and Sirnmans (2000) confirmed that ROA is widely used by market analysts as a measure of financial performance, as it measures the efficiency of assets in producing income. In another field, Mishra et al. (2009) indicated that returns on assets (ROA), a measure of financial performance commonly utilized in the farm management literature, is the ratio of net farm income plus interest payment to total assets. Because many researchers adopted and used return on assets to measure the firm’s financial performance, the current study also uses ROA as the dependent variable for analysis. Economic Variables : The modern theory of capital structure was developed by Modigliani and Miller, (1958) who pointed out that capital structure had no impact on firm value. In 1963, Modigliani & Miller discussed the impact of tax firms on the valuation of firms. They indicated that because of debt tax shields, leveraged firms had value higher than firms without debt. This result had much subsequent discussion by Stiglitz (1969) who showed that if the rate of debt went up, the value of the firm would decrease, because of the existence of the risk of bankruptcy. On the other hand, it was indicated that an increased level of leverage tends to raise the value of firm because of tax savings (Pathirawasam 2013, p.65). Although the relationship between capital structure and financial performance of a firm can be either negative or positive (Pathirawasam, 2013, p. 65), Umer (2014) confirmed that the majority of empirical studies showed that a capital structure had a negative correlation with profitability. For example, Titman (1988) found that levels of debt had a negative influence of firms’ financial performance. This result was supported by Rajan and Zingales (1995) who addressed that profitability was negatively correlated with leverage. However, Gill, Biger, and Mathur (2011) indicated that short-term debt to total assets; long-term debt to total assets; and total debt to total assets had positive impact on profitability. Gill, Biger, and Mathur (2011) presented that the impact of short-term debt to total assets and total debt to assets on ROA was positive in both the service and manufacturing industries, whereas Omondi &Muturi (2013) showed that leverage had a significant negative effect on financial performance. Likewise, by examining the impact of adjustment in capital structure, Bouraoui and Louri (2014) addressed that leverage changes have a negative impact on performance. Although many theories have already been developed to explain the firms’ debt structure, there is still no consensus theory that managers can rely on to determine an optimal level of debt (Ben Ayed and Zouari, 2014, p. 96). III. RESEARCH METHOD Model Specification : This study adopted return on equity (ROE) and return on assets (ROA) as dependent variables for measuring firms’ financial performance, while a set of independent variables with difference expected signs were used to measure the effect on firms’ profitability. Table 1.Variables definition and predicted relationship Variables Full name Measure Signs* Dependent ROA Return on Assets Net Income / Total Assets ROE Return on Equity Net Income / Total Shareholders’ Equity Independent STD Short-Term Debt Current Liabilities / Total assets +/- LTD Long-Term Debt Long term Liabilities / Total Assets +/- TD Total Debt Total Liabilities / Total assets +/- DER Debt to Equity Total Liabilities / Total Equity +/- SZ1 Size1 Log of total sales + SZ2 Size2 Log of total assets + * After going through the literature review, the author expected either a positive or negative sign on profitability The conceptual framework of this study is shown in Figure 1, which explains the direct effect of each independent variable on the dependent variables.
- 3. The Effect Of Capital Structure On Profitability… www.ijbmi.org 56 | Page Figure 1. Hypothesized Relations among variables Note: ROE = return on equity; ROA = return on assets; STD = short-term- debt; LTD = long- term- debt; TD = total debt, DER = debt equity ratio; Size1=log of sales, Size2= log of assets. According to this relationship, and consistent with the previous literature and empirical research, the following null hypotheses were developed to test the relationship between a firm’s financial performance and the independent variables: So, If capital structure has an impact on firm’s performance , then a strong correlation among profitability and capital structure can be existed. H01a: Short-Term Debt (STD) has no significant impact on performance of firm ROE. H01b: Short-Term Debt (STD) has no significant impact on performance of firm ROA. H02a: Long-Term Debt (LTD) has no significant impact on performance of firm ROE. H02b: Long-Term Debt (LTD) has no significant impact on performance of firm ROA. H03a: Total Debt (TD) has no significant impact on performance of firm ROE. H03b: Total Debt (TD) has no significant impact on performance of firm ROA. H04a: Debt to Equity (DER) has no significant impact on performance of firm ROE. H04b: Debt to Equity (DER) has no significant impact on performance of firm ROA. H05a: Company Size in terms of sales (SZ1) has no significant impact on performance of firm ROE H05b: Company Size in terms of sales (SZ1) has no significant impact on performance of firm ROA. H06a: Company Size in terms of assets (SZ2) has no significant impact on performance of firm ROE. H06b: Company Size in terms of assets (SZ2) has no significant impact on performance of firm ROA Sample and Data Selection : The empirical goal of this research is to investigate the impact of capital structure on profitability of energy American firms. To analyze some factors, the initial research sample consisted of 30 Energy U.S. firms for the period from 2005 to 2013. Each of these firms was classified as an active firms, and compute inside the U.S. 270 data observations (30 firms x 9 years) between 2005 and 2013 were employed as a sample for this study. The secondary data for this research were collected from annual financial reports which were taken from Mergent online (http://www.mergentonline.com/login.php). The data were analyzed by using Smart PLS (Partial Least Square) version 3, and the hypotheses were tested at (α = 0.05) level of significance (0.95 confidence level). IV. EMPIRICAL RESULTS AND DISCUSSION This section gives detailed information on the results of this study, with sophisticated discussion. In this section, we examined the factors likely to affect the financial performance measured by ROE, and ROA. Fig. 2 shows the regression model with respect to the ROE and ROA have an R2 of 10% and 34% respectively (R2 : ROE = 0.10; ROA = 0.337). This indicated that 10% variation in Return on equity was influenced by independent variables (short debt, long debt, total debt, debt to equity and firm’s size.). Note that the predictor ROA ROE STD LTD SZ1 TD DER Financial Factors Non-Financial Factors +/- +/- +/- + +/- SZ2 +
- 4. The Effect Of Capital Structure On Profitability… www.ijbmi.org 57 | Page variables did not explain Return on Equity (ROE) very well, because the value of R2 was quite low (10%). Here it can be seen that the remaining 90% can be explained by other variables which were not included in this study. Figure 2: PLS Path Estimates: Partial Least Square Algorithm Unlike the ROE, Fig.2 indicated that about 34% of ROA was explained by the independent variables. Statistically, 34% is acceptable to predicate the value of ROA by these explanatory variables. The research hypotheses were tested by using Smart PLS (Partial Least Square) at (α = 0.05) level of significance (0.95 confidence level). So, if t value is higher than 1.96, then the null hypotheses will be rejected and the alternative one should be accepted. However, if t value is smaller than 1.96 the null hypotheses will be accepted (See Fig 3). Path STD → Financial Performance: Performed the bootstrapping, the results showed for the path STD → ROE (p = 0. 016 < 0.05, see table 2), hypothesis H01a, a t-value equal to (t = 2.422 > 1.96); for the path STD → ROA (p = 0.109 > 0.05), hypothesis H01b, a t-value equal to (t = 1.606 < 1.96). Therefore, the H01a which said that STD has no significant effect on ROE must be rejected while the H01b that STD has no significant impact on ROA must be accepted. Path LTD → Financial Performance : The findings addressed for the path LTD → ROE (p = 0.271 > 0.05), hypothesis H02a, a t-value equal to (t = 1.103 < 1.96); for the path LTD → ROA (p = 0.247 > 0.05), hypothesis H02b, a t-value equal to (t = 1.159 < 1.96). These results confirmed that null hypotheses that LTD has no significant influence on financial performance must be accepted. Path TD → Financial Performance: The result also pointed out for the path TD → ROE (p = 0.003< 0.05), H03a has a t-value higher than 1.96 ( t = 2.991) while for the path TD → ROA (p = 0.000 < 0.05). It can be confirmed that null hypothesis that TD has no significant effect on profitability can be rejected.
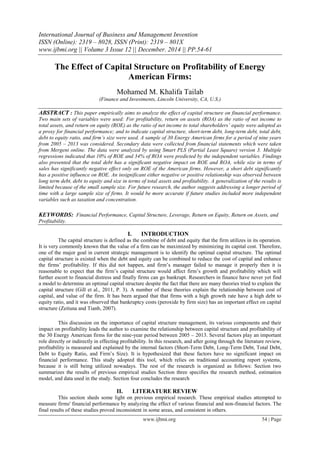
- 5. The Effect Of Capital Structure On Profitability… www.ijbmi.org 58 | Page Figure 3: PLS Test Hypotheses: Partial Least Square Bootstrapping Path DER → Financial Performance : Fig 3 showed for the path DER → ROE (p = 0.359 > 0.05), hypothesis H04a, a t value (t = 0.918 < 1.96) while for the path DER → ROA (p = 0.055 > 0.05), hypothesis H03b, at value (t = 1.920 < 1.96). Thus, both H03a and H04b must be accepted so that DER has no significant effect on the profitability of energy firms. Path SZ1 → Financial Performance : Fig. 3 demonstrated for the path SZ1 → ROE (p = 0.043* < 0.05), hypothesis H05a, a t value (t = 2.027 > 1.96). Thus, the null hypothesis that size in terms of sales has no significant impact on ROE can be rejected while for the path SZ1 → ROA (p = 0.098 > 0.05), hypothesis H05b, a t value (t = 1.659 < 1.96). Thus, we can accept the null hypothesis that size in terms of sales has no significant influence on ROA. Path SZ2 → Financial Performance :The result illustrated for the path SZ2 → ROE (p = 0.196 > 0.05) hypothesis H06, a t value (t = 1.296 < 1.96) and for the path SZ2 → ROA (p = 0.375 > 0.05), hypothesis H06b, a t value (t = 0.888 < 1.96). So, the null hypothesis that size of firm in terms of assets has no significant impact on performance of firm must be accepted. Table 2 showed the outcome that can be utilized to answer and explain the proposed hypotheses in this study. Based on the results demonstrated in this table, STD with positive coefficient (0.283) was significantly related to ROE. It means that one unit changes in STD tends to increase the return on equity by (0.283). this result agreed with previous work by Gill, Biger, and Mathur (2011) who indicated that short-term debt had a positive impact on profitability. Figure 2.The Results of Hypothesis Testing The Relationships Null hypotheses Coefficient T Statistics P Values Notes STD -> ROE H01a 0.283 2.422 > 1.96 0.016** < 0.05 Significant STD -> ROA H01b 0.184 1.606 < 1.96 0.109 > 0.05 No significant LTD -> ROE H02a -0.130 1.103 < 1.96 0.271 > 0.05 No significant LTD -> ROA H02b -0.139 1.159 < 1.96 0.247 > 0.05 No significant TD -> ROE H03a -0.373 2.991 > 1.96 0.003** < 0.05 Significant TD -> ROA H03b -0.784 6.077 > 1.96 0.000** < 0.05 Significant DER -> ROE H04a 0.097 0.918 < 1.96 0.359 > 0.05 No significant DER -> ROA H04b 0.163 1.920 < 1.96 0.055 > 0.05 No significant SZ1 -> ROE H05a -0.281 2.027 > 1.96 0.043** < 0.05 Significant SZ1 -> ROA H05b -0.221 1.659 < 1.96 0.098 > 0.05 No significant SZ2 -> ROE H06a 0.211 1.296 < 1.96 0.196 > 0.05 No significant SZ2 -> ROA H06b 0.125 0.888 < 1.96 0.375 > 0.05 No significant **significant at (α = 0.05), **p< 0.05
- 6. The Effect Of Capital Structure On Profitability… www.ijbmi.org 59 | Page The findings, however, indicated a negative significant coefficient association between DT and financial performance measured by ROE and ROA. This implies that that one unit increases in TD tends to decrease the return on equity by (-0.373), and an increase in TD position is associated with a decline in return on assets ROA by (-0.784). Likewise, the profitability will be decreased by (-0.281), if the size of firm in terms of sales goes up by one unit. This confirmed that debts are usually more expensive than equity. So, the higher debt, the lower portability. V. CONCLUSION Capital structure is a very sensitive subject in the field of financial management because it partly affects its profitability. Thus, the intended aim of conducting this study was to investigate the impact of capital structure (short-term- debt, long- term- debt, total debt, debt equity ratio, and firm size) on financial performance as measured by return on equity (ROE) and return on assets (ROA) for a period of nine years starting in 2005. It was hypostasized that these factors are not significantly associated with firm’s profitability. The main result indicated that the total debt has a significant negative impact on ROE and ROA, while size in terms of sales has significantly negative effect only on ROE of the American firms. However, a short debt significantly has a positive influence on ROE. An insignificant either negative or positive relationship was observed between long term debt, debt to equity and size in terms of total assets and profitability. These results cannot be generalized because of a small size of sample. Energy American firms should be able to manage and service their debts. So, it might be instructive to conduct the same or a similar study by analyzing other capital structure factors, such as taxation, and concentration. ACKNOWLEDGEMENTS While writing this paper, I received help and advices from Professor Marshall Burak, and without him this research could not have been finished. Mentioning him here is the least I can do to express my gratitude to Professor Marshall Burak. REFERENCES [1] Agarwal, R., & Gort, M. (2002, May). Technological Change: Firm and Product Life Cycles and Firm Survival. The American Economic Review, 92(2), 184-190. [2] AL-Shwiyat, Z. M. (2013, August). Affecting Factors on the Timing of the Issuance of Annual Financial Reports Empirical Study on the Jordanian Public Shareholding Companies. European Scientific Journal, 9(22), 407-423. [3] Almajali, A. Y., Alamro, S. A., & Al-Soub, Y. Z. (2012). Factors Affecting the Financial Performance of Jordanian Insurance Companies Listed at Amman Stock Exchange. Journal of Management Research, 4(2), 266- 289.http://dx.doi.org/10.5296/jmr.v4i2.1482 [4] Babalola, Y. Y. (2013). The Effect of Firm Size on Firms Profitability in Nigeria. Journal of Economics and Sustainable Development, 14(5), 90-95. [5] Bain, J. S. (1951, August). Relation of Profit Rate to Industry Concentration: American Manufacturing, 1936-40. Quarterly Journal of Economics. 65(3), 293-324. .http://www.jstor.org/stable/1882217. [6] Barbosa, N., & Louri, H. (2005, August). Corporate Performance: Does Ownership Matter? A Comparison of Foreign- and Domestic-Owned Firms in Greece and Portugal. Review of Industrial Organization, 27(1), 73-102. [7] Barrow, M. (2006). Statistics for Economics, Accounting and Business Studies (fourth ed.). UK.: Longman Group UK Limited. [8] Ben Ayed, W. H., & Zouari, S. G. (2014, April). Capital Structure and Financing of SMEs: The Tunisian Case. International Journal of Economics and Finance, 6(5), 96-111. [9] Bouraoui, T., & Li, T. (2014, January/February). The Impact Of Adjustment In Capital Structure In Mergers & Acquisitions On Us Acquirers’ Business Performance. The Journal of Applied Business Research, 30(1), 27-41. [10] Chambers, A. E., & Penman, S. H. (1984, Spring). Timeliness of Reporting and the Stock Price Reaction to Earnings Announcements. Journal of Accounting Research. 22(1), 21-47. [11] Chhibber, P. K., & Majumdar, S. K. (1997, April). Foreign ownership and profitability: property rights, control and the performance of firms in Indian Industry. Journal of Law and Economics, 46(3), 209–238. [12] Chhibber, P. K., & Majumdar, S. K. (1999, April). Foreign Ownership and Profitability: Property Rights, Control, and the Performance of Firms in Indian Industry. Journal of Law and Economics, 42(1), 209-238. [13] Comanor, S. w., & Wilson, T. A. (n.d.). Avertising Market Structure and performance. [14] Elmendorf, R. G. (n.d.). Accounting Rates of Return as proxies for the economic rate of return: an empirical investigation. Journal of Applied Business Research, 9(3), 62-75. [15] Fairfield, P. M., & Yohn, T. L. (2001, December). Using Asset Turnover and Profit Margin to Forecast Changes in Profitability. Review of Accounting Studies, 6(4), 371-385. [16] Fiegenbaum, A., & Karnani, A. (1991, February). Output flexibility—A competitive advantage for small
- 7. The Effect Of Capital Structure On Profitability… www.ijbmi.org 60 | Page firms. Strategic Management Journal, 12(2), 101-114. [17] Ghosh, C., Nag, R., & Sirnmans, C. F. (2000). The Pricing of Seasoned Equity Offerings: Evidence from REITs. Real Estate Economics, 28(3), 363-384. [18] Gill, A., Biger, N., & Mathur, N. (2011, December). The Effect of Capital Structure on Profitability: Evidence from the United States. International Journal of Management, 28(4). [19] Goddard, J., Tavakoli, M., & Wilson, J. (2005, December). Determinants of profitability in European manufacturing and services: evidence from a dynamic panel model. Applied Financial Economics, 15(18), 1269-1282. [20] Gujarati, D. N. (2003). Basic econometrics (Fourth edition ed.). McGraw-Hill, New Yo: McGraw-Hill. [21] Jovanovic, B. (1982, May). Selection and the Evolution of Industry. Econometrica, 50(3), 649-670. [22] Koumanakos, D. P. (2008, June). The effect of inventory management on firm performance. International Journal of Productivity & Performance Management. 57(5), 355-369. [23] Kumar, J. (2004). Agency Theory and Firm Value in India. 1-43. [24] Lamberg, L. (2009). Impact of Liquidity Management on Profitability: a study of the adaptation of liquidity strategies in a financial crisis. 1-92. [25] Lee, J. (2009). Does Size Matter in Firm Performance? Evidence from US Public Firms. International Journal of the Economics of Business, 16(2), 189-203. [26] Liargovas, P. (2008). Factors Affecting Firm Competitiveness: The Case of Greek Industry. 1-35. [27] Liargovas, P. G., & Skandalis, K. S. (2010). Factors affecting firms' performance: the case of Greece. [28] Loderer, C., Neusser, K., & Waelchli, U. (2009). Firm Age and Survival. [29] Mann, H. M. (1966, August). Seller Concentration, Barriers to Entry and Rates of Return in Thirty Industries, 1950-1960. Review of Economics & Statistics., 48(3), 296-307. [30] Mishra, A., Wilson, C., & Williams, R. (2009). Factors affecting financial performance of new and beginning farmers. Agricultural Finance Review, 69(2), 160-179. [31] Mishra, A., Wilson, C., & Williams, R. (2009). Factors affecting financial performance of new and beginning farmers. Agricultural Finance Review, 69(2), 160-179. [32] Modigliani, F., & Miller, M. M. (1958, june). The cost of capital, corporation finance and the theory of investment. American Economic Review, 48(3), 261-297. [33] Neibergs, J. S. (1998). Macroeconomic Conditions and Agribusiness Profitability: An Analysis Using Pooled Data. International Food and Agribusiness Management Review, 1(1), 91-105. [34] Nunes, P. M., & Serrasqueiro, Z. S. (2008). Performance and size: empirical evidence from Portuguese SMEs. Small Business Economics, 31(2), 195 – 217. [35] Ogbo, A. I., Victoria, O. I., & Ukpere, W. I. (2014, June). The Impact of Effective Inventory Control Management on Organisational Performance: A Study of 7up Bottling Company Nile Mile Enugu, Nigeria. Mediterranean Journal of Social Sciences, 5(10), 109-118. [36] Omondi, M. M., & Muturi, W. (2013). Factors Affecting the Financial Performance of Listed Companies at the Nairobi Securities Exchange in Kenya. Research Journal of Finance and Accounting, 4(15), 99- 105. [37] Padachi, K. (2006, October). Trends in Working Capital Management and its Impact on Firms’ Performance: An Analysis of Mauritian Small Manufacturing Firms. International Review of Business Research Papers, 2(2), 45 -58. [38] Panigrahi, A. K. (2013, July). Relationship between Inventory management and profitability: An Empirical Analysis of Indian Cement Companies. Asia Pacific Journal of Marketing & Management Review, 2(7), 107-120. [39] Pathirawasam, C. (2013). Internal Factors which Determine Financial Performance of firms: With Special Reference to Ownership Concentration. 62-72. [40] Rajan, R. G., & Zingales, L. (1995, December). What Do We Know about Capital Structure? Some Evidence from International Data. The Journal of Finance, 50(5), 1421–1460. [41] Saleem, Q., & Rehman, R. U. (2011, July). Impacts of liquidity ratios on profitability: Case of oil and gas companies of Pakistan. Interdisciplinary Journal of Research in Business, 1(7), 95-98. [42] Saleem, Q., & Ur Rehman, R. (2011, July). Impacts of liquidity ratios on profitability (Case of oil and gas companies of Pakistan). Interdisciplinary Journal of Research in Business, 1(7), 95-98. [43] Schumacher, S. K., & Boland, M. A. (2005, February). The Persistence of Profitability among Firms in the Food Economy. American Journal of Agricultural Economics. 87(1), 103-115. [44] Selling, T. I., & Stickney, C. P. (1989, January). The Effects of Business Environment and Strategy on a Firm's Rate of Return on Assets. Financial Analysts Journal, 45(1), 43-52. [45] Stiglitz, J. E. (1969, December). A Re-Examination of the Modigliani-Miller Theorem. American Economic Review., 59(5), 784-794. [46] Sutton, J. (1997, March). Gibrat's Legacy. Journal of Economic Literature, 35(1), 40-59. [47] Titman, S. (1988, March). The Determinants of Capital Structure Choice. The Journal of Finance, 43(1), 1- 19. [48] Trejo-Pech, C. O., Weldon, R. N., & House, L. A. (2008, Fall). Earnings, Accruals, Cash Flows, and EBITDA for Agribusiness Firms. Agricultural Finance Review, 68(2), 301-319.
- 8. The Effect Of Capital Structure On Profitability… www.ijbmi.org 61 | Page [49] Umer, U. M. (2014). Determinants of Capital Structure: Empirical Evidence from Large Taxpayer Share Companies in Ethiopia. International Journal of Economics and Finance;, 6(1), 53-65. [50] Zeituna, R., & Tianb, G. G. (2007). Capital structure and corporate performance: evidence from Jordan. The Australasian Accounting Business & Finance Journal, 1 (4), 38-61. Appendix (A) Descriptive Statistics Year Mean Median St.D Variance Kurtosis Skewness Min Max Count 2005 ROE 0.24 0.25 0.12 0.02 0.28 0.71 0.07 0.54 30 ROA 0.09 0.11 0.06 0.00 (1.08) 0.39 0.02 0.21 30 2006 ROE 0.24 0.24 0.13 0.02 1.66 1.27 0.07 0.60 30 ROA 0.10 0.10 0.06 0.00 0.16 0.75 0.02 0.27 30 2007 ROE 0.22 0.21 0.09 0.01 4.76 1.48 0.07 0.56 30 ROA 0.08 0.07 0.05 0.00 (0.35) 0.74 0.03 0.20 30 2008 ROE 0.08 0.16 0.40 0.16 23.25 (4.61) (1.92) 0.40 30 ROA 0.04 0.04 0.12 0.01 12.49 (2.89) (0.47) 0.20 30 2009 ROE 0.09 0.11 0.12 0.01 2.13 (0.62) (0.24) 0.39 30 ROA 0.04 0.03 0.05 0.00 1.20 0.23 (0.06) 0.16 30 2010 ROE 0.10 0.14 0.14 0.02 5.73 (1.41) (0.39) 0.44 30 ROA 0.04 0.04 0.05 0.00 1.79 0.39 (0.07) 0.19 30 2011 ROE 0.16 0.15 0.07 0.01 1.43 0.76 0.02 0.37 30 ROA 0.06 0.05 0.04 0.00 0.84 1.00 0.01 0.18 30 2012 ROE 0.14 0.12 0.08 0.01 (0.33) 0.61 0.03 0.30 30 ROA 0.06 0.05 0.04 0.00 0.55 1.04 0.01 0.17 30 2013 ROE 0.12 0.12 0.05 0.00 1.20 (0.53) (0.02) 0.20 30 ROA 0.05 0.04 0.03 0.00 (0.56) 0.57 - 0.12 30