SlideShare ist ein Scribd-Unternehmen logo
1 von 10
Figures from 2006 TEA/AECOM Theme Index
Rank Park/Location Attendance
2006 2006
1 Magic Kingdom, Walt Disney World, Lake Buena Vista, FL, USA 16,640,000
2 Disneyland, Anahaim, CA, USA 14,730,000
3 Tokyo Disneyland, Tokyo, Japan 12,900,000
4 Tokyo DisneySea, Tokyo, Japan 12,100,000
5 Disneyland Paris, Marne-La-Valle, France 10,600,000
6 EPCOT, Walt Disney World, Lake Buena Vista, FL, USA 10,460,000
7 Disney-MGM Studios, Walt Disney World, Lake Buena Vista, FL, USA 9,100,000
8 Disney's Animal Kingdom, Walt Disney World, Lake Buena Vista, FL, USA 8,910,000
9 Universal Studios Japan, Osaka, Japan 8,500,000
10 Everland, Kyonggi-Do, South Korea 7,500,000
11 (tie) Universal Studios Florida, Orlando, FL, USA 6,000,000
11 (tie) Blackpool Pleasure Beach, England 6,000,000
13 Disney's California Adventure, Anaheim, CA, USA 5,950,000
14 SeaWorld Orlando, Orlando, FL, USA 5,740,000
15 Lotte World, Seoul, South Korea 5,500,000
16 Yokohama Hakkeijma Sea Paradise, Yokohama, Japan 5,400,000
17 Universal's Islands of Adventure, Orlando, FL, USA 5,300,000
18 Hong Kong Disneyland, Hong Kong SAR, China 5,200,000
19 Universal Studios Hollywood, Universal City, CA, USA 4,700,000
20 Tivoli Gardens, Copenhagen, Denmark 4,396,000
21 Ocean Park, Hong Kong SAR, China 4,380,000
22 Busch Gardens Tampa Bay, Tampa, FL, USA 4,360,000
23 SeaWorld San Diego, San Diego, CA, USA 4,260,000
24 Europa-Park, Rust, Germany 3,950,000
25 Nagashima Spa Land, Kuwana, Japan 3,910,000
Figures from 2007 TEA/AECOM Theme Index
Rank Park/Location Attendance Change
2007 2006 2007 2006
1 1 Magic Kingdom, Walt Disney World, Lake Buena Vista, FL, USA 17,060,000 16,640,000 0.02524
2 2 Disneyland, Anahaim, CA, USA 14,870,000 14,730,000 0.95%
3 3 Tokyo Disneyland, Tokyo, Japan 13,906,000 12,900,000 7.80%
4 4 Tokyo DisneySea, Tokyo, Japan 12,413,000 12,100,000 2.59%
5 5 Disneyland Paris, Marne-La-Valle, France 12,000,000 10,600,000 13.21%
6 6 EPCOT, Walt Disney World, Lake Buena Vista, FL, USA 10,930,000 10,460,000 4.49%
7 7 Disney's Hollywood Studios, Walt Disney World, Lake Buena Vista, FL, USA 9,510,000 9,100,000 4.51%
8 8 Disney's Animal Kingdom, Walt Disney World, Lake Buena Vista, FL, USA 9,490,000 8,910,000 6.51%
9 9 Universal Studios Japan, Osaka, Japan 8,713,000 8,500,000 2.51%
10 10 Everland, Kyonggi-Do, South Korea 7,200,000 7,500,000 -4.00%
11 11 (tie) Universal Studios Florida, Orlando, FL, USA 6,200,000 6,000,000 3.33%
12 14 SeaWorld Orlando, Orlando, FL, USA 5,800,000 5,740,000 1.05%
13 13 Disney's California Adventure, Anaheim, CA, USA 5,680,000 5,950,000 -4.54%
14 11 (tie) Blackpool Pleasure Beach, England 5,500,000 6,000,000 -8.33%
15 17 Universal's Islands of Adventure, Orlando, FL, USA 5,430,000 5,300,000 2.45%
16 21 Ocean Park, Hong Kong SAR, China 4,920,000 4,380,000 12.33%
17 16 Yokohama Hakkeijma Sea Paradise, Yokohama, Japan 4,770,000 5,400,000 -11.67%
18 19 Universal Studios Hollywood, Universal City, CA, USA 4,700,000 4,700,000 0.00%
19 22 Busch Gardens Tampa Bay, Tampa, FL, USA 4,400,000 4,360,000 0.92%
20 23 SeaWorld San Diego, San Diego, CA, USA 4,260,000 4,260,000 0.00%
21 18 Hong Kong Disneyland, Hong Kong SAR, China 4,150,000 5,200,000 -20.19%
22 20 Tivoli Gardens, Copenhagen, Denmark 4,110,000 4,396,000 -6.51%
23 24 Europa-Park, Rust, Germany 4,000,000 3,950,000 1.27%
24 25 Nagashima Spa Land, Kuwana, Japan 3,910,000 3,910,000 0.00%
25 - PortAventura, Salou, Spain 3,700,000
Figures from 2008 TEA/AECOM Theme Index
Rank Park/Location Attendance Change
2008 2007 2008 2007
1 1 Magic Kingdom, Walt Disney World, Lake Buena Vista, FL, USA 17,063,000 17,060,000 0.02%
2 2 Disneyland, Anahaim, CA, USA 14,721,000 14,870,000 -1.00%
3 3 Tokyo Disneyland, Tokyo, Japan 14,293,000 13,906,000 2.78%
4 5 Disneyland Paris, Marne-La-Valle, France 12,688,000 12,000,000 5.73%
5 4 Tokyo DisneySea, Tokyo, Japan 12,498,000 12,413,000 0.68%
6 6 EPCOT, Walt Disney World, Lake Buena Vista, FL, USA 10,935,000 10,930,000 0.05%
7 7 Disney's Hollywood Studios, Walt Disney World, Lake Buena Vista, FL, USA 9,608,000 9,510,000 1.03%
8 8 Disney's Animal Kingdom, Walt Disney World, Lake Buena Vista, FL, USA 9,540,000 9,490,000 0.53%
9 9 Universal Studios Japan, Osaka, Japan 8,300,000 8,713,000 -4.74%
10 10 Everland, Kyonggi-Do, South Korea 6,600,000 7,200,000 -8.33%
11 11 Universal Studios Florida, Orlando, FL, USA 6,231,000 6,200,000 0.50%
12 12 SeaWorld Orlando, Orlando, FL, USA 5,926,000 5,800,000 2.17%
13 13 Disney's California Adventure, Anaheim, CA, USA 5,566,000 5,680,000 -2.01%
14 15 Universal's Islands of Adventure, Orlando, FL, USA 5,297,000 5,430,000 -2.45%
15 16 Ocean Park, Hong Kong SAR, China 5,030,000 4,920,000 2.24%
16 18 Universal Studios Hollywood, Universal City, CA, USA 4,583,000 4,700,000 -2.49%
17 17 Yokohama Hakkeijma Sea Paradise, Yokohama, Japan 4,555,000 4,770,000 -4.51%
18 21 Hong Kong Disneyland, Hong Kong SAR, China 4,500,000 4,150,000 8.43%
19 19 Busch Gardens Tampa Bay, Tampa, FL, USA 4,410,000 4,400,000 0.23%
20 - Lotte World, Seoul Korea 4,236,000
21 20 SeaWorld San Diego, San Diego, CA, USA 4,147,000 4,260,000 -2.65%
22 23 Europa-Park, Rust, Germany 4,000,000 4,000,000 0.00%
23 22 Tivoli Gardens, Copenhagen, Denmark 3,972,000 4,110,000 -3.36%
24 24 Nagashima Spa Land, Kuwana, Japan 3,734,000 3,910,000 -4.50%
25 - Knott's Berry Farm, Buena Park, CA, USA 3,565,000
Figures from 2009 TEA/AECOM Theme Index
Rank Park/Location Attendance Change
2009 2008 2009 2008
1 1 Magic Kingdom, Walt Disney World, Lake Buena Vista, FL, USA 17,233,000 17,063,000 1.00%
2 2 Disneyland, Anahaim, CA, USA 15,900,000 14,721,000 8.01%
3 3 Tokyo Disneyland, Tokyo, Japan 13,646,000 14,293,000 -4.53%
4 4 Disneyland Paris, Marne-La-Valle, France 12,740,000 12,688,000 0.41%
5 5 Tokyo DisneySea, Tokyo, Japan 12,004,000 12,498,000 -3.95%
6 6 EPCOT, Walt Disney World, Lake Buena Vista, FL, USA 10,990,000 10,935,000 0.50%
7 7 Disney's Hollywood Studios, Walt Disney World, Lake Buena Vista, FL, USA 9,700,000 9,608,000 0.96%
8 8 Disney's Animal Kingdom, Walt Disney World, Lake Buena Vista, FL, USA 9,590,000 9,540,000 0.52%
9 9 Universal Studios Japan, Osaka, Japan 8,000,000 8,300,000 -3.61%
10 10 Everland, Kyonggi-Do, South Korea 6,169,000 6,600,000 -6.53%
11 13 Disney's California Adventure, Anaheim, CA, USA 6,050,000 5,566,000 8.70%
12 12 SeaWorld Orlando, Orlando, FL, USA 5,800,000 5,926,000 -2.13%
13 11 Universal Studios Florida, Orlando, FL, USA 5,530,000 6,231,000 -11.25%
14 15 Ocean Park, Hong Kong SAR, China 4,800,000 5,030,000 -4.57%
15 24 Nagashima Spa Land, Kuwana, Japan 4,700,000 3,734,000 25.87%
16 14 Universal's Islands of Adventure, Orlando, FL, USA 4,627,000 5,297,000 -12.65%
17 18 Hong Kong Disneyland, Hong Kong SAR, China 4,600,000 4,500,000 2.22%
18 17 Yokohama Hakkeijma Sea Paradise, Yokohama, Japan 4,500,000 4,555,000 -1.21%
19 16 Universal Studios Hollywood, Universal City, CA, USA 4,308,000 4,583,000 -6.00%
20 20 Lotte World, Seoul Korea 4,261,000 4,236,000 0.59%
21 22 Europa-Park, Rust, Germany 4,250,000 4,000,000 6.25%
22 21 SeaWorld San Diego, San Diego, CA, USA 4,200,000 4,147,000 1.28%
23 19 Busch Gardens Tampa Bay, Tampa, FL, USA 4,100,000 4,410,000 -7.03%
24 - De Efteling, Kaatsheuvel, Netherlands 4,000,000
25 23 Tivoli Gardens, Copenhagen, Denmark 3,870,000 3,972,000 -2.57%
Figures from 2010 TEA/AECOM Theme Index
Rank Park/Location Attendance Change
2010 2009 2010 2009
1 1 Magic Kingdom, Walt Disney World, Lake Buena Vista, FL, USA 16,972,000 17,233,000 -1.51%
2 2 Disneyland, Anahaim, CA, USA 15,980,000 15,900,000 0.50%
3 3 Tokyo Disneyland, Tokyo, Japan 14,452,000 13,646,000 5.91%
4 5 Tokyo DisneySea, Tokyo, Japan 12,663,000 12,004,000 5.49%
5 6 EPCOT, Walt Disney World, Lake Buena Vista, FL, USA 10,825,000 10,990,000 -1.50%
6 4 Disneyland Paris, Marne-La-Valle, France 10,500,000 12,740,000 -17.58%
7 8 Disney's Animal Kingdom, Walt Disney World, Lake Buena Vista, FL, USA 9,686,000 9,590,000 1.00%
8 7 Disney's Hollywood Studios, Walt Disney World, Lake Buena Vista, FL, USA 9,603,000 9,700,000 -1.00%
9 9 Universal Studios Japan, Osaka, Japan 8,160,000 8,000,000 2.00%
10 10 Everland, Kyonggi-Do, South Korea 6,884,000 6,169,000 11.59%
11 11 Disney's California Adventure, Anaheim, CA, USA 6,278,000 6,050,000 3.77%
12 16 Universal's Islands of Adventure, Orlando, FL, USA 5,949,000 4,627,000 28.57%
13 13 Universal Studios Florida, Orlando, FL, USA 5,925,000 5,530,000 7.14%
14 20 Lotte World, Seoul Korea 5,551,000 4,261,000 30.27%
15 17 Hong Kong Disneyland, Hong Kong SAR, China 5,200,000 4,600,000 13.04%
16 (tie) 12 SeaWorld Orlando, Orlando, FL, USA 5,100,000 5,800,000 -12.07%
16 (tie) 14 Ocean Park, Hong Kong SAR, China 5,100,000 4,800,000 6.25%
18 19 Universal Studios Hollywood, Universal City, CA, USA 5,040,000 4,308,000 16.99%
19 - Walt Disney Studios Paris, Marne-La-Valle, France 4,500,000
20 15 Nagashima Spa Land, Kuwana, Japan 4,465,000 4,700,000 -5.00%
21 21 Europa-Park, Rust, Germany 4,250,000 4,250,000 0.00%
22 23 Busch Gardens Tampa Bay, Tampa, FL, USA 4,200,000 4,100,000 2.44%
23 18 Yokohama Hakkeijma Sea Paradise, Yokohama, Japan 4,023,000 4,500,000 -10.60%
24 24 De Efteling, Kaatsheuvel, Netherlands 4,000,000 4,000,000 0.00%
25 22 SeaWorld San Diego, San Diego, CA, USA 3,800,000 4,200,000 -9.52%
Figures from 2011 TEA/AECOM Theme Index
Rank Park/Location Attendance Change
2011 2010 2011 2010
1 1 Magic Kingdom, Walt Disney World, Lake Buena Vista, FL, USA 17,142,000 16,972,000 1.00%
2 2 Disneyland, Anahaim, CA, USA 16,140,000 15,980,000 1.00%
3 3 Tokyo Disneyland, Tokyo, Japan 13,996,000 14,452,000 -3.16%
4 4 Tokyo DisneySea, Tokyo, Japan 11,930,000 12,663,000 -5.79%
5 6 Disneyland Paris, Marne-La-Valle, France 10,990,000 10,500,000 4.67%
6 5 EPCOT, Walt Disney World, Lake Buena Vista, FL, USA 10,825,000 10,825,000 0.00%
7 7 Disney's Animal Kingdom, Walt Disney World, Lake Buena Vista, FL, USA 9,783,000 9,686,000 1.00%
8 8 Disney's Hollywood Studios, Walt Disney World, Lake Buena Vista, FL, USA 9,699,000 9,603,000 1.00%
9 9 Universal Studios Japan, Osaka, Japan 8,500,000 8,160,000 4.17%
10 12 Universal's Islands of Adventure, Orlando, FL, USA 7,674,000 5,949,000 29.00%
11 16 (tie) Ocean Park, Hong Kong SAR, China 6,955,000 5,100,000 36.37%
12 10 Everland, Kyonggi-Do, South Korea 6,570,000 6,884,000 -4.56%
13 11 Disney's California Adventure, Anaheim, CA, USA 6,341,000 6,278,000 1.00%
14 13 Universal Studios Florida, Orlando, FL, USA 6,044,000 5,925,000 2.01%
15 15 Hong Kong Disneyland, Hong Kong SAR, China 5,900,000 5,200,000 13.46%
16 20 Nagashima Spa Land, Kuwana, Japan 5,820,000 4,465,000 30.35%
17 14 Lotte World, Seoul Korea 5,780,000 5,551,000 4.13%
18 16 (tie) SeaWorld Orlando, Orlando, FL, USA 5,202,000 5,100,000 2.00%
19 18 Universal Studios Hollywood, Universal City, CA, USA 5,141,000 5,040,000 2.00%
20 19 Walt Disney Studios Paris, Marne-La-Valle, France 4,710,000 4,500,000 4.67%
21 21 Europa-Park, Rust, Germany 4,500,000 4,250,000 5.88%
22 25 SeaWorld San Diego, San Diego, CA, USA 4,294,000 3,800,000 13.00%
23 22 Busch Gardens Tampa Bay, Tampa, FL, USA 4,284,000 4,200,000 2.00%
24 24 De Efteling, Kaatsheuvel, Netherlands 4,125,000 4,000,000 3.13%
25 - Tivoli Gardens, Copenhagen, Netherlands 3,963,000
Figures from 2012 TEA/AECOM Theme Index
Rank Park/Location Attendance Change
2012 2011 2012 2011
1 1 Magic Kingdom, Walt Disney World, Lake Buena Vista, FL, USA 17,536,000 17,142,000 2.30%
2 2 Disneyland, Anahaim, CA, USA 15,963,000 16,140,000 -1.10%
3 3 Tokyo Disneyland, Tokyo, Japan 14,847,000 13,996,000 6.08%
4 4 Tokyo DisneySea, Tokyo, Japan 12,656,000 11,930,000 6.09%
5 5 Disneyland Paris, Marne-La-Valle, France 11,200,000 10,990,000 1.91%
6 6 EPCOT, Walt Disney World, Lake Buena Vista, FL, USA 11,063,000 10,825,000 2.20%
7 7 Disney's Animal Kingdom, Walt Disney World, Lake Buena Vista, FL, USA 9,998,000 9,783,000 2.20%
8 8 Disney's Hollywood Studios, Walt Disney World, Lake Buena Vista, FL, USA 9,912,000 9,699,000 2.20%
9 9 Universal Studios Japan, Osaka, Japan 9,700,000 8,500,000 14.12%
10 10 Universal's Islands of Adventure, Orlando, FL, USA 7,981,000 7,674,000 4.00%
11 13 Disney's California Adventure, Anaheim, CA, USA 7,775,000 6,341,000 22.61%
12 11 Ocean Park, Hong Kong SAR, China 7,436,000 6,955,000 6.92%
13 12 Everland, Kyonggi-Do, South Korea 6,853,000 6,570,000 4.31%
14 15 Hong Kong Disneyland, Hong Kong SAR, China 6,700,000 5,900,000 13.56%
15 17 Lotte World, Seoul Korea 6,383,000 5,780,000 10.43%
16 14 Universal Studios Florida, Orlando, FL, USA 6,195,000 6,044,000 2.50%
17 19 Universal Studios Hollywood, Universal City, CA, USA 5,912,000 5,141,000 15.00%
18 16 Nagashima Spa Land, Kuwana, Japan 5,850,000 5,820,000 0.52%
19 18 SeaWorld Orlando, Orlando, FL, USA 5,358,000 5,202,000 3.00%
20 20 Walt Disney Studios Paris, Marne-La-Valle, France 4,800,000 4,710,000 1.91%
21 21 Europa-Park, Rust, Germany 4,600,000 4,500,000 2.22%
22 22 SeaWorld San Diego, San Diego, CA, USA 4,444,000 4,294,000 3.49%
23 23 Busch Gardens Tampa Bay, Tampa, FL, USA 4,348,000 4,284,000 1.49%
24 24 De Efteling, Kaatsheuvel, Netherlands 4,200,000 4,125,000 1.82%
25 - OCT East, Shenzhen, China 4,196,000
Figures from 2013 TEA/AECOM Theme Index
Rank Park/Location Attendance Change
2013 2012 2013 2012
1 1 Magic Kingdom, Walt Disney World, Lake Buena Vista, FL, USA 18,588,000 1,753,600 959.99%
2 3 Tokyo Disneyland, Tokyo, Japan 17,214,000 14,847,000 15.94%
3 2 Disneyland, Anahaim, CA, USA 16,202,000 15,963,000 1.50%
4 4 Tokyo DisneySea, Tokyo, Japan 14,084,000 12,656,000 11.28%
5 6 EPCOT, Walt Disney World, Lake Buena Vista, FL, USA 11,229,000 11,063,000 1.50%
6 5 Disneyland Paris, Marne-La-Valle, France 10,430,000 11,200,000 -6.88%
7 7 Disney's Animal Kingdom, Walt Disney World, Lake Buena Vista, FL, USA 10,198,000 9,980,000 2.18%
8 8 Disney's Hollywood Studios, Walt Disney World, Lake Buena Vista, FL, USA 10,110,000 9,912,000 2.00%
9 9 Universal Studios Japan, Osaka, Japan 10,100,000 9,700,000 4.12%
10 11 Disney's California Adventure, Anaheim, CA, USA 8,514,000 7,775,000 9.50%
11 10 Universal's Islands of Adventure, Orlando, FL, USA 8,141,000 7,981,000 2.00%
12 12 Ocean Park, Hong Kong SAR, China 7,475,000 7,436,000 0.52%
13 (tie) 14 Hong Kong Disneyland, Hong Kong SAR, China 7,400,000 6,700,000 10.45%
13 (tie) 15 Lotte World, Seoul Korea 7,400,000 6,383,000 15.93%
15 13 Everland, Kyonggi-Do, South Korea 7,303,000 6,853,000 6.57%
16 16 Universal Studios Florida, Orlando, FL, USA 7,062,000 6,195,000 14.00%
17 17 Universal Studios Hollywood, Universal City, CA, USA 6,148,000 5,912,000 3.99%
18 18 Nagashima Spa Land, Kuwana, Japan 5,840,000 5,850,000 -0.17%
19 19 SeaWorld Orlando, Orlando, FL, USA 5,090,000 5,358,000 -5.00%
20 21 Europa-Park, Rust, Germany 4,900,000 4,600,000 6.52%
21 20 Walt Disney Studios Paris, Marne-La-Valle, France 4,470,000 4,800,000 -6.88%
22 22 SeaWorld San Diego, San Diego, CA, USA 4,311,000 4,444,000 -2.99%
23 - Tivoli Gardens, Copenhagen, Denmark 4,200,000
24 24 De Efteling, Kaatsheuvel, Netherlands 4,150,000 4,200,000 -1.19%
25 - Yokohama Hakkeijima Sea Paradise, Yokohama, Japan 4,149,000
Figures from 2014 TEA/AECOM Theme Index
Rank Park/Location Attendance Change
2014 2013 2014 2013
1 1 Magic Kingdom, Walt Disney World, Lake Buena Vista, FL, USA 19,332,000 18,588,000 4.00%
2 2 Tokyo Disneyland, Tokyo, Japan 17,300,000 17,214,000 0.50%
3 3 Disneyland, Anahaim, CA, USA 16,769,000 16,202,000 3.50%
4 4 Tokyo DisneySea, Tokyo, Japan 14,100,000 14,084,000 0.11%
5 9 Universal Studios Japan, Osaka, Japan 11,800,000 10,100,000 16.83%
6 5 EPCOT, Walt Disney World, Lake Buena Vista, FL, USA 11,454,000 11,229,000 2.00%
7 7 Disney's Animal Kingdom, Walt Disney World, Lake Buena Vista, FL, USA 10,402,000 10,198,000 2.00%
8 8 Disney's Hollywood Studios, Walt Disney World, Lake Buena Vista, FL, USA 10,312,000 10,110,000 2.00%
9 6 Disneyland Paris, Marne-La-Valle, France 9,940,000 10,430,000 -4.70%
10 10 Disney's California Adventure, Anaheim, CA, USA 8,769,000 8,514,000 3.00%
11 16 Universal Studios Florida, Orlando, FL, USA 8,263,000 7,062,000 17.01%
12 11 Universal's Islands of Adventure, Orlando, FL, USA 8,141,000 8,141,000 0.00%
13 12 Ocean Park, Hong Kong SAR, China 7,792,000 7,475,000 4.24%
14 13 (tie) Lotte World, Seoul Korea 7,606,000 7,400,000 2.78%
15 13 (tie) Hong Kong Disneyland, Hong Kong SAR, China 7,500,000 7,400,000 1.35%
16 15 Everland, Kyonggi-Do, South Korea 7,381,000 7,303,000 1.07%
17 17 Universal Studios Hollywood, Universal City, CA, USA 6,824,000 6,148,000 11.00%
18 - Songcheng Park, Hanzhou, China 5,810,000
19 18 Nagashima Spa Land, Kuwana, Japan 5,630,000 5,840,000 -3.60%
20 - Chimelong Ocean Kingdom, Henqin, China 5,504,000
21 20 Europa-Park, Rust, Germany 5,000,000 4,900,000 2.04%
22 19 SeaWorld Orlando, Orlando, FL, USA 4,683,000 5,090,000 -8.00%
23 23 Tivoli Gardens, Copenhagen, Denmark 4,478,000 4,200,000 6.62%
24 24 De Efteling, Kaatsheuvel, Netherlands 4,400,000 4,150,000 6.02%
25 21 Walt Disney Studios Paris, Marne-La-Valle, France 4,260,000 4,470,000 -4.70%
Figures from 2015 TEA/AECOM Theme Index
Park/Location Attendance Change
2015 2014 2015 2014
1 1 Magic Kingdom, Walt Disney World, Lake Buena Vista, FL, USA 20,492,000 19,332,000 6.00%
2 3 Disneyland, Anahaim, CA, USA 18,278,000 16,769,000 9.00%
3 2 Tokyo Disneyland, Tokyo, Japan 16,600,000 17,300,000 -4.05%
4 5 Universal Studios Japan, Osaka, Japan 13,900,000 11,800,000 17.80%
5 4 Tokyo DisneySea, Tokyo, Japan 13,600,000 14,100,000 -3.55%
6 6 EPCOT, Walt Disney World, Lake Buena Vista, FL, USA 11,798,000 11,454,000 3.00%
7 7 Disney's Animal Kingdom, Walt Disney World, Lake Buena Vista, FL, USA 10,922,000 10,402,000 5.00%
8 8 Disney's Hollywood Studios, Walt Disney World, Lake Buena Vista, FL, USA 10,828,000 10,312,000 5.00%
9 9 Disneyland Paris, Marne-La-Valle, France 10,360,000 9,940,000 4.23%
10 11 Universal Studios Florida, Orlando, FL, USA 9,585,000 8,263,000 16.00%
11 10 Disney's California Adventure, Anaheim, CA, USA 9,383,000 8,769,000 7.00%
12 12 Universal's Islands of Adventure, Orlando, FL, USA 8,792,000 8,141,000 8.00%
13 20 Chimelong Ocean Kingdom, Henqin, China 7,486,000 5,504,000 36.01%
14 16 Everland, Kyonggi-Do, South Korea 7,423,000 7,381,000 0.57%
15 13 Ocean Park, Hong Kong SAR, China 7,387,000 7,792,000 -5.20%
16 14 Lotte World, Seoul Korea 7,310,000 7,606,000 -3.89%
17 18 Songcheng Park, Hanzhou, China 7,289,000 5,810,000 25.46%
18 17 Universal Studios Hollywood, Universal City, CA, USA 7,097,000 6,824,000 4.00%
19 15 Hong Kong Disneyland, Hong Kong SAR, China 6,800,000 7,500,000 -9.33%
20 19 Nagashima Spa Land, Kuwana, Japan 5,870,000 5,630,000 4.26%
21 21 Europa-Park, Rust, Germany 5,500,000 5,000,000 10.00%
22 22 SeaWorld Orlando, Orlando, FL, USA 4,777,000 4,683,000 2.01%
23 23 Tivoli Gardens, Copenhagen, Denmark 4,733,000 4,478,000 5.69%
24 24 De Efteling, Kaatsheuvel, Netherlands 4,680,000 4,400,000 6.36%
25 - Songcheng Lijiang Romance Park, Lijiang, China 4,678,000

Weitere ähnliche Inhalte

Kürzlich hochgeladen

Buy Verified TransferWise Accounts From Seosmmearth
Buy Verified TransferWise Accounts From SeosmmearthBuy Verified TransferWise Accounts From Seosmmearth
Buy Verified TransferWise Accounts From SeosmmearthBuy Verified Binance Account
 
Lundin Gold - Q1 2024 Conference Call Presentation (Revised)
Lundin Gold - Q1 2024 Conference Call Presentation (Revised)Lundin Gold - Q1 2024 Conference Call Presentation (Revised)
Lundin Gold - Q1 2024 Conference Call Presentation (Revised)Adnet Communications
 
Pre Engineered Building Manufacturers Hyderabad.pptx
Pre Engineered  Building Manufacturers Hyderabad.pptxPre Engineered  Building Manufacturers Hyderabad.pptx
Pre Engineered Building Manufacturers Hyderabad.pptxRoofing Contractor
 
Quick Doctor In Kuwait +2773`7758`557 Kuwait Doha Qatar Dubai Abu Dhabi Sharj...
Quick Doctor In Kuwait +2773`7758`557 Kuwait Doha Qatar Dubai Abu Dhabi Sharj...Quick Doctor In Kuwait +2773`7758`557 Kuwait Doha Qatar Dubai Abu Dhabi Sharj...
Quick Doctor In Kuwait +2773`7758`557 Kuwait Doha Qatar Dubai Abu Dhabi Sharj...daisycvs
 
Putting the SPARK into Virtual Training.pptx
Putting the SPARK into Virtual Training.pptxPutting the SPARK into Virtual Training.pptx
Putting the SPARK into Virtual Training.pptxCynthia Clay
 
How to Get Started in Social Media for Art League City
How to Get Started in Social Media for Art League CityHow to Get Started in Social Media for Art League City
How to Get Started in Social Media for Art League CityEric T. Tung
 
Cracking the 'Career Pathing' Slideshare
Cracking the 'Career Pathing' SlideshareCracking the 'Career Pathing' Slideshare
Cracking the 'Career Pathing' SlideshareWorkforce Group
 
Power point presentation on enterprise performance management
Power point presentation on enterprise performance managementPower point presentation on enterprise performance management
Power point presentation on enterprise performance managementVaishnaviGunji
 
Dr. Admir Softic_ presentation_Green Club_ENG.pdf
Dr. Admir Softic_ presentation_Green Club_ENG.pdfDr. Admir Softic_ presentation_Green Club_ENG.pdf
Dr. Admir Softic_ presentation_Green Club_ENG.pdfAdmir Softic
 
Organizational Transformation Lead with Culture
Organizational Transformation Lead with CultureOrganizational Transformation Lead with Culture
Organizational Transformation Lead with CultureSeta Wicaksana
 
Mifepristone Available in Muscat +918761049707^^ €€ Buy Abortion Pills in Oman
Mifepristone Available in Muscat +918761049707^^ €€ Buy Abortion Pills in OmanMifepristone Available in Muscat +918761049707^^ €€ Buy Abortion Pills in Oman
Mifepristone Available in Muscat +918761049707^^ €€ Buy Abortion Pills in Omaninstagramfab782445
 
New 2024 Cannabis Edibles Investor Pitch Deck Template
New 2024 Cannabis Edibles Investor Pitch Deck TemplateNew 2024 Cannabis Edibles Investor Pitch Deck Template
New 2024 Cannabis Edibles Investor Pitch Deck TemplateCannaBusinessPlans
 
Marel Q1 2024 Investor Presentation from May 8, 2024
Marel Q1 2024 Investor Presentation from May 8, 2024Marel Q1 2024 Investor Presentation from May 8, 2024
Marel Q1 2024 Investor Presentation from May 8, 2024Marel
 
Falcon Invoice Discounting: Empowering Your Business Growth
Falcon Invoice Discounting: Empowering Your Business GrowthFalcon Invoice Discounting: Empowering Your Business Growth
Falcon Invoice Discounting: Empowering Your Business GrowthFalcon investment
 
Rice Manufacturers in India | Shree Krishna Exports
Rice Manufacturers in India | Shree Krishna ExportsRice Manufacturers in India | Shree Krishna Exports
Rice Manufacturers in India | Shree Krishna ExportsShree Krishna Exports
 
Unveiling Falcon Invoice Discounting: Leading the Way as India's Premier Bill...
Unveiling Falcon Invoice Discounting: Leading the Way as India's Premier Bill...Unveiling Falcon Invoice Discounting: Leading the Way as India's Premier Bill...
Unveiling Falcon Invoice Discounting: Leading the Way as India's Premier Bill...Falcon Invoice Discounting
 
Falcon Invoice Discounting: Unlock Your Business Potential
Falcon Invoice Discounting: Unlock Your Business PotentialFalcon Invoice Discounting: Unlock Your Business Potential
Falcon Invoice Discounting: Unlock Your Business PotentialFalcon investment
 
Al Mizhar Dubai Escorts +971561403006 Escorts Service In Al Mizhar
Al Mizhar Dubai Escorts +971561403006 Escorts Service In Al MizharAl Mizhar Dubai Escorts +971561403006 Escorts Service In Al Mizhar
Al Mizhar Dubai Escorts +971561403006 Escorts Service In Al Mizharallensay1
 
The Abortion pills for sale in Qatar@Doha [+27737758557] []Deira Dubai Kuwait
The Abortion pills for sale in Qatar@Doha [+27737758557] []Deira Dubai KuwaitThe Abortion pills for sale in Qatar@Doha [+27737758557] []Deira Dubai Kuwait
The Abortion pills for sale in Qatar@Doha [+27737758557] []Deira Dubai Kuwaitdaisycvs
 

Kürzlich hochgeladen (20)

Buy Verified TransferWise Accounts From Seosmmearth
Buy Verified TransferWise Accounts From SeosmmearthBuy Verified TransferWise Accounts From Seosmmearth
Buy Verified TransferWise Accounts From Seosmmearth
 
Lundin Gold - Q1 2024 Conference Call Presentation (Revised)
Lundin Gold - Q1 2024 Conference Call Presentation (Revised)Lundin Gold - Q1 2024 Conference Call Presentation (Revised)
Lundin Gold - Q1 2024 Conference Call Presentation (Revised)
 
Pre Engineered Building Manufacturers Hyderabad.pptx
Pre Engineered  Building Manufacturers Hyderabad.pptxPre Engineered  Building Manufacturers Hyderabad.pptx
Pre Engineered Building Manufacturers Hyderabad.pptx
 
Quick Doctor In Kuwait +2773`7758`557 Kuwait Doha Qatar Dubai Abu Dhabi Sharj...
Quick Doctor In Kuwait +2773`7758`557 Kuwait Doha Qatar Dubai Abu Dhabi Sharj...Quick Doctor In Kuwait +2773`7758`557 Kuwait Doha Qatar Dubai Abu Dhabi Sharj...
Quick Doctor In Kuwait +2773`7758`557 Kuwait Doha Qatar Dubai Abu Dhabi Sharj...
 
Putting the SPARK into Virtual Training.pptx
Putting the SPARK into Virtual Training.pptxPutting the SPARK into Virtual Training.pptx
Putting the SPARK into Virtual Training.pptx
 
How to Get Started in Social Media for Art League City
How to Get Started in Social Media for Art League CityHow to Get Started in Social Media for Art League City
How to Get Started in Social Media for Art League City
 
!~+971581248768>> SAFE AND ORIGINAL ABORTION PILLS FOR SALE IN DUBAI AND ABUD...
!~+971581248768>> SAFE AND ORIGINAL ABORTION PILLS FOR SALE IN DUBAI AND ABUD...!~+971581248768>> SAFE AND ORIGINAL ABORTION PILLS FOR SALE IN DUBAI AND ABUD...
!~+971581248768>> SAFE AND ORIGINAL ABORTION PILLS FOR SALE IN DUBAI AND ABUD...
 
Cracking the 'Career Pathing' Slideshare
Cracking the 'Career Pathing' SlideshareCracking the 'Career Pathing' Slideshare
Cracking the 'Career Pathing' Slideshare
 
Power point presentation on enterprise performance management
Power point presentation on enterprise performance managementPower point presentation on enterprise performance management
Power point presentation on enterprise performance management
 
Dr. Admir Softic_ presentation_Green Club_ENG.pdf
Dr. Admir Softic_ presentation_Green Club_ENG.pdfDr. Admir Softic_ presentation_Green Club_ENG.pdf
Dr. Admir Softic_ presentation_Green Club_ENG.pdf
 
Organizational Transformation Lead with Culture
Organizational Transformation Lead with CultureOrganizational Transformation Lead with Culture
Organizational Transformation Lead with Culture
 
Mifepristone Available in Muscat +918761049707^^ €€ Buy Abortion Pills in Oman
Mifepristone Available in Muscat +918761049707^^ €€ Buy Abortion Pills in OmanMifepristone Available in Muscat +918761049707^^ €€ Buy Abortion Pills in Oman
Mifepristone Available in Muscat +918761049707^^ €€ Buy Abortion Pills in Oman
 
New 2024 Cannabis Edibles Investor Pitch Deck Template
New 2024 Cannabis Edibles Investor Pitch Deck TemplateNew 2024 Cannabis Edibles Investor Pitch Deck Template
New 2024 Cannabis Edibles Investor Pitch Deck Template
 
Marel Q1 2024 Investor Presentation from May 8, 2024
Marel Q1 2024 Investor Presentation from May 8, 2024Marel Q1 2024 Investor Presentation from May 8, 2024
Marel Q1 2024 Investor Presentation from May 8, 2024
 
Falcon Invoice Discounting: Empowering Your Business Growth
Falcon Invoice Discounting: Empowering Your Business GrowthFalcon Invoice Discounting: Empowering Your Business Growth
Falcon Invoice Discounting: Empowering Your Business Growth
 
Rice Manufacturers in India | Shree Krishna Exports
Rice Manufacturers in India | Shree Krishna ExportsRice Manufacturers in India | Shree Krishna Exports
Rice Manufacturers in India | Shree Krishna Exports
 
Unveiling Falcon Invoice Discounting: Leading the Way as India's Premier Bill...
Unveiling Falcon Invoice Discounting: Leading the Way as India's Premier Bill...Unveiling Falcon Invoice Discounting: Leading the Way as India's Premier Bill...
Unveiling Falcon Invoice Discounting: Leading the Way as India's Premier Bill...
 
Falcon Invoice Discounting: Unlock Your Business Potential
Falcon Invoice Discounting: Unlock Your Business PotentialFalcon Invoice Discounting: Unlock Your Business Potential
Falcon Invoice Discounting: Unlock Your Business Potential
 
Al Mizhar Dubai Escorts +971561403006 Escorts Service In Al Mizhar
Al Mizhar Dubai Escorts +971561403006 Escorts Service In Al MizharAl Mizhar Dubai Escorts +971561403006 Escorts Service In Al Mizhar
Al Mizhar Dubai Escorts +971561403006 Escorts Service In Al Mizhar
 
The Abortion pills for sale in Qatar@Doha [+27737758557] []Deira Dubai Kuwait
The Abortion pills for sale in Qatar@Doha [+27737758557] []Deira Dubai KuwaitThe Abortion pills for sale in Qatar@Doha [+27737758557] []Deira Dubai Kuwait
The Abortion pills for sale in Qatar@Doha [+27737758557] []Deira Dubai Kuwait
 

Empfohlen

How Race, Age and Gender Shape Attitudes Towards Mental Health
How Race, Age and Gender Shape Attitudes Towards Mental HealthHow Race, Age and Gender Shape Attitudes Towards Mental Health
How Race, Age and Gender Shape Attitudes Towards Mental HealthThinkNow
 
AI Trends in Creative Operations 2024 by Artwork Flow.pdf
AI Trends in Creative Operations 2024 by Artwork Flow.pdfAI Trends in Creative Operations 2024 by Artwork Flow.pdf
AI Trends in Creative Operations 2024 by Artwork Flow.pdfmarketingartwork
 
PEPSICO Presentation to CAGNY Conference Feb 2024
PEPSICO Presentation to CAGNY Conference Feb 2024PEPSICO Presentation to CAGNY Conference Feb 2024
PEPSICO Presentation to CAGNY Conference Feb 2024Neil Kimberley
 
Content Methodology: A Best Practices Report (Webinar)
Content Methodology: A Best Practices Report (Webinar)Content Methodology: A Best Practices Report (Webinar)
Content Methodology: A Best Practices Report (Webinar)contently
 
How to Prepare For a Successful Job Search for 2024
How to Prepare For a Successful Job Search for 2024How to Prepare For a Successful Job Search for 2024
How to Prepare For a Successful Job Search for 2024Albert Qian
 
Social Media Marketing Trends 2024 // The Global Indie Insights
Social Media Marketing Trends 2024 // The Global Indie InsightsSocial Media Marketing Trends 2024 // The Global Indie Insights
Social Media Marketing Trends 2024 // The Global Indie InsightsKurio // The Social Media Age(ncy)
 
Trends In Paid Search: Navigating The Digital Landscape In 2024
Trends In Paid Search: Navigating The Digital Landscape In 2024Trends In Paid Search: Navigating The Digital Landscape In 2024
Trends In Paid Search: Navigating The Digital Landscape In 2024Search Engine Journal
 
5 Public speaking tips from TED - Visualized summary
5 Public speaking tips from TED - Visualized summary5 Public speaking tips from TED - Visualized summary
5 Public speaking tips from TED - Visualized summarySpeakerHub
 
ChatGPT and the Future of Work - Clark Boyd
ChatGPT and the Future of Work - Clark Boyd ChatGPT and the Future of Work - Clark Boyd
ChatGPT and the Future of Work - Clark Boyd Clark Boyd
 
Getting into the tech field. what next
Getting into the tech field. what next Getting into the tech field. what next
Getting into the tech field. what next Tessa Mero
 
Google's Just Not That Into You: Understanding Core Updates & Search Intent
Google's Just Not That Into You: Understanding Core Updates & Search IntentGoogle's Just Not That Into You: Understanding Core Updates & Search Intent
Google's Just Not That Into You: Understanding Core Updates & Search IntentLily Ray
 
Time Management & Productivity - Best Practices
Time Management & Productivity -  Best PracticesTime Management & Productivity -  Best Practices
Time Management & Productivity - Best PracticesVit Horky
 
The six step guide to practical project management
The six step guide to practical project managementThe six step guide to practical project management
The six step guide to practical project managementMindGenius
 
Beginners Guide to TikTok for Search - Rachel Pearson - We are Tilt __ Bright...
Beginners Guide to TikTok for Search - Rachel Pearson - We are Tilt __ Bright...Beginners Guide to TikTok for Search - Rachel Pearson - We are Tilt __ Bright...
Beginners Guide to TikTok for Search - Rachel Pearson - We are Tilt __ Bright...RachelPearson36
 
Unlocking the Power of ChatGPT and AI in Testing - A Real-World Look, present...
Unlocking the Power of ChatGPT and AI in Testing - A Real-World Look, present...Unlocking the Power of ChatGPT and AI in Testing - A Real-World Look, present...
Unlocking the Power of ChatGPT and AI in Testing - A Real-World Look, present...Applitools
 
12 Ways to Increase Your Influence at Work
12 Ways to Increase Your Influence at Work12 Ways to Increase Your Influence at Work
12 Ways to Increase Your Influence at WorkGetSmarter
 

Empfohlen (20)

How Race, Age and Gender Shape Attitudes Towards Mental Health
How Race, Age and Gender Shape Attitudes Towards Mental HealthHow Race, Age and Gender Shape Attitudes Towards Mental Health
How Race, Age and Gender Shape Attitudes Towards Mental Health
 
AI Trends in Creative Operations 2024 by Artwork Flow.pdf
AI Trends in Creative Operations 2024 by Artwork Flow.pdfAI Trends in Creative Operations 2024 by Artwork Flow.pdf
AI Trends in Creative Operations 2024 by Artwork Flow.pdf
 
Skeleton Culture Code
Skeleton Culture CodeSkeleton Culture Code
Skeleton Culture Code
 
PEPSICO Presentation to CAGNY Conference Feb 2024
PEPSICO Presentation to CAGNY Conference Feb 2024PEPSICO Presentation to CAGNY Conference Feb 2024
PEPSICO Presentation to CAGNY Conference Feb 2024
 
Content Methodology: A Best Practices Report (Webinar)
Content Methodology: A Best Practices Report (Webinar)Content Methodology: A Best Practices Report (Webinar)
Content Methodology: A Best Practices Report (Webinar)
 
How to Prepare For a Successful Job Search for 2024
How to Prepare For a Successful Job Search for 2024How to Prepare For a Successful Job Search for 2024
How to Prepare For a Successful Job Search for 2024
 
Social Media Marketing Trends 2024 // The Global Indie Insights
Social Media Marketing Trends 2024 // The Global Indie InsightsSocial Media Marketing Trends 2024 // The Global Indie Insights
Social Media Marketing Trends 2024 // The Global Indie Insights
 
Trends In Paid Search: Navigating The Digital Landscape In 2024
Trends In Paid Search: Navigating The Digital Landscape In 2024Trends In Paid Search: Navigating The Digital Landscape In 2024
Trends In Paid Search: Navigating The Digital Landscape In 2024
 
5 Public speaking tips from TED - Visualized summary
5 Public speaking tips from TED - Visualized summary5 Public speaking tips from TED - Visualized summary
5 Public speaking tips from TED - Visualized summary
 
ChatGPT and the Future of Work - Clark Boyd
ChatGPT and the Future of Work - Clark Boyd ChatGPT and the Future of Work - Clark Boyd
ChatGPT and the Future of Work - Clark Boyd
 
Getting into the tech field. what next
Getting into the tech field. what next Getting into the tech field. what next
Getting into the tech field. what next
 
Google's Just Not That Into You: Understanding Core Updates & Search Intent
Google's Just Not That Into You: Understanding Core Updates & Search IntentGoogle's Just Not That Into You: Understanding Core Updates & Search Intent
Google's Just Not That Into You: Understanding Core Updates & Search Intent
 
How to have difficult conversations
How to have difficult conversations How to have difficult conversations
How to have difficult conversations
 
Introduction to Data Science
Introduction to Data ScienceIntroduction to Data Science
Introduction to Data Science
 
Time Management & Productivity - Best Practices
Time Management & Productivity -  Best PracticesTime Management & Productivity -  Best Practices
Time Management & Productivity - Best Practices
 
The six step guide to practical project management
The six step guide to practical project managementThe six step guide to practical project management
The six step guide to practical project management
 
Beginners Guide to TikTok for Search - Rachel Pearson - We are Tilt __ Bright...
Beginners Guide to TikTok for Search - Rachel Pearson - We are Tilt __ Bright...Beginners Guide to TikTok for Search - Rachel Pearson - We are Tilt __ Bright...
Beginners Guide to TikTok for Search - Rachel Pearson - We are Tilt __ Bright...
 
Unlocking the Power of ChatGPT and AI in Testing - A Real-World Look, present...
Unlocking the Power of ChatGPT and AI in Testing - A Real-World Look, present...Unlocking the Power of ChatGPT and AI in Testing - A Real-World Look, present...
Unlocking the Power of ChatGPT and AI in Testing - A Real-World Look, present...
 
12 Ways to Increase Your Influence at Work
12 Ways to Increase Your Influence at Work12 Ways to Increase Your Influence at Work
12 Ways to Increase Your Influence at Work
 
ChatGPT webinar slides
ChatGPT webinar slidesChatGPT webinar slides
ChatGPT webinar slides
 

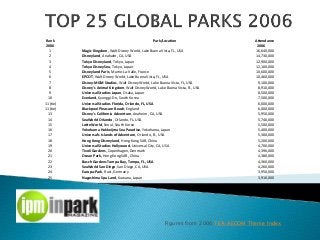
Top 25 theme parks by attendance, 2006-2015

  • 1. Figures from 2006 TEA/AECOM Theme Index Rank Park/Location Attendance 2006 2006 1 Magic Kingdom, Walt Disney World, Lake Buena Vista, FL, USA 16,640,000 2 Disneyland, Anahaim, CA, USA 14,730,000 3 Tokyo Disneyland, Tokyo, Japan 12,900,000 4 Tokyo DisneySea, Tokyo, Japan 12,100,000 5 Disneyland Paris, Marne-La-Valle, France 10,600,000 6 EPCOT, Walt Disney World, Lake Buena Vista, FL, USA 10,460,000 7 Disney-MGM Studios, Walt Disney World, Lake Buena Vista, FL, USA 9,100,000 8 Disney's Animal Kingdom, Walt Disney World, Lake Buena Vista, FL, USA 8,910,000 9 Universal Studios Japan, Osaka, Japan 8,500,000 10 Everland, Kyonggi-Do, South Korea 7,500,000 11 (tie) Universal Studios Florida, Orlando, FL, USA 6,000,000 11 (tie) Blackpool Pleasure Beach, England 6,000,000 13 Disney's California Adventure, Anaheim, CA, USA 5,950,000 14 SeaWorld Orlando, Orlando, FL, USA 5,740,000 15 Lotte World, Seoul, South Korea 5,500,000 16 Yokohama Hakkeijma Sea Paradise, Yokohama, Japan 5,400,000 17 Universal's Islands of Adventure, Orlando, FL, USA 5,300,000 18 Hong Kong Disneyland, Hong Kong SAR, China 5,200,000 19 Universal Studios Hollywood, Universal City, CA, USA 4,700,000 20 Tivoli Gardens, Copenhagen, Denmark 4,396,000 21 Ocean Park, Hong Kong SAR, China 4,380,000 22 Busch Gardens Tampa Bay, Tampa, FL, USA 4,360,000 23 SeaWorld San Diego, San Diego, CA, USA 4,260,000 24 Europa-Park, Rust, Germany 3,950,000 25 Nagashima Spa Land, Kuwana, Japan 3,910,000
  • 2. Figures from 2007 TEA/AECOM Theme Index Rank Park/Location Attendance Change 2007 2006 2007 2006 1 1 Magic Kingdom, Walt Disney World, Lake Buena Vista, FL, USA 17,060,000 16,640,000 0.02524 2 2 Disneyland, Anahaim, CA, USA 14,870,000 14,730,000 0.95% 3 3 Tokyo Disneyland, Tokyo, Japan 13,906,000 12,900,000 7.80% 4 4 Tokyo DisneySea, Tokyo, Japan 12,413,000 12,100,000 2.59% 5 5 Disneyland Paris, Marne-La-Valle, France 12,000,000 10,600,000 13.21% 6 6 EPCOT, Walt Disney World, Lake Buena Vista, FL, USA 10,930,000 10,460,000 4.49% 7 7 Disney's Hollywood Studios, Walt Disney World, Lake Buena Vista, FL, USA 9,510,000 9,100,000 4.51% 8 8 Disney's Animal Kingdom, Walt Disney World, Lake Buena Vista, FL, USA 9,490,000 8,910,000 6.51% 9 9 Universal Studios Japan, Osaka, Japan 8,713,000 8,500,000 2.51% 10 10 Everland, Kyonggi-Do, South Korea 7,200,000 7,500,000 -4.00% 11 11 (tie) Universal Studios Florida, Orlando, FL, USA 6,200,000 6,000,000 3.33% 12 14 SeaWorld Orlando, Orlando, FL, USA 5,800,000 5,740,000 1.05% 13 13 Disney's California Adventure, Anaheim, CA, USA 5,680,000 5,950,000 -4.54% 14 11 (tie) Blackpool Pleasure Beach, England 5,500,000 6,000,000 -8.33% 15 17 Universal's Islands of Adventure, Orlando, FL, USA 5,430,000 5,300,000 2.45% 16 21 Ocean Park, Hong Kong SAR, China 4,920,000 4,380,000 12.33% 17 16 Yokohama Hakkeijma Sea Paradise, Yokohama, Japan 4,770,000 5,400,000 -11.67% 18 19 Universal Studios Hollywood, Universal City, CA, USA 4,700,000 4,700,000 0.00% 19 22 Busch Gardens Tampa Bay, Tampa, FL, USA 4,400,000 4,360,000 0.92% 20 23 SeaWorld San Diego, San Diego, CA, USA 4,260,000 4,260,000 0.00% 21 18 Hong Kong Disneyland, Hong Kong SAR, China 4,150,000 5,200,000 -20.19% 22 20 Tivoli Gardens, Copenhagen, Denmark 4,110,000 4,396,000 -6.51% 23 24 Europa-Park, Rust, Germany 4,000,000 3,950,000 1.27% 24 25 Nagashima Spa Land, Kuwana, Japan 3,910,000 3,910,000 0.00% 25 - PortAventura, Salou, Spain 3,700,000
  • 3. Figures from 2008 TEA/AECOM Theme Index Rank Park/Location Attendance Change 2008 2007 2008 2007 1 1 Magic Kingdom, Walt Disney World, Lake Buena Vista, FL, USA 17,063,000 17,060,000 0.02% 2 2 Disneyland, Anahaim, CA, USA 14,721,000 14,870,000 -1.00% 3 3 Tokyo Disneyland, Tokyo, Japan 14,293,000 13,906,000 2.78% 4 5 Disneyland Paris, Marne-La-Valle, France 12,688,000 12,000,000 5.73% 5 4 Tokyo DisneySea, Tokyo, Japan 12,498,000 12,413,000 0.68% 6 6 EPCOT, Walt Disney World, Lake Buena Vista, FL, USA 10,935,000 10,930,000 0.05% 7 7 Disney's Hollywood Studios, Walt Disney World, Lake Buena Vista, FL, USA 9,608,000 9,510,000 1.03% 8 8 Disney's Animal Kingdom, Walt Disney World, Lake Buena Vista, FL, USA 9,540,000 9,490,000 0.53% 9 9 Universal Studios Japan, Osaka, Japan 8,300,000 8,713,000 -4.74% 10 10 Everland, Kyonggi-Do, South Korea 6,600,000 7,200,000 -8.33% 11 11 Universal Studios Florida, Orlando, FL, USA 6,231,000 6,200,000 0.50% 12 12 SeaWorld Orlando, Orlando, FL, USA 5,926,000 5,800,000 2.17% 13 13 Disney's California Adventure, Anaheim, CA, USA 5,566,000 5,680,000 -2.01% 14 15 Universal's Islands of Adventure, Orlando, FL, USA 5,297,000 5,430,000 -2.45% 15 16 Ocean Park, Hong Kong SAR, China 5,030,000 4,920,000 2.24% 16 18 Universal Studios Hollywood, Universal City, CA, USA 4,583,000 4,700,000 -2.49% 17 17 Yokohama Hakkeijma Sea Paradise, Yokohama, Japan 4,555,000 4,770,000 -4.51% 18 21 Hong Kong Disneyland, Hong Kong SAR, China 4,500,000 4,150,000 8.43% 19 19 Busch Gardens Tampa Bay, Tampa, FL, USA 4,410,000 4,400,000 0.23% 20 - Lotte World, Seoul Korea 4,236,000 21 20 SeaWorld San Diego, San Diego, CA, USA 4,147,000 4,260,000 -2.65% 22 23 Europa-Park, Rust, Germany 4,000,000 4,000,000 0.00% 23 22 Tivoli Gardens, Copenhagen, Denmark 3,972,000 4,110,000 -3.36% 24 24 Nagashima Spa Land, Kuwana, Japan 3,734,000 3,910,000 -4.50% 25 - Knott's Berry Farm, Buena Park, CA, USA 3,565,000
  • 4. Figures from 2009 TEA/AECOM Theme Index Rank Park/Location Attendance Change 2009 2008 2009 2008 1 1 Magic Kingdom, Walt Disney World, Lake Buena Vista, FL, USA 17,233,000 17,063,000 1.00% 2 2 Disneyland, Anahaim, CA, USA 15,900,000 14,721,000 8.01% 3 3 Tokyo Disneyland, Tokyo, Japan 13,646,000 14,293,000 -4.53% 4 4 Disneyland Paris, Marne-La-Valle, France 12,740,000 12,688,000 0.41% 5 5 Tokyo DisneySea, Tokyo, Japan 12,004,000 12,498,000 -3.95% 6 6 EPCOT, Walt Disney World, Lake Buena Vista, FL, USA 10,990,000 10,935,000 0.50% 7 7 Disney's Hollywood Studios, Walt Disney World, Lake Buena Vista, FL, USA 9,700,000 9,608,000 0.96% 8 8 Disney's Animal Kingdom, Walt Disney World, Lake Buena Vista, FL, USA 9,590,000 9,540,000 0.52% 9 9 Universal Studios Japan, Osaka, Japan 8,000,000 8,300,000 -3.61% 10 10 Everland, Kyonggi-Do, South Korea 6,169,000 6,600,000 -6.53% 11 13 Disney's California Adventure, Anaheim, CA, USA 6,050,000 5,566,000 8.70% 12 12 SeaWorld Orlando, Orlando, FL, USA 5,800,000 5,926,000 -2.13% 13 11 Universal Studios Florida, Orlando, FL, USA 5,530,000 6,231,000 -11.25% 14 15 Ocean Park, Hong Kong SAR, China 4,800,000 5,030,000 -4.57% 15 24 Nagashima Spa Land, Kuwana, Japan 4,700,000 3,734,000 25.87% 16 14 Universal's Islands of Adventure, Orlando, FL, USA 4,627,000 5,297,000 -12.65% 17 18 Hong Kong Disneyland, Hong Kong SAR, China 4,600,000 4,500,000 2.22% 18 17 Yokohama Hakkeijma Sea Paradise, Yokohama, Japan 4,500,000 4,555,000 -1.21% 19 16 Universal Studios Hollywood, Universal City, CA, USA 4,308,000 4,583,000 -6.00% 20 20 Lotte World, Seoul Korea 4,261,000 4,236,000 0.59% 21 22 Europa-Park, Rust, Germany 4,250,000 4,000,000 6.25% 22 21 SeaWorld San Diego, San Diego, CA, USA 4,200,000 4,147,000 1.28% 23 19 Busch Gardens Tampa Bay, Tampa, FL, USA 4,100,000 4,410,000 -7.03% 24 - De Efteling, Kaatsheuvel, Netherlands 4,000,000 25 23 Tivoli Gardens, Copenhagen, Denmark 3,870,000 3,972,000 -2.57%
  • 5. Figures from 2010 TEA/AECOM Theme Index Rank Park/Location Attendance Change 2010 2009 2010 2009 1 1 Magic Kingdom, Walt Disney World, Lake Buena Vista, FL, USA 16,972,000 17,233,000 -1.51% 2 2 Disneyland, Anahaim, CA, USA 15,980,000 15,900,000 0.50% 3 3 Tokyo Disneyland, Tokyo, Japan 14,452,000 13,646,000 5.91% 4 5 Tokyo DisneySea, Tokyo, Japan 12,663,000 12,004,000 5.49% 5 6 EPCOT, Walt Disney World, Lake Buena Vista, FL, USA 10,825,000 10,990,000 -1.50% 6 4 Disneyland Paris, Marne-La-Valle, France 10,500,000 12,740,000 -17.58% 7 8 Disney's Animal Kingdom, Walt Disney World, Lake Buena Vista, FL, USA 9,686,000 9,590,000 1.00% 8 7 Disney's Hollywood Studios, Walt Disney World, Lake Buena Vista, FL, USA 9,603,000 9,700,000 -1.00% 9 9 Universal Studios Japan, Osaka, Japan 8,160,000 8,000,000 2.00% 10 10 Everland, Kyonggi-Do, South Korea 6,884,000 6,169,000 11.59% 11 11 Disney's California Adventure, Anaheim, CA, USA 6,278,000 6,050,000 3.77% 12 16 Universal's Islands of Adventure, Orlando, FL, USA 5,949,000 4,627,000 28.57% 13 13 Universal Studios Florida, Orlando, FL, USA 5,925,000 5,530,000 7.14% 14 20 Lotte World, Seoul Korea 5,551,000 4,261,000 30.27% 15 17 Hong Kong Disneyland, Hong Kong SAR, China 5,200,000 4,600,000 13.04% 16 (tie) 12 SeaWorld Orlando, Orlando, FL, USA 5,100,000 5,800,000 -12.07% 16 (tie) 14 Ocean Park, Hong Kong SAR, China 5,100,000 4,800,000 6.25% 18 19 Universal Studios Hollywood, Universal City, CA, USA 5,040,000 4,308,000 16.99% 19 - Walt Disney Studios Paris, Marne-La-Valle, France 4,500,000 20 15 Nagashima Spa Land, Kuwana, Japan 4,465,000 4,700,000 -5.00% 21 21 Europa-Park, Rust, Germany 4,250,000 4,250,000 0.00% 22 23 Busch Gardens Tampa Bay, Tampa, FL, USA 4,200,000 4,100,000 2.44% 23 18 Yokohama Hakkeijma Sea Paradise, Yokohama, Japan 4,023,000 4,500,000 -10.60% 24 24 De Efteling, Kaatsheuvel, Netherlands 4,000,000 4,000,000 0.00% 25 22 SeaWorld San Diego, San Diego, CA, USA 3,800,000 4,200,000 -9.52%
  • 6. Figures from 2011 TEA/AECOM Theme Index Rank Park/Location Attendance Change 2011 2010 2011 2010 1 1 Magic Kingdom, Walt Disney World, Lake Buena Vista, FL, USA 17,142,000 16,972,000 1.00% 2 2 Disneyland, Anahaim, CA, USA 16,140,000 15,980,000 1.00% 3 3 Tokyo Disneyland, Tokyo, Japan 13,996,000 14,452,000 -3.16% 4 4 Tokyo DisneySea, Tokyo, Japan 11,930,000 12,663,000 -5.79% 5 6 Disneyland Paris, Marne-La-Valle, France 10,990,000 10,500,000 4.67% 6 5 EPCOT, Walt Disney World, Lake Buena Vista, FL, USA 10,825,000 10,825,000 0.00% 7 7 Disney's Animal Kingdom, Walt Disney World, Lake Buena Vista, FL, USA 9,783,000 9,686,000 1.00% 8 8 Disney's Hollywood Studios, Walt Disney World, Lake Buena Vista, FL, USA 9,699,000 9,603,000 1.00% 9 9 Universal Studios Japan, Osaka, Japan 8,500,000 8,160,000 4.17% 10 12 Universal's Islands of Adventure, Orlando, FL, USA 7,674,000 5,949,000 29.00% 11 16 (tie) Ocean Park, Hong Kong SAR, China 6,955,000 5,100,000 36.37% 12 10 Everland, Kyonggi-Do, South Korea 6,570,000 6,884,000 -4.56% 13 11 Disney's California Adventure, Anaheim, CA, USA 6,341,000 6,278,000 1.00% 14 13 Universal Studios Florida, Orlando, FL, USA 6,044,000 5,925,000 2.01% 15 15 Hong Kong Disneyland, Hong Kong SAR, China 5,900,000 5,200,000 13.46% 16 20 Nagashima Spa Land, Kuwana, Japan 5,820,000 4,465,000 30.35% 17 14 Lotte World, Seoul Korea 5,780,000 5,551,000 4.13% 18 16 (tie) SeaWorld Orlando, Orlando, FL, USA 5,202,000 5,100,000 2.00% 19 18 Universal Studios Hollywood, Universal City, CA, USA 5,141,000 5,040,000 2.00% 20 19 Walt Disney Studios Paris, Marne-La-Valle, France 4,710,000 4,500,000 4.67% 21 21 Europa-Park, Rust, Germany 4,500,000 4,250,000 5.88% 22 25 SeaWorld San Diego, San Diego, CA, USA 4,294,000 3,800,000 13.00% 23 22 Busch Gardens Tampa Bay, Tampa, FL, USA 4,284,000 4,200,000 2.00% 24 24 De Efteling, Kaatsheuvel, Netherlands 4,125,000 4,000,000 3.13% 25 - Tivoli Gardens, Copenhagen, Netherlands 3,963,000
  • 7. Figures from 2012 TEA/AECOM Theme Index Rank Park/Location Attendance Change 2012 2011 2012 2011 1 1 Magic Kingdom, Walt Disney World, Lake Buena Vista, FL, USA 17,536,000 17,142,000 2.30% 2 2 Disneyland, Anahaim, CA, USA 15,963,000 16,140,000 -1.10% 3 3 Tokyo Disneyland, Tokyo, Japan 14,847,000 13,996,000 6.08% 4 4 Tokyo DisneySea, Tokyo, Japan 12,656,000 11,930,000 6.09% 5 5 Disneyland Paris, Marne-La-Valle, France 11,200,000 10,990,000 1.91% 6 6 EPCOT, Walt Disney World, Lake Buena Vista, FL, USA 11,063,000 10,825,000 2.20% 7 7 Disney's Animal Kingdom, Walt Disney World, Lake Buena Vista, FL, USA 9,998,000 9,783,000 2.20% 8 8 Disney's Hollywood Studios, Walt Disney World, Lake Buena Vista, FL, USA 9,912,000 9,699,000 2.20% 9 9 Universal Studios Japan, Osaka, Japan 9,700,000 8,500,000 14.12% 10 10 Universal's Islands of Adventure, Orlando, FL, USA 7,981,000 7,674,000 4.00% 11 13 Disney's California Adventure, Anaheim, CA, USA 7,775,000 6,341,000 22.61% 12 11 Ocean Park, Hong Kong SAR, China 7,436,000 6,955,000 6.92% 13 12 Everland, Kyonggi-Do, South Korea 6,853,000 6,570,000 4.31% 14 15 Hong Kong Disneyland, Hong Kong SAR, China 6,700,000 5,900,000 13.56% 15 17 Lotte World, Seoul Korea 6,383,000 5,780,000 10.43% 16 14 Universal Studios Florida, Orlando, FL, USA 6,195,000 6,044,000 2.50% 17 19 Universal Studios Hollywood, Universal City, CA, USA 5,912,000 5,141,000 15.00% 18 16 Nagashima Spa Land, Kuwana, Japan 5,850,000 5,820,000 0.52% 19 18 SeaWorld Orlando, Orlando, FL, USA 5,358,000 5,202,000 3.00% 20 20 Walt Disney Studios Paris, Marne-La-Valle, France 4,800,000 4,710,000 1.91% 21 21 Europa-Park, Rust, Germany 4,600,000 4,500,000 2.22% 22 22 SeaWorld San Diego, San Diego, CA, USA 4,444,000 4,294,000 3.49% 23 23 Busch Gardens Tampa Bay, Tampa, FL, USA 4,348,000 4,284,000 1.49% 24 24 De Efteling, Kaatsheuvel, Netherlands 4,200,000 4,125,000 1.82% 25 - OCT East, Shenzhen, China 4,196,000
  • 8. Figures from 2013 TEA/AECOM Theme Index Rank Park/Location Attendance Change 2013 2012 2013 2012 1 1 Magic Kingdom, Walt Disney World, Lake Buena Vista, FL, USA 18,588,000 1,753,600 959.99% 2 3 Tokyo Disneyland, Tokyo, Japan 17,214,000 14,847,000 15.94% 3 2 Disneyland, Anahaim, CA, USA 16,202,000 15,963,000 1.50% 4 4 Tokyo DisneySea, Tokyo, Japan 14,084,000 12,656,000 11.28% 5 6 EPCOT, Walt Disney World, Lake Buena Vista, FL, USA 11,229,000 11,063,000 1.50% 6 5 Disneyland Paris, Marne-La-Valle, France 10,430,000 11,200,000 -6.88% 7 7 Disney's Animal Kingdom, Walt Disney World, Lake Buena Vista, FL, USA 10,198,000 9,980,000 2.18% 8 8 Disney's Hollywood Studios, Walt Disney World, Lake Buena Vista, FL, USA 10,110,000 9,912,000 2.00% 9 9 Universal Studios Japan, Osaka, Japan 10,100,000 9,700,000 4.12% 10 11 Disney's California Adventure, Anaheim, CA, USA 8,514,000 7,775,000 9.50% 11 10 Universal's Islands of Adventure, Orlando, FL, USA 8,141,000 7,981,000 2.00% 12 12 Ocean Park, Hong Kong SAR, China 7,475,000 7,436,000 0.52% 13 (tie) 14 Hong Kong Disneyland, Hong Kong SAR, China 7,400,000 6,700,000 10.45% 13 (tie) 15 Lotte World, Seoul Korea 7,400,000 6,383,000 15.93% 15 13 Everland, Kyonggi-Do, South Korea 7,303,000 6,853,000 6.57% 16 16 Universal Studios Florida, Orlando, FL, USA 7,062,000 6,195,000 14.00% 17 17 Universal Studios Hollywood, Universal City, CA, USA 6,148,000 5,912,000 3.99% 18 18 Nagashima Spa Land, Kuwana, Japan 5,840,000 5,850,000 -0.17% 19 19 SeaWorld Orlando, Orlando, FL, USA 5,090,000 5,358,000 -5.00% 20 21 Europa-Park, Rust, Germany 4,900,000 4,600,000 6.52% 21 20 Walt Disney Studios Paris, Marne-La-Valle, France 4,470,000 4,800,000 -6.88% 22 22 SeaWorld San Diego, San Diego, CA, USA 4,311,000 4,444,000 -2.99% 23 - Tivoli Gardens, Copenhagen, Denmark 4,200,000 24 24 De Efteling, Kaatsheuvel, Netherlands 4,150,000 4,200,000 -1.19% 25 - Yokohama Hakkeijima Sea Paradise, Yokohama, Japan 4,149,000
  • 9. Figures from 2014 TEA/AECOM Theme Index Rank Park/Location Attendance Change 2014 2013 2014 2013 1 1 Magic Kingdom, Walt Disney World, Lake Buena Vista, FL, USA 19,332,000 18,588,000 4.00% 2 2 Tokyo Disneyland, Tokyo, Japan 17,300,000 17,214,000 0.50% 3 3 Disneyland, Anahaim, CA, USA 16,769,000 16,202,000 3.50% 4 4 Tokyo DisneySea, Tokyo, Japan 14,100,000 14,084,000 0.11% 5 9 Universal Studios Japan, Osaka, Japan 11,800,000 10,100,000 16.83% 6 5 EPCOT, Walt Disney World, Lake Buena Vista, FL, USA 11,454,000 11,229,000 2.00% 7 7 Disney's Animal Kingdom, Walt Disney World, Lake Buena Vista, FL, USA 10,402,000 10,198,000 2.00% 8 8 Disney's Hollywood Studios, Walt Disney World, Lake Buena Vista, FL, USA 10,312,000 10,110,000 2.00% 9 6 Disneyland Paris, Marne-La-Valle, France 9,940,000 10,430,000 -4.70% 10 10 Disney's California Adventure, Anaheim, CA, USA 8,769,000 8,514,000 3.00% 11 16 Universal Studios Florida, Orlando, FL, USA 8,263,000 7,062,000 17.01% 12 11 Universal's Islands of Adventure, Orlando, FL, USA 8,141,000 8,141,000 0.00% 13 12 Ocean Park, Hong Kong SAR, China 7,792,000 7,475,000 4.24% 14 13 (tie) Lotte World, Seoul Korea 7,606,000 7,400,000 2.78% 15 13 (tie) Hong Kong Disneyland, Hong Kong SAR, China 7,500,000 7,400,000 1.35% 16 15 Everland, Kyonggi-Do, South Korea 7,381,000 7,303,000 1.07% 17 17 Universal Studios Hollywood, Universal City, CA, USA 6,824,000 6,148,000 11.00% 18 - Songcheng Park, Hanzhou, China 5,810,000 19 18 Nagashima Spa Land, Kuwana, Japan 5,630,000 5,840,000 -3.60% 20 - Chimelong Ocean Kingdom, Henqin, China 5,504,000 21 20 Europa-Park, Rust, Germany 5,000,000 4,900,000 2.04% 22 19 SeaWorld Orlando, Orlando, FL, USA 4,683,000 5,090,000 -8.00% 23 23 Tivoli Gardens, Copenhagen, Denmark 4,478,000 4,200,000 6.62% 24 24 De Efteling, Kaatsheuvel, Netherlands 4,400,000 4,150,000 6.02% 25 21 Walt Disney Studios Paris, Marne-La-Valle, France 4,260,000 4,470,000 -4.70%
  • 10. Figures from 2015 TEA/AECOM Theme Index Park/Location Attendance Change 2015 2014 2015 2014 1 1 Magic Kingdom, Walt Disney World, Lake Buena Vista, FL, USA 20,492,000 19,332,000 6.00% 2 3 Disneyland, Anahaim, CA, USA 18,278,000 16,769,000 9.00% 3 2 Tokyo Disneyland, Tokyo, Japan 16,600,000 17,300,000 -4.05% 4 5 Universal Studios Japan, Osaka, Japan 13,900,000 11,800,000 17.80% 5 4 Tokyo DisneySea, Tokyo, Japan 13,600,000 14,100,000 -3.55% 6 6 EPCOT, Walt Disney World, Lake Buena Vista, FL, USA 11,798,000 11,454,000 3.00% 7 7 Disney's Animal Kingdom, Walt Disney World, Lake Buena Vista, FL, USA 10,922,000 10,402,000 5.00% 8 8 Disney's Hollywood Studios, Walt Disney World, Lake Buena Vista, FL, USA 10,828,000 10,312,000 5.00% 9 9 Disneyland Paris, Marne-La-Valle, France 10,360,000 9,940,000 4.23% 10 11 Universal Studios Florida, Orlando, FL, USA 9,585,000 8,263,000 16.00% 11 10 Disney's California Adventure, Anaheim, CA, USA 9,383,000 8,769,000 7.00% 12 12 Universal's Islands of Adventure, Orlando, FL, USA 8,792,000 8,141,000 8.00% 13 20 Chimelong Ocean Kingdom, Henqin, China 7,486,000 5,504,000 36.01% 14 16 Everland, Kyonggi-Do, South Korea 7,423,000 7,381,000 0.57% 15 13 Ocean Park, Hong Kong SAR, China 7,387,000 7,792,000 -5.20% 16 14 Lotte World, Seoul Korea 7,310,000 7,606,000 -3.89% 17 18 Songcheng Park, Hanzhou, China 7,289,000 5,810,000 25.46% 18 17 Universal Studios Hollywood, Universal City, CA, USA 7,097,000 6,824,000 4.00% 19 15 Hong Kong Disneyland, Hong Kong SAR, China 6,800,000 7,500,000 -9.33% 20 19 Nagashima Spa Land, Kuwana, Japan 5,870,000 5,630,000 4.26% 21 21 Europa-Park, Rust, Germany 5,500,000 5,000,000 10.00% 22 22 SeaWorld Orlando, Orlando, FL, USA 4,777,000 4,683,000 2.01% 23 23 Tivoli Gardens, Copenhagen, Denmark 4,733,000 4,478,000 5.69% 24 24 De Efteling, Kaatsheuvel, Netherlands 4,680,000 4,400,000 6.36% 25 - Songcheng Lijiang Romance Park, Lijiang, China 4,678,000