Physical activity, early life events and the nutritional status of Maya children
•Als PPTX, PDF herunterladen•
2 gefällt mir•470 views


Empfohlen
Weitere ähnliche Inhalte
Ähnlich wie Physical activity, early life events and the nutritional status of Maya children
Ähnlich wie Physical activity, early life events and the nutritional status of Maya children (20)
Mehr von Ines Varela-Silva
Mehr von Ines Varela-Silva (13)
Kürzlich hochgeladen
Kürzlich hochgeladen (20)
Physical activity, early life events and the nutritional status of Maya children
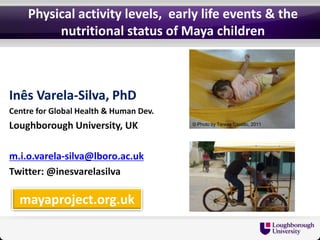
- 1. Physical activity levels, early life events & the nutritional status of Maya children Inês Varela-Silva, PhD Centre for Global Health & Human Dev. Loughborough University, UK © Photo by Teresa Castillo, 2011 m.i.o.varela-silva@lboro.ac.uk Twitter: @inesvarelasilva mayaproject.org.uk
- 2. Background AAPA 2013 Charles Darwin Award Recipient Prof Roberto Frisancho Nutritional dual-burden Under-and-overnutrition Coexistence of stunting & overweight/obesity Intergenerational factors The Maya in Mexico
- 3. The Maya in Mérida, Mexico
- 4. Developed Immigrants in Developing countries developed countries countries Growth Normal/tall Normal/short Stunted status Fat Fatter Fat Common Excessive intake of dietary fat factors Excessive caloric comsumption EE / P. Act Very Probably Not levels low low known Metabolic High fat Probably reduced fat Discordant pathways oxidation & low oxidation information carb oxidation Energy conserving mechanisms Positive growth Inter- generational of mothers & and early grandmothers: (Probably)...Negative growth of mothers & life effects positive lasting grandmothers: negative lasting effect on effect on current current generation generation
- 5. Varela-Silva et al (2009). AJHB, 21: 657-663 • N=206, 4-6 year old Maya 21.8% stunted 33.0% overweight/obese • N= 201, Maya mothers 70% below the 5th perc/height <150cm • Birthweight < 3,000 gr less likely to be OW/OB more likely to be stunted as children • Mother < 150 cm 3.6 times more likely of having stunted children Physical activity/energy expenditure?
- 6. Objective measurement of PA - Actiheart Wilson et al (2011). AJHB, 23: 426-428 • Actiheart® very accurate in estimating EE and PAL • Well tolerated by children (7days, free-living) • EKG pads didn’t hold under hot & humid conditions • Fieldwork conditions more demanding than lab’s • Several Actihearts damaged/lost
- 7. Sample (urban Maya – Merida, Mexico) Whole sample Children N Age Min-Max M±SD Boys 31 8.29±.84 6.82-9.95 Girls 27 8.56±.72 6.95-9.95 Total 58 8.42±.79 6.88-9.95 Actiheart sample Mothers 58 34.30±6.3 22.52-49.42 N % % stunting OW/OB Children 33 33.3% 24.2% (17 boys) Moms 33 84.8% 93.9%
- 8. Varela-Silva et al (2012). Coll. Antropol, 36: 39-45 Children Mothers WHO CDC IOTF p-value WHO CDC p-value Stunting 15.5 31.0 N/A <0.001 55.2 81.0 <0.001 Underweight 1.7 5.2 6.9 Ns 0.0 N/A Overweight 8.6 12.1 17.2 <0.001 91.4 N/A Obesity 0.0 15.5 10.3 <0.001 39.7 N/A
- 9. Body composition, energy expenditure & PA Wilson et al (2012). AHB, Vol. 39 (5): 432-439 • Lean mass (muscle): strongest predictor of energy expenditure • The shorter the stature, the lower the levels of activity energy expenditure ------------------------------------------------------ • Children: overall highly active, above the guidelines (60 min/day MVPA) • Girls and stunted children: lowest level of PA • PA independent of nutritional status
- 10. Developed Immigrants in Maya in countries developed countries Merida Growth Normal/tall Normal/short Dual-burden status Fat Fatter Common Excessive intake of dietary fat factors Excessive caloric comsumption EE / P. Act Very Probably High levels low low Metabolic High fat Probably reduced fat Discordant pathways oxidation & low oxidation information carb oxidation Energy conserving mechanisms Positive growth (Probably)...Negative Negative Inter- generational of mothers & growth of mothers & growth of and early grandmothers: grandmothers: negative mothers & life effects positive lasting lasting effect on current grandmothers: effect on negative effect generation children on children
- 11. Impact and dissemination of results mayaproject.org.uk
- 15. Funding • Wenner-Gren Foundation (#ICRG-93) • Santander Universities • CONACYT, Mexico • Loughborough University