2013 severn do+
•Als PPTX, PDF herunterladen•
1 gefällt mir•419 views

The document summarizes water quality monitoring results from the Severn River in Maryland. It finds two "dead zones" with low oxygen levels below the surface, especially during summer months. New tests detected hydrogen sulfide gas in these low-oxygen areas, indicating bacterial activity under anoxic conditions. Strong density gradients formed pycnoclines that inhibited mixing of low-oxygen bottom waters with better-oxygenated surface waters.

Empfohlen
Empfohlen
Weitere ähnliche Inhalte
Was ist angesagt?
Was ist angesagt? (20)
Andere mochten auch
Ähnlich wie 2013 severn do+
Ähnlich wie 2013 severn do+ (20)
Kürzlich hochgeladen
Kürzlich hochgeladen (20)
2013 severn do+
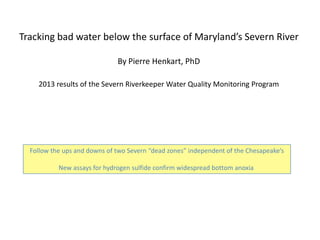
- 1. Tracking bad water below the surface of Maryland’s Severn River By Pierre Henkart, PhD 2013 results of the Severn Riverkeeper Water Quality Monitoring Program Follow the ups and downs of two Severn “dead zones” independent of the Chesapeake’s New assays for hydrogen sulfide confirm widespread bottom anoxia
- 2. Annapolis N SR0 – Our “near Chesapeake” station south of Greenbury Point, in the channel, with a depth of 6 meters (a bit less than 20 ft). SR0 is near the NOAA “Annapolis” buoy providing great continuous on-line water quality data at 1 meter depth. SR1 – Our “USNA” station in mid-channel opposite College Creek, with a depth of 7 meters SR2 – Our “Rte 50 bridge” station with a depth of 7 meters. We get to watch the peregrine falcons that nest on the bridge. We also get to compare our data with the monthly MD DNR monitoring data (their station WT7.1) on the “Eyes on the Bay” website. SR3 – Our “Joyce” station, south of Joyce Point, is our deepest, with a depth of 12-13 meters (~40 feet). This is representative of the mid-Severn’s narrow “deep trench”. RBS – Our “Round Bay South” station, which is interesting because the bottom sometimes gets anoxic in the summer. It has a typical Severn depth of ~ 7 meters. SR5 – Our mid Round Bay station with a depth of 6-7 meters. Bottom anoxia usually sets in by early July, and in the absence of storms, persists until September. RBN – Our “Round Bay North” station, with a typical Severn depth of 6-7 meters. This is the heart of the Severn summer dead zone. SR6 – Our Severn Narrows station with a depth of 5 meters. We generally notice fresher water near the surface, the influence of the fresh Severn Run entering to the northeast. Summer bottom anoxia is pronounced here. SR7 – Our shallow (~1.5m) upper station with fresher water from nearby Severn Run, especially after rains. Turbidity is high. Severn mainstem monitoring stations The distance from SR0 to SR7: 18 km = 11 miles
- 3. Oxygen depth profiles show habitat stress and “hypoxic squeeze” Dissolved oxygen, mg/liter We show our water quality data as depth profile bar graphs. You can think of yourself as a scuba diver entering the water from our monitoring boat and then heading straight for the bottom. As you go down oxygen levels will change. We’ve plotted the depth in a downward direction, so the longer the bar, the deeper the water. The oxygen levels are color coded according to the oxygen concentrations needed by different marine organisms. The Severn’s large active fish need at least 5 mg/liter oxygen, and levels greater than that are colored green. Since most oxygen in the water comes from the air, the top of the water column has higher oxygen. In most cases, water near the surface has more than 5 mg/liter, so the tops of most bars are green. Smaller fish like white perch are adapted to live with lower oxygen levels, but will avoid water with less than three mg/liter dissolved oxygen. They will utilize both the green and yellow portions of the water column. Benthic organisms that live in or on the bottom (oysters, worms, etc) are adapted to yet lower oxygen levels down to 1 mg/liter, and they will tolerate bottom water in the orange 1-3 mg/liter oxygen range. Oxygen levels below 1 mg/liter (red) are stressful to tough benthic organisms, even for short durations. Truly anoxic conditions exist below 0.2 mg/liter oxygen, where only anaerobic bacteria can live. This anoxic water will suffocate even the toughest multicellular organisms quickly. The lower oxygen levels in deeper water will “squeeze” fish habitat toward the surface. The extent of squeeze will depend on the oxygen preference of the fish involved, but few fish will be found in waters with less than 1 mg/liter dissolved oxygen. 1 0 2 3 4 5 6 Depth,meters >5 3-5 1-3 .2-1 <.2
- 4. Hydrogen Sulfide is produced by bacterial metabolism in the absence of oxygen Multicellular organisms produce energy by metabolic pathways requiring oxygen, but In its absence, many bacteria have the ability to utilize less efficient metabolic pathways not involving oxygen. One such less efficient pathway uses the naturally occurring sulfate ion in seawater, reducing it to hydrogen sulfide, H2S. Famous for its characteristic strong odor of rotten eggs, H2S is toxic to higher organisms, but reacts chemically with oxygen, so it cannot persist for long when oxygen is present. The presence of H2S in the water column has been used by oceanographers to characterize anoxic water (“dead zones”), e.g., in the Black Sea and the Chesapeake’s deep channel. A semi-quantitative assay for Hydrogen Sulfide The Hach HS-C assay for hydrogen sulfide utilizes a CuSO4 coated filter disc (#1, right) inserted into the cap of a jar loaded with 100 ml of sample water. After dropping 2 Alka-Seltzer (!!) tablets into the sample, the cap is screwed on, forcing expressed gases through the filter. As seen in disc #2 (right), H2S converts the pale blue CuSO4 to brown/black CuS, whose color can be evaluated according to the calibration chart provided by Hach. Disc 2 is the much-faded result from an assay sample obtained from 4 meters in Asquith Creek, Severn River, June 18, 2013. 1 2 Cap
- 5. During the summer, estuaries have outward flowing warm fresher water layered over inward flowing cooler saltier water Deg C Temperature Salinity Havre de Grace Norfolk Chesapeake Bay Program During the summer, both salinity and temperature contribute to the density differences between top and bottom water in estuaries. The distinct layering you see above with both salinity and temperature reflects the existence of a pycnocline.
- 6. Pycnocline strength reflects the intensity of density change with depth, a measure of the water column’s resistance to vertical mixing = 1002.48 kg/m3 Sal = 8.0 psu; Temp = 27.1oC = 1003.03 kg/m3 Sal = 8.2 psu; Temp = 25.8 oC 2 4 6 8 10 2 4 6 8 10 Depth,mDepth,m Sharp density changes with depth as seen in the lower example are pycnoclines, which often form in estuaries as lighter, fresher, water flows seaward over denser, saltier water. Such intense pycnoclines resist vertical mixing more effectively than the gradual density changes with depth shown in the upper example. Pycnocline intensity ~0.1 kg/m3/m ~0.5 kg/m3/m = 1002.48 kg/m3 Sal = 8.0 psu; Temp = 27.1oC = 1003.03 kg/m3 Sal = 8.2 psu; Temp = 25.8 oC Water density depends on salinity, temperature and pressure: http://www.es.flinders.edu.au/~mattom/Utilities/density.html Small differences in salinity and temperature like those shown here can make significant density changes that resist vertical mixing mixing induced by waves or turbulence from horizontal flow. .
- 7. Dissolved Oxygen, mg/liter Pycnocline intensity, (density increase/depth increase) .1-.2 .2-.3 .3-1 >1 Kg/m3/m 6-4
- 8. 6-18 Dissolved Oxygen, mg/liter Pycnocline intensity, (density increase/depth increase) .1-.2 .2-.3 .3-1 >1 Kg/m3/m Hydrogen sulfide, mg/liter <.1 .1-1.0 1.0-10 >10
- 9. 6-25 Dissolved Oxygen, mg/liter Pycnocline intensity, (density increase/depth increase) .1-.2 .2-.3 .3-1 >1 Kg/m3/m Hydrogen sulfide, mg/liter <.1 .1-1.0 1.0-10 >10
- 10. 7-2 Dissolved Oxygen, mg/liter Pycnocline intensity, (density increase/depth increase) .1-.2 .2-.3 .3-1 >1 Kg/m3/m Hydrogen sulfide, mg/liter <.1 .1-1.0 1.0-10 >10
- 11. 7-9 Dissolved Oxygen, mg/liter Pycnocline intensity, (density increase/depth increase) .1-.2 .2-.3 .3-1 >1 Kg/m3/m Hydrogen sulfide, mg/liter <.1 .1-1.0 1.0-10 >10 Dissolved Oxygen, mg/liter
- 12. 7-16 Dissolved Oxygen, mg/liter Pycnocline intensity, (density increase/depth increase) .1-.2 .2-.3 .3-1 >1 Kg/m3/m Hydrogen sulfide, mg/liter <.1 .1-1.0 1.0-10 >10
- 13. 7-23 Dissolved Oxygen, mg/liter Hydrogen sulfide, mg/liter <.1 .1-1.0 1.0-10 >10 Pycnocline intensity, (density increase/depth increase) .1-.2 .2-.3 .3-1 >1 Kg/m3/m
- 14. 7-30 Dissolved Oxygen, mg/liter Hydrogen sulfide, mg/liter <.1 .1-1.0 1.0-10 >10 Pycnocline intensity, (density increase/depth increase) .1-.2 .2-.3 .3-1 >1 Kg/m3/m
- 15. 8-6 Dissolved Oxygen, mg/liter Hydrogen sulfide, mg/liter <.1 .1-1.0 1.0-10 >10 Pycnocline intensity, (density increase/depth increase) .1-.2 .2-.3 .3-1 >1 Kg/m3/m
- 16. 8-13 Dissolved Oxygen, mg/liter Pycnocline intensity, (density increase/depth increase) .1-.2 .2-.3 .3-1 >1 Kg/m3/m
- 17. Pycnocline intensity, (density increase/depth increase) .1-.2 .2-.3 .3-1 >1 Kg/m3/m Dissolved Oxygen, mg/liter 8-20
- 18. 8-27 Dissolved Oxygen, mg/liter Pycnocline intensity, (density increase/depth increase) .1-.2 .2-.3 .3-1 >1 Kg/m3/m Hydrogen sulfide, mg/liter <.1 .1-1.0 1.0-10 >10
- 19. 9-3 Dissolved Oxygen, mg/liter Hydrogen sulfide, mg/liter <.1 .1-1.0 1.0-10 >10 Pycnocline intensity, (density increase/depth increase) .1-.2 .2-.3 .3-1 >1 Kg/m3/m
- 20. 9-10 Dissolved Oxygen, mg/liter Hydrogen sulfide, mg/liter <.1 .1-1.0 1.0-10 >10 Pycnocline intensity, (density increase/depth increase) .1-.2 .2-.3 .3-1 >1 Kg/m3/m