

Empfohlen
Weitere ähnliche Inhalte
Was ist angesagt?
Was ist angesagt? (20)
Ähnlich wie The sampling distribution
Ähnlich wie The sampling distribution (20)
Mehr von Harve Abella
Mehr von Harve Abella (20)
Kürzlich hochgeladen
Kürzlich hochgeladen (20)
The sampling distribution
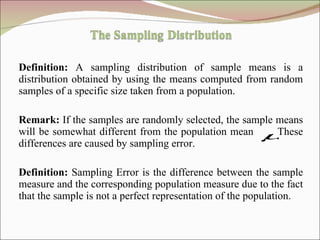
- 1. Definition: A sampling distribution of sample means is a distribution obtained by using the means computed from random samples of a specific size taken from a population. Remark: If the samples are randomly selected, the sample means will be somewhat different from the population mean . These differences are caused by sampling error. Definition: Sampling Error is the difference between the sample measure and the corresponding population measure due to the fact that the sample is not a perfect representation of the population.
- 2. Properties of the Distribution of Sample Means 1. The mean of the sample means will be the same as the population mean. 2. The standard deviation of the sample means will be smaller than the standard deviation of the population, and it will be equal to the population standard deviation divided by the square root of the sample size, that is,
- 3. Example: Suppose a professor gave an eight point quiz to a small class of 4 students. The results of the quiz were 2, 6, 4 and 8. For the sake of discussion, assume that the four students constitute the population. The mean of the population is The standard deviation of the population is
- 4. The graph of the original distribution is shown as follows which is called a uniform distribution. Now, if all samples of size 2 are taken with replacement, and the mean of each sample is found, the distribution is as follows:
- 5. Now, if all samples of size 2 are taken with replacement, and the mean of each sample is found, the distribution is as follows: Sample Mean Sample Mean 2,2 2 6, 2 4 2,4 3 6, 4 5 2,6 4 6, 6 6 2,8 5 6, 8 7 4, 2 3 8, 2 5 4, 4 4 8, 4 6 4, 6 5 8, 6 7 4, 8 6 8, 8 8
- 6. A frequency distribution of sample means is as follows: Frequency 2 1 3 2 4 3 5 4 6 3 7 2 8 1
- 7. The following shows the graph of the sample means which appears to be somewhat normal, even though it is a histogram.
- 8. The mean of the sample means, denoted by which is the same as the population mean. The standard deviation of sample mean, denoted by which is the same as the population standard deviation divided by , that is,