Executive Summary – Genesis’ Financing Needs & Recommended Capital Structure
TABLE OF CONTENTS:
I. Overview
II. Assumptions
III. Cash Budget
IV. Mix of Debt & Equity
V. Recommendations for
Solution
s to Financing Needs
VI. Observations & Recommendations for Operational Changes
VII. Conclusion
OVERVIEW:
As Genesis plans operational and product expansion, it finds itself in need of options for acquiring capital to fund the process. The summary begins with Genesis team’s evaluation of historical data and subsequent assumptions that will drive the process. Born of these assumptions we formulate a cash budget detailing inflow and outflow of cash, and estimating financial needs for the planned expansion, with an eye to the importance of the mix of debt and equity financing comprising the capital structure. Recommended short- and long-term solutions coupled with cost estimates will be presented, as well as recommended operational changes.
ASSUMPTIONS:
1. Sales: Genesis’ marketing expert and its Customer Service personnel developed sales projections based on historical data and forecast research.
2. Other cash receipts is rental income of $15,000 per month.
3. Production Material: the Production Manager forecasted materials costs based on quotes from vendors, averaging 50% of sales.
4. Other production costs: based on historical cost data average 30% of the material cost in the month after the material purchase.
5. Selling & Marketing Expenses: are 5% of sales.
6. General & Administrative Expenses: calculated at 20% of sales.
7. Interest payments: $75,000 payable in Dec.
8. Tax payments: quarterly, $15,000
9. Minimum cash balance desired: $25,000 per month.
10. Cash balance at the start of December: $15,000.
11. Available short-term interest rate = 8%, long-term debt rate = 9%, long-term equity 10%.
Utilizing these assumptions, we formulate Genesis’ Cash Budget to gain a detailed view of cash inflows and outflows, and the surplus deficits (mostly) incurred on a monthly basis for the initial forecasting period of one year, and on a quarterly basis for the subsequent year’s forecast.
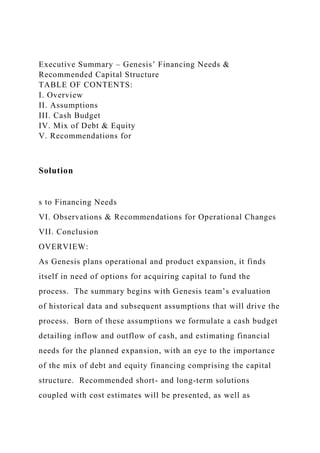
CASH BUDGET:
In general, the cash budget demonstrates overall losses throughout the first forecasting period. In the second period (year 2) the higher sales from the prior months of September, October and November result in gains rather than losses. After subtracting outflow from inflow, and allowing for the $25,000 desired minimum monthly cash balance, we arrive at the dollar amount of capital needed on a monthly basis for the first year (totaling $3,775,000 at year’s end), and on a quarterly basis for the second year (totaling $4112400 for the two years together). Observations regarding the time value of money, specifically as it pertains to the lack of speed in Genesis’ payment collection schedules, and regarding overall costs will be made at the close of this summary. (Note, for quarterly payment collections calculations, I used ½ (.33) of the quart ...
1. Executive Summary – Genesis’ Financing Needs &
Recommended Capital Structure
TABLE OF CONTENTS:
I. Overview
II. Assumptions
III. Cash Budget
IV. Mix of Debt & Equity
V. Recommendations for
Solution
s to Financing Needs
VI. Observations & Recommendations for Operational Changes
VII. Conclusion
OVERVIEW:
As Genesis plans operational and product expansion, it finds
itself in need of options for acquiring capital to fund the
process. The summary begins with Genesis team’s evaluation
of historical data and subsequent assumptions that will drive the
process. Born of these assumptions we formulate a cash budget
detailing inflow and outflow of cash, and estimating financial
needs for the planned expansion, with an eye to the importance
of the mix of debt and equity financing comprising the capital
structure. Recommended short- and long-term solutions
coupled with cost estimates will be presented, as well as
2. recommended operational changes.
ASSUMPTIONS:
1. Sales: Genesis’ marketing expert and its Customer Service
personnel developed sales projections based on historical data
and forecast research.
2. Other cash receipts is rental income of $15,000 per month.
3. Production Material: the Production Manager forecasted
materials costs based on quotes from vendors, averaging 50% of
sales.
4. Other production costs: based on historical cost data average
30% of the material cost in the month after the material
purchase.
5. Selling & Marketing Expenses: are 5% of sales.
6. General & Administrative Expenses: calculated at 20% of
sales.
7. Interest payments: $75,000 payable in Dec.
8. Tax payments: quarterly, $15,000
9. Minimum cash balance desired: $25,000 per month.
10. Cash balance at the start of December: $15,000.
11. Available short-term interest rate = 8%, long-term debt rate
= 9%, long-term equity 10%.
Utilizing these assumptions, we formulate Genesis’ Cash
Budget to gain a detailed view of cash inflows and outflows,
and the surplus deficits (mostly) incurred on a monthly basis for
the initial forecasting period of one year, and on a quarterly
3. basis for the subsequent year’s forecast.
CASH BUDGET:
In general, the cash budget demonstrates overall losses
throughout the first forecasting period. In the second period
(year 2) the higher sales from the prior months of September,
October and November result in gains rather than losses. After
subtracting outflow from inflow, and allowing for the $25,000
desired minimum monthly cash balance, we arrive at the dollar
amount of capital needed on a monthly basis for the first year
(totaling $3,775,000 at year’s end), and on a quarterly basis for
the second year (totaling $4112400 for the two years together).
Observations regarding the time value of money, specifically as
it pertains to the lack of speed in Genesis’ payment collection
schedules, and regarding overall costs will be made at the close
of this summary. (Note, for quarterly payment collections
calculations, I used ½ (.33) of the quarter’s sales where one of
the quarter’s monthly collections fell, and 2/3 (.66) when two
months fell into the calculations.
Genesis’ Cash Budget appears as follows:
MIX of DEBT & EQUITY:
The mix of debt financing and equity financing is important
when considering the capital structure of the firm. A definition
4. of both forms of financing may be in order. Debt financing is
when the firm acquires debt through bank loans or loans from
other creditors, or sells bonds. Equity financing is when the
firm sells various types of stocks, which, it is important to note,
mandates that shareholders receive voting rights in most cases,
as well as other rights including the right to purchase assets
given over to a lender in the case of default on a loan and/or
bankruptcy.
In the case of debt financing, it is important to understand that
the heavier the debt ratio in the capital structure, the higher the
firm’s beta rating, and the higher the stock’s expected rate of
return. Beta is at the heart of expected return ratings, just as
higher expected rates of return at the heart of
investor/shareholder confidence, which in turn is at the heart of
the success of the stock market. Most stock falls between .5
and 1.5 beta, with less than 1 less risky, and more than 1 more
risky.
In the case of equity financing, the firm’s original owners take a
serious risk that new issue shareholders (or any shareholders in
periods past the initial expansion phase of the firm) will
exercise their voting rights and possibly adversely affect the
decision-making process in terms of the direction, growth,
financing and operations/profitability of the firm.
RECOMMENDATIONS FOR SOLUTIONS TO FINANCING
NEEDS (and their related costs):
5. Both long-term debt and financing are recommended.
Long-term debt through the sale of Genesis corporate bonds is
recommended as the largest portion of financing in the capital
structure, in the par value amount of $2 million. We will sell
2,000 bonds at $1,000 each. Since Genesis is a fledgling
company poised on the brink of explosive growth, but without
any historical data to speak of, the firm is then a high credit-
risk (default risk) resulting in a coupon interest rate of 9% per
year interest, including the inflation premium. Genesis will
agree to make biannual interest payments of $90,000 in May
and November yearly until such time as the bonds reach
maturity (we will say 10 years) whereby Genesis will pay in full
on both the principal and interest. The total cost for borrowing
the $2 million will be $1,800,000. However, the short-term
impact is good for the firm’s financial needs right now, as only
interest will be paid until the maturity period is reached. To
mitigate the risk of immediate financial loss in the event of
bonds being called by the investors, Genesis will seek call
protection for 5 years, after which the annual interest rate
divided by the number of years (beginning with 6 in this case)
from the issuance date will give a declining rate of payout.
Long-term equity financing is recommended in the form of
Long-term Equity Anticipation Securities (LEAPS) with a three-
year maturity period and a much longer than the six-month
average expiration date, making them attractive to portfolio
6. investors who want long-term protection for their portfolio.
Generally one share equals one vote, so we will try to sell the
shares at as high a strike price as possible. In order to raise
$1,112,400, Genesis will need to sell 17,138 shares at $65 per
share. There will be no immediate cost for dividends, until such
time as the stocks mature, giving Genesis time to expand and
begin reaping the financial rewards of that expansion before the
dividend expenses hit the cash budget.
Genesis can also utilize the capital-raising vehicle of sale of
11,111 common Class A & 10,204 Class B stocks for $45 and
$49 respectively. The Class B stockholders will retain their
rights, and such stock would generally be sold to the original
owners of the company. Class A common shareholders would
not be able to vote or exercise their options until the stock
matures in a 2 year period, thus protecting the rights of the
owners to “drive the bus” figuratively speaking until the
fledgling company is solidly on a consistent, positive financial
gains path.
A few short-term solutions are in order as well. Since Genesis
is bidding for contracts overseas, it is recommended that it
purchase a currency put option, allowing them to sell, for
example, 12 million euros for a fixed price of $1.50 per euro in
nine months. In this way, Genesis can lock in the future
exchange rate so that if it wins its bids for overseas business, it
will not lose money if the exchange rate takes a turn for the
7. worse. Genesis can also just let the put option expire without
losing a dime if it does not win its bid for the overseas business.
Another short-term option is to offer option grants with a two-
year vesting period to employees as part of their compensation
packages, which bears the advantage of reducing wages (cash
outflow) and increasing profits for the duration of the two-year
vesting period. The short-term cost of this solution is
negligible, amounting to only administration costs, while the
cash wage savings realized can be substantial.
OBSERVATIONS & RECOMMENDATIONS FOR
OPERATIONAL CHANGES:
Genesis’ Purchasing personnel, whether it be the Production
Manager or someone higher in the corporate echelon must
utilize solid relationships with trusted vendors to put pressure
on the entire supply chain to lower the cost of materials,
whether the solution be vendor changes at any point on the
chain, or production or supply changes. For example, perhaps
widgets could be purchased at $2 instead of $3, or perhaps the
producer of widgets could outsource the production to China
and reduce the price even more to $1.50. There are a myriad of
possibilities when pricing pressure is brought to bear on a
supply chain, particularly in a production environment.
In addition, Genesis’ own production process should be
reviewed in the light of cost reduction as well. Perhaps idle
time of the machines is affecting costs, or overtime, or a poor
8. periodic maintenance schedule and performance is leading to
consistent breakdowns, hence a loss of production time, labor
dollars spent, and repair and replacement costs.
Finally, General & Administrative Expenses can surely be
reduced, if only in terms of office supplies and such. Who is
reviewing purchases? Does Dorothy really need an $18 stapler
twice a year? Could Genesis put a coin-operated soda machine
in the break room instead of supplying beverages? Is there a
more inexpensive brand of printer paper? Is Genesis recycling
toner cartridges with the incumbent price break given? There
are generally many ways to reduce expenses in this category if
careful ordering, receiving, and declining budget procedures are
followed.
If Genesis reduced material costs to 40% of sales, additional
costs to 25% of sales, and General & Administrative Expenses
to .18% of sales, the resulting savings over the two-year period
would cover capital needs, leaving only $787,000 outside
funding needed. Truly, this is the route we recommend.
The following is the Cash Budget with the aforementioned
operational changes:
9. If Genesis also sped up collection time, they would have more
money, sooner, to cover needs for expansion funding. The
financial picture is particularly grim in the original Cash
Budget. Note that each month ends with a loss until the first
quarter of the second year. Time truly is money, and the
present value of future cash streams is a vital figure – the value
of money diminishes over time. It is easier to attract investors
when the expected rate of return is high and is immediate
enough. Otherwise, they might as well buy and store
commodities (assets, like gas or gold) rather than invest in a
losing proposition.
The Cash Budget with operational processes revised and a
speed of payment of customer collections of 20% within the
first month and 50% within the second month results in a total
financing need amount of $375,500 for the two year period. It
appears as follows (note the quick positive gains beginning
10. early in the first year rather than early in the second year, as
with the original Cash Budget):
CONCLUSION:
Though revision of operational processes and faster payment
collection are recommended so that Genesis may internally
finance a large portion of its capital funding needs, some
financing needs still exist. It is still recommended that Genesis
employ a mix of debt and equity financing through issuance of
bonds and common stock as outlined above. Capital will always
be an important part of growing the firm, and both long-term
and short-term financing as well as debt and equity financing,
should play a part in the capital structure. It is important to
understand the costs and benefits of each, as explained in this
summary, and to how the fit into the timeline of capital needed
per forecast period. Only then can those “driving the bus” make
informed decisions regarding capital structure that will result in
growth, profits, and more growth.
Resources:
Brigham, E., Ehrhardt, M., Financial Management Theory &
Practice, 13th ed., 2011
11. Genesis Cash Budget ($000)
DecJanFebMarchAprilMayJuneJulyAugSeptOctNovDecMarchJu
neSeptDec
Cash Inflow
Sales (Reference only)
300,000200,000350,000400,000500,000550,000700,000700,000
650,000900,000850,000750,000500,000150,000190,0003,000,00
02,400,000
Cash Collections on Sales
10% in month of sale
30,00020,00035,00040,00050,00055,00070,00070,00065,00090,
00085,00075,00050,00015,00019,000300,000240,000
25% in first month after sale
75,00050,00087,500100,000125,000137,500175,000175,000162,
500225,000212,500187,500149,75043,725510,675643,500
35% in second month after sale
105,00070,000122,500140,000175,000192,500245,000245,0002
27,500315,000297,500454,82566,125405,0002,460,000
30% in third month after sale
90,00060,000105,000120,000150,000165,000210,000210,00019
5,000270,000630,00045,00057,000900,000
Other Cash Receipts
15,00015,00015,00015,00015,00015,00015,00015,00015,00015,
12. 00015,00015,00015,00045,00045,00045,00045,000
Total Cash Inflow
45,000110,000205,000302,500347,500440,000517,500602,5006
65,000722,500762,500812,500820,0001,294,575218,8501,317,6
754,288,500
Cash Outflows
Material Purchases (reference only)
150,000100,000175,000200,000250,000275,000350,000350,000
325,000450,000425,000375,000250,00075,00095,0001,500,0001
,200,000
Payment for Material Purchase
150,000100,000175,000200,000250,000275,000350,000350,000
325,000450,000425,000375,00075,00095,0001,500,0001,200,00
0
100% in month after purchase
Other Cash Payments
Other production cost 30%
45,00030,00052,50060,00075,00082,500105,000105,00097,5001
35,000127,500112,50022,50028,500450,000360,000
of Material cost paid month
after Purchase
Selling and Marketing Expense
15,00010,00017,50020,00025,00027,50035,00035,00032,50045,
00042,50037,50025,0007,5009,500150,000120,000
General and Adminstrative expenses
13. 60,00040,00070,00080,000100,000110,000140,000140,000130,0
00180,000170,000150,000100,00030,00038,000600,000480,000
Interest Payment
75,000 75,000
Tax Payment
15,00015,00015,00015,00015,00015,00015,000
Dividend Payment
00000000000000000
Total Cash Outlfows
150,000245,000217,500327,500400,000462,500532,500645,000
617,500647,500812,500740,000612,500150,000186,0002,715,00
02,250,000
Net Cash Gain/(Loss)
-105,000-135,000-12,500-25,000-52,500-22,500-15,000-
42,50047,50075,000-50,00072,500207,5001,144,57532,850-
1,397,3252,038,500
Cash Flow Summary
Cash Balance start of the month
15,000-90,000-225,000-237,500-262,500-315,000-337,500-
352,500-395,000-347,500-272,500-322,500-250,000-
42,5001,102,0751,134,925-262,400
Net Cash Gain/loss
-105,000-135,000-12,500-25,000-52,500-22,500-15,000-
42,50047,50075,000-50,00072,500207,5001,144,57532,850-
1,397,3252,038,500
14. Cash Balance at end of month
-90,000-225,000-237,500-262,500-315,000-337,500-352,500-
395,000-347,500-272,500-322,500-250,000-
42,5001,102,0751,134,925-262,4001,776,100
Minium cash Balance desired
25,00025,00025,00025,00025,00025,00025,00025,00025,00025,
00025,00025,00025,00075,00075,00075,00075,000
Surplus cash (deficit)
-115,000-250,000-262,500-287,500-340,000-362,500-377,500-
420,000-372,500-297,500-347,500-275,000-
67,5001,027,0751,059,925-337,4001,701,100
External Financing Summary
External Financing Balance
at start of month
New Financing Required
115,000250,000262,500287,500340,000362,500377,500420,000
372,500297,500347,500275,00067,50000337,4000
(negative amount from cash
suplus (deficit)
External Financing Requirement
115,000250,000262,500287,500340,000362,500377,500420,000
372,500297,500347,500275,00067,50000337,4000
External Financing Balance
115,000365,000627,500915,0001,255,0001,617,5001,995,0002,
415,0002,787,5003,085,0003,432,5003,707,5003,775,0003,775,
15. 0003,775,0004,112,4004,112,400
Monthly BudgetQuarterly Budget
Genesis Cash Budget ($000)
DecJanFebMarchAprilMayJuneJulyAugSeptOctNovDecMarchJu
neSeptDec
Cash Inflow
Sales (Reference only)
300,000200,000350,000400,000500,000550,000700,000700,000
650,000900,000850,000750,000500,000150,000190,0003,000,00
02,400,000
Cash Collections on Sales
10% in month of sale
30,00020,00035,00040,00050,00055,00070,00070,00065,00090,
00085,00075,00050,00015,00019,000300,000240,000
25% in first month after sale
75,00050,00087,500100,000125,000137,500175,000175,000162,
500225,000212,500187,500149,75043,725510,675643,500
35% in second month after sale
105,00070,000122,500140,000175,000192,500245,000245,0002
27,500315,000297,500454,82566,125405,0002,460,000
30% in third month after sale
90,00060,000105,000120,000150,000165,000210,000210,00019
5,000270,000630,00045,00057,000900,000
Other Cash Receipts
15,00015,00015,00015,00015,00015,00015,00015,00015,00015,
16. 00015,00015,00015,00045,00045,00045,00045,000
Total Cash Inflow
45,000110,000205,000302,500347,500440,000517,500602,5006
65,000722,500762,500812,500820,0001,294,575218,8501,317,6
754,288,500
Cash Outflows
Material Purchases (reference only)
120,00080,000140,000160,000200,000220,000280,000280,0002
60,000360,000340,000300,000200,00060,00076,0001,200,00096
0,000
Payment for Material Purchase
120,00080,000140,000160,000200,000220,000280,000280,0002
60,000360,000340,000300,00075,00095,0001,500,0001,200,000
100% in month after purchase
Other Cash Payments
Other production cost 30%
30,00020,00035,00040,00050,00055,00070,00070,00065,00090,
00085,00075,00015,00019,000300,000240,000
of Material cost paid month
after Purchase
Selling and Marketing Expense
15,00010,00017,50020,00025,00027,50035,00035,00032,50045,
00042,50037,50025,0007,5009,500150,000120,000
General and Adminstrative expenses
54,00036,00063,00072,00090,00099,000126,000126,000117,000
17. 162,000153,000135,00090,00027,00034,200540,000432,000
Interest Payment
75,000 75,000
Tax Payment
15,00015,00015,00015,00015,00015,00015,000
Dividend Payment
00000000000000000
Total Cash Outlfows
144,000196,000180,500267,000330,000376,500436,000526,000
499,500532,000660,500597,500490,000139,500172,7002,505,00
02,082,000
Net Cash Gain/(Loss)
-99,000-
86,00024,50035,50017,50063,50081,50076,500165,500190,5001
02,000215,000330,0001,155,07546,150-1,187,3252,206,500
Cash Flow Summary
Cash Balance start of the month
15,000-84,000-170,000-145,500-110,000-92,500-
29,00052,500129,000294,500485,000587,000802,0001,132,0002
,287,0752,333,2251,145,900
Net Cash Gain/loss
-99,000-
86,00024,50035,50017,50063,50081,50076,500165,500190,5001
02,000215,000330,0001,155,07546,150-1,187,3252,206,500
Cash Balance at end of month
19. DecJanFebMarchAprilMayJuneJulyAugSeptOctNovDecMarchJu
neSeptDec
Cash Inflow
Sales (Reference only)
300,000200,000350,000400,000500,000550,000700,000700,000
650,000900,000850,000750,000500,000150,000190,0003,000,00
02,400,000
Cash Collections on Sales
10% in month of sale
30,00020,00035,00040,00050,00055,00070,00070,00065,00090,
00085,00075,00050,00015,00019,000300,000240,000
25% in first month after sale
150,000100,000175,000200,000250,000275,000350,000350,000
325,000450,000425,000375,000299,50087,4501,021,3501,287,0
00
35% in second month after sale
105,00070,000122,500140,000175,000192,500245,000245,0002
27,500315,000297,500454,82566,125405,0002,460,000
30% in third month after sale
90,00060,000105,000120,000150,000165,000210,000210,00019
5,000270,000630,00045,00057,000900,000
Other Cash Receipts
15,00015,00015,00015,00015,00015,00015,00015,00015,00015,
00015,00015,00015,00045,00045,00045,00045,000
Total Cash Inflow
20. 45,000185,000255,000390,000447,500565,000655,000777,5008
40,000885,000987,5001,025,0001,007,5001,444,325262,5751,8
28,3504,932,000
Cash Outflows
Material Purchases (reference only)
120,00080,000140,000160,000200,000220,000280,000280,0002
60,000360,000340,000300,000200,00060,00076,0001,200,00096
0,000
Payment for Material Purchase
120,00080,000140,000160,000200,000220,000280,000280,0002
60,000360,000340,000300,00075,00095,0001,500,0001,200,000
100% in month after purchase
Other Cash Payments
Other production cost 30%
30,00020,00035,00040,00050,00055,00070,00070,00065,00090,
00085,00075,00015,00019,000300,000240,000
of Material cost paid month
after Purchase
Selling and Marketing Expense
15,00010,00017,50020,00025,00027,50035,00035,00032,50045,
00042,50037,50025,0007,5009,500150,000120,000
General and Adminstrative expenses
54,00036,00063,00072,00090,00099,000126,000126,000117,000
162,000153,000135,00090,00027,00034,200540,000432,000
Interest Payment
21. 75,000 75,000
Tax Payment
15,00015,00015,00015,00015,00015,00015,000
Dividend Payment
00000000000000000
Total Cash Outlfows
144,000196,000180,500267,000330,000376,500436,000526,000
499,500532,000660,500597,500490,000139,500172,7002,505,00
02,082,000
Net Cash Gain/(Loss)
-99,000-
11,00074,500123,000117,500188,500219,000251,500340,50035
3,000327,000427,500517,5001,304,82589,875-
676,6502,850,000
Cash Flow Summary
Cash Balance start of the month
15,000-84,000-95,000-
20,500102,500220,000408,500627,500879,0001,219,5001,572,5
001,899,5002,327,0002,844,5004,149,3254,239,2003,562,550
Net Cash Gain/loss
-99,000-
11,00074,500123,000117,500188,500219,000251,500340,50035
3,000327,000427,500517,5001,304,82589,875-
676,6502,850,000
Cash Balance at end of month