6 city report
•
0 gefällt mir•257 views

May housing statistics for southwest California plus 2010 forecast by CAR CEO Joel Singer

Empfohlen
Weitere ähnliche Inhalte
Was ist angesagt?
Was ist angesagt? (20)
Ähnlich wie 6 city report
Ähnlich wie 6 city report (20)
Mehr von Southwest Riverside County Association of Realtors
Mehr von Southwest Riverside County Association of Realtors (20)
Kürzlich hochgeladen
Kürzlich hochgeladen (20)
6 city report
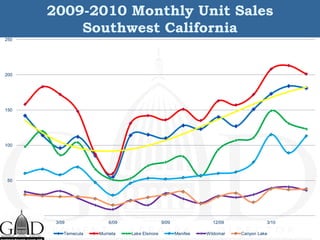
- 1. 2009-2010 Monthly Unit Sales Southwest California 250 200 150 100 50 0 3/09 6/09 9/09 12/09 3/10 Temecula Murrieta Lake Elsinore Menifee Wildomar Canyon Lake
- 2. 2009-2010 Median Price Southwest California $350,000 $300,000 $250,000 $200,000 $150,000 $100,000 $50,000 $0 3/09 6/09 9/09 12/09 3/10 Temecula Murrieta Lake Elsinore Menifee Wildomar Canyon Lake
- 3. May Demand Chart 600 5 3 7 500 4 1 3 5 3 8 3 6 400 8 3 0 2 5 7 2 300 1 5 1 2 1 1 9 1 3 4 7 200 1 9 1 4 3 0 1 2 0 7 3 7 7 7 6 6 6 6 6 7 6 100 6 5 6 9 5 3 7 7 8 4 7 8 0 9 5 5 2 6 2 0 2 2 2 2 7 2 1 8 . . . . . . 9 8 3 3 6 4 7 0 On Market (Supply) Pending Closed (Demand) Days on Market % Selling Months Supply Murrieta Temecula Lake Elsininore Menifee Canyon Lake Wildomar Data courtesy of MRMLS
- 4. Market by Activity & Sales Type May Market Activity by Sales Type % Active Closed Failed In Escrow Activity Bank Owned 20% 42% 7% 31% 27% Short Sales 47% 32% 67% 51% 47% Standard Sales 33% 26% 26% 18% 26% Other 1% 1% 2% 1% 1% Data courtesy of StatsforAgents.com
- 5. 2010 Midyear Update Luncheon: “Looking Back to Look Forward” SHOWCASE LUNCHEON June 10, 2010 Joel Singer Executive Vice President CALIFORNIA ASSOCIATION OF REALTORS®
- 6. Where We’ve Been: A Look Back at California Housing Cycles • Familiar Patterns – Different Causations • Prices are no longer sticky going down • Real cost of housing does matter • Record sales may not mean market sustainability • California Housing has (always) shown resiliency
- 7. Overview: 3 Recent Housing Cycles California Sales of Existing Homes and Median Price UNITS/MEDIAN PRICE $ Sales of Existing Detached Homes Median Price 700,000 600,000 -44% 500,000 -61% -25% 400,000 300,000 200,000 100,000 0 1970 1972 1974 1976 1978 1980 1982 1984 1986 1988 1990 1992 1994 1996 1998 2000 2002 2004 2006 2008 2010 SOURCE: California Association of REALTORS®
- 8. California vs. U.S. Median Prices 1970-2009 $600,000 California $500,000 US CA Price Trend $400,000 $300,000 $200,000 $100,000 $0 1970 1972 1974 1976 1978 1980 1982 1984 1986 1988 1990 1992 1994 1996 1998 2000 2002 2004 2006 2008 SOURCE: CALIFORNIA ASSOCIATION OF REALTORS®
- 9. Housing Affordability Index California Vs. U.S. – 1984-2009 % OF HOUSEHOLDS THAT CAN BUY, ANNUAL RATE 70% US - CA CA US 60% 50% 40% 30% 20% 10% 0% 1984 1986 1988 1990 1992 1994 1996 1998 2000 2002 2004 2006 2008 SOURCE: CALIFORNIA ASSOCIATION OF REALTORS® Traditional Housing Affordability Index
- 10. Mortgage Financing: Longer-term Trends and Realities • Shift from Dedicated Housing Lenders • Refi’s Add Risk/Constrict Capital • Gov’t Dependency is at All time Highs • Real Issue: Whither the GSE’s?
- 11. US Home Mortgage Debt Growth % 1972 to 2009 % 20 19 18 17 16 15 14 13 12 11 10 9 8 7 6 5 4 3 2 1 0 -1 -2 1972 1974 1976 1978 1980 1982 1984 1986 1988 1990 1992 1994 1996 1998 2000 2002 2004 2006 2008 SOURCE: Federal Reserve Board
- 12. US Home Mortgage Debt Outstanding 1-4 Residences 1949 to 2009 In Millions 12,000,000 10,000,000 8,000,000 6,000,000 4,000,000 2,000,000 0 Q1-1970 Q1-1972 Q1-1974 Q1-1976 Q1-1978 Q1-1980 Q1-1982 Q1-1984 Q1-1986 Q1-1988 Q1-1990 Q1-1992 Q1-1994 Q1-1996 Q1-1998 Q1-2000 Q1-2002 Q1-2004 Q1-2006 Q1-2008 SOURCE: Federal Reserve Board
- 13. CA Real Estate 1-4 Residential Loans Commercial Banking Institutions vs. Savings Institutions In Millions Commercial Banks S&Ls 400,000 380,000 360,000 340,000 320,000 300,000 280,000 260,000 240,000 220,000 200,000 180,000 160,000 140,000 120,000 100,000 80,000 60,000 40,000 20,000 0 1984 1986 1988 1990 1992 1994 1996 1998 2000 2002 2004 2006 2008 SOURCE: FDIC
- 14. Refinance vs. Purchase Share REFINANCE/PURCHASE SHARE 30- YR FIXED RATE MORTGAGE 100% Refinance Share (%) Purchase Share (%) 12% Fixed Rate Mortgage 90% 10% 80% 70% 8% 60% 50% 6% 40% 4% 30% 20% 2% 10% 0% 0% Q1/90 Q1/91 Q1/92 Q1/93 Q1/94 Q1/95 Q1/96 Q1/97 Q1/98 Q1/99 Q1/00 Q1/01 Q1/02 Q1/03 Q1/04 Q1/05 Q1/06 Q1/07 Q1/08 Q1/09 Source: Mortgage Bankers Association of America
- 15. Cash Out Refinances Drove Subprime & Alt-A Refis Mar-10 Apr-09 Apr-08 Sub Prime Loans Outstanding 289,278 363,274 485,222 % Owner Occupied 94% 94% 94% % Cash Out Refi (Sub Prime Owner Occ) 65% 61% 55% Alt A Loans Outstanding 554,587 643,511 722,049 % Owner Occupied 80% 80% 81% % Cash Out Refi (Alt-A Owner Occ) 48% 47% 45% Source: FirstAmerican CoreLogic, LoanPerformance Data, U.S. Census Bureau, and Federal Reserve Bank of New York
- 16. By 2005 53.5% of New CA Loans were “Jumbos” Above the Maximum Conforming Loan Limit (New First Mortgage) Conforming Loans Jumbo Loans Loan Limit 100% 4% $800,000 $700,000 80% $600,000 60% $500,000 96% $400,000 40% $300,000 $200,000 20% $100,000 0% $0 2001 2002 2003 2004 2005 2006 2007 2008 2009 Source: C.A.R. Annual Housing Market Survey
- 17. Sub-Prime Share Below 10% Until 2004 % of Dollar Volume Sub Prime Alt-A HEL 25% 20% 15% 10% 5% 0% 1990 1991 1992 1993 1994 1995 1996 1997 1998 1999 2000 2001 2002 2003 2004 2005 2006 2007 2008 2009 Source: Inside Mortgage Finance, compiled by C.A.R.
- 18. Down-payments also reflect affordability By 2006 40% of 1st timers put zero down All Hom buyers First-Tim e Buyers Repeat Buyers 50% 40% 30% 20% 5.0% 10% 3.7% 2.8% 0% 1991 1995 1997 1999 2001 2003 2005 2007 2009 Source: C.A.R. Annual Housing Market Survey
- 19. 2nd Mortgages Also Track Affordability Challenge Over 30% in 1981-82 and 2005-07 % 2nd Mtgs Purchases Made with Second Mortgage CA-HAI 60% Housing Affordability Index (HAI) 60% 50% 50% 40% 40% 30% 30% 20% 20% 10% 10% 0% 0% 1981 1983 1985 1987 1989 1991 1993 1995 1997 1999 2001 2003 2005 2007 2009 Source: C.A.R. Annual Housing Market Survey, C.A.R. Housing Affordability Index
- 20. Share of ARM’s Rises As Affordability Deteriorates: Fuels demand for housing 100% FRM ARM Other 80% 60% 40% 20% 0% 83 85 87 89 91 93 95 97 99 01 03 05 07 09 Source: C.A.R. Annual Housing Market Survey
- 21. US Residential Secondary Mortgage Market Active Pool Balances Aggregate Securitized Jumbo Loans In $ Billions Aggregate Securitized Subprime Loans $1,000 Aggregate Securitized Alt-A Loans $900 $800 $700 $600 $500 $400 $300 $200 $100 $0 Jan-95 Jan-96 Jan-97 Jan-98 Jan-99 Jan-00 Jan-01 Jan-02 Jan-03 Jan-04 Jan-05 Jan-06 Jan-07 Jan-08 Jan-09 SOURCE: Moody’s Analytics
- 22. The Crash Decimated Secondary . markets • Decimated secondary markets Historically unprecedented price • Historically unprecedented price declines declines Equally unprecedented • Equally unprecedented delinquencies, delinquencies, foreclosures foreclosures
- 23. Four Year Housing Boom 2002 – 2005 UNITS Sales Consumer Confidence INDEX 700,000 Housing Boom 160 600,000 140 120 500,000 100 400,000 80 300,000 60 200,000 40 100,000 20 0 0 Jan-00 Apr-00 Jan-01 Apr-01 Jan-02 Apr-02 Jan-03 Apr-03 Jan-04 Apr-04 Jan-05 Apr-05 Jan-06 Apr-06 Jan-07 Apr-07 Jan-08 Apr-08 Jan-09 Apr-09 Jan-10 Apr-10 Jul-00 Oct-00 Jul-01 Oct-01 Jul-02 Oct-02 Jul-03 Oct-03 Jul-04 Oct-04 Jul-05 Oct-05 Jul-06 Oct-06 Jul-07 Oct-07 Jul-08 Oct-08 Jul-09 Oct-09 SOURCE: California Association of REALTORS®; The Conference Board *Sales are seasonally adjusted and annualized
- 24. Unprecedented Impact on Statewide Median Price Down 59% in Two Years $700,000 P: May-07 $594,530 $600,000 $500,000 T: Feb-09 $245,230 -59% from $400,000 peak $300,000 $200,000 $100,000 $0 Jan-01 Jan-02 Jan-03 Jan-04 Jan-05 Jan-06 Jan-07 Jan-08 Jan-09 Jan-10 Jul-01 Jul-02 Jul-03 Jul-04 Jul-05 Jul-06 Jul-07 Jul-08 Jul-09 SOURCE: California Association of REALTORS®
- 25. CA Peak to Trough Price Decline: -59% Sacramento Region First to Peak Aug 2005 Peak Trough Trough % Chg Region Peak Price Month Month Price From Peak Monterey Region Aug-07 $798,210 Feb-09 $241,130 -69.8% High Desert Apr-06 $334,860 May-09 $106,210 -68.3% Riverside/San Bernardino Jan-07 $415,160 Apr-09 $156,840 -62.2% Palm Springs/Lower Desert Jun-05 $393,370 Apr-09 $150,140 -61.8% CALIFORNIA May-07 $594,530 Feb-09 $245,170 -58.8% Sacramento Aug-05 $394,450 Apr-09 $167,340 -57.6% San Francisco Bay Area May-07 $853,910 Feb-09 $399,040 -53.3% Northern Wine Country Jan-06 $645,080 Feb-09 $310,950 -51.8% Los Angeles Aug-07 $605,300 Mar-09 $295,100 -51.2% Ventura Aug-06 $710,910 Feb-09 $359,630 -49.4% Santa Clara Apr-07 $868,410 Feb-09 $445,000 -48.8% San Diego May-06 $622,380 Mar-09 $326,830 -47.5% San Luis Obispo Jun-06 $620,540 Apr-09 $338,160 -45.5% Orange County Apr-07 $747,260 Jan-09 $423,100 -43.4% SOURCE: California Association of REALTORS®
- 26. Foreclosure & Delinquency Rates Rose Rapidly California: Q1-2010, NSA Delinquency Rate - CA Delinquency Rate - L/T Avg 12% Foreclosure Rate - CA Foreclosure Rate L/T Avg 10% 8% 6% Delinquencies: Long Run Average: 4.2% 4% Foreclosure Rate: Long Run Average: 1.1% 2% 0% Q1-1979 Q2-1980 Q3-1981 Q4-1982 Q1-1984 Q2-1985 Q3-1986 Q4-1987 Q1-1989 Q2-1990 Q3-1991 Q4-1992 Q1-1994 Q2-1995 Q3-1996 Q4-1997 Q1-1999 Q2-2000 Q3-2001 Q4-2002 Q1-2004 Q2-2005 Q3-2006 Q4-2007 Q1-2009 SOURCE: Mortgage Bankers Association
- 27. NODs & Trustees Deeds Escalated 2005 - present No. of Defaults or TDs Notices of Default Trustee's Deeds 60000 50000 40000 30000 20000 10000 0 Jan-05 Apr-05 Jan-06 Apr-06 Jan-07 Apr-07 Jan-08 Apr-08 Jan-09 Apr-09 Jan-10 Apr-10 Jul-05 Oct-05 Jul-06 Oct-06 Jul-07 Oct-07 Jul-08 Oct-08 Jul-09 Oct-09 Source: ForeclosureRadar.com, C.A.R.
- 28. Lower-priced Sales Dominate the Market October 2004 – present Under 500 500 to 999 1 Mil + 90% 74.0% 80% 70% 60% 50% 40% 30% 19.3% 20% 6.5% 10% 0% 2004.10 2005.01 2005.04 2005.07 2005.10 2006.01 2006.04 2006.07 2006.10 2007.01 2007.04 2007.07 2007.10 2008.01 2008.04 2008.07 2008.10 2009.01 2009.04 2009.07 2009.10 2010.01 2010.04 SOURCE: California Association of REALTORS® SOURCE: Mortgage Bankers Association, C.A.R.
- 29. Net Cash To Sellers Peaked 2004 – 2007 Now Back to Mid-90’s $240,000 $220,000 $200,000 $180,000 $160,000 $140,000 $120,000 $100,000 $80,000 $60,000 $50,000 $40,000 Median $20,000 $0 1989 1991 1993 1995 1997 1999 2001 2003 2005 2007 2009 Q. What was the net cash gain or net loss to the seller as a result of this sale? Source: CAR Annual Housing Market Survey
- 30. 1/3 of Sellers with Loss in 2009, Up Significantly from Mid-2000s 35% 32.9% 30% 25% 20% Long Run Average = 9.3% 15% 10% 5% 0% 1994 1995 1996 1997 1998 1999 2000 2001 2002 2003 2004 2005 2006 2007 2008 2009 Q. What was the net cash gain or net loss to the seller as a result of this sale? Source: CAR Annual Housing Market Survey
- 31. Where We are Today We are past the bottom in almost all sectors Distressed sales remain (and will for some time) Price appreciation differentials Areas of weakness
- 32. Distressed Inventories Lean Price Range (Thousand) Apr-10 Mar-10 Apr-09 $1,000K+ 9.7 10.9 18.7 $750-1000K 6.4 6.2 10.3 $500-750K 5.4 5.1 5.8 $300-500K 4.5 4.2 4.1 $0-300K 3.3 3.2 3.0 SOURCE: CALIFORNIA ASSOCIATION OF REALTORS®
- 33. Properties Under Contract in CA May 2010: 21,432 Units, Down 16.9% MTM, Up 2.0 YTY UNITS Based on Selected MLSs in California 30,000 25,000 20,000 15,000 10,000 5,000 0 Sep-06 Jan-07 Jul-07 Sep-07 Jan-08 Jul-08 Sep-08 Jan-09 Jul-09 Sep-09 Jan-10 Nov-06 Nov-07 Nov-08 Nov-09 Mar-07 May-07 Mar-08 May-08 Mar-09 May-09 Mar-10 May-10 SOURCE: Clarus MarketMetrics, compiled by C.A.R. Preliminary Data for 5/2010
- 34. Pendings down MTM but up YTY (MLS data) MTM % YTY % County/Region May-10 Change Change LA, Orange, Riverside, & San Bernardino 13,526 -8.7% 16.0% Palm Spring, Palm Desert 871 -14.1% 19.8% San Diego 1,961 -19.2% -2.6% San Luis Obispo 394 -12.1% 5.9% Central Contra Costa, Alameda 2,365 -18.3% 1.5% Marin, Mendocino, Napa, Solano, and Sonoma 1,546 -13.6% 14.8% Monterey, San Benito, San Mateo, Santa Clara, Santa Cruz 2,843 -3.2% 16.2% SOURCE: Clarus Market Metrics for various MLSs, compiled by C.A.R.
- 35. CA Trough to Current Price All Regions up from Bottom Trough Trough Apr-10 % Chg From Region Month Price Median Trough San Francisco Bay Area Feb-09 $399,040 $583,280 46.2% Santa Clara Feb-09 $445,000 $628,000 41.1% Monterey Region Feb-09 $241,130 $326,360 35.3% Palm Springs/Lower Desert Apr-09 $150,140 $197,040 31.2% CALIFORNIA Feb-09 $245,170 $306,230 24.9% Ventura Feb-09 $359,630 $442,610 23.1% High Desert May-09 $106,210 $127,300 19.9% San Diego Mar-09 $326,830 $388,480 18.9% Riverside/San Bernardino Apr-09 $156,840 $183,970 17.3% Orange County Jan-09 $423,100 $491,120 16.1% San Luis Obispo Apr-09 $338,160 $390,240 15.4% Los Angeles Mar-09 $295,100 $338,970 14.9% Northern Wine Country Feb-09 $310,950 $355,000 14.2% Sacramento Apr-09 $167,340 $188,100 12.4% SOURCE: California Association of REALTORS®
- 36. Serious Delinquency Rates Are Leveling Off Fannie Mae: Conventional Single Family 6.0% 5.0% 4.0% 3.0% 2.0% 1.0% 0.0% Aug-09 Nov-09 Jun-09 Oct-09 Dec-09 Jan-10 Feb-10 Apr-09 Jul-09 Sep-09 May-09 Mar-09 Mar-10 SOURCE: Fannie Mae Monthly Volume Summary
- 37. REO Share of Total Sales is Declining REO Sales to Total Sales Ratio County/Region Apr-09 Mar-10 Apr-10 Kern NA 54.1% 50.3% Los Angeles 50.5% 26.8% 26.1% Orange 36.5% 16.9% 17.0% Riverside/San Bernardino 78.8% 48.1% 40.5% Sacramento NA 39.6% 38.7% San Diego NA 24.1% 20.7% San Luis Obispo 37.2% 28.1% 27.1% SOURCE: California Association of REALTORS®
- 38. Short Sales are on Upward Trend Short Sales to Total Sales Ratio County/Region Apr-09 Mar-10 Apr-10 Kern NA 17.5% 18.4% Los Angeles 14.5% 22.5% 22.9% Orange 19.0% 23.6% 23.2% Riverside/San Bernardino 8.8% 23.3% 22.5% Sacramento NA 24.7% 23.6% San Diego NA 6.0% 7.8% San Luis Obispo 10.4% 17.1% 11.8% SOURCE: California Association of REALTORS®
- 39. California Foreclosure Filings Down May 2010: 21,883 NODs • 26,123 NTSs Notice of Trustee Sale - Counts Notice of Defaults - Counts 65,000 60,000 6 Month Average: 55,000 50,000 NODs: 29,623 45,000 NTSs: 28,218 40,000 35,000 30,000 25,000 20,000 15,000 10,000 5,000 0 Aug-07 Nov-07 Aug-08 Nov-08 Aug-09 Nov-09 Jan-07 Feb-07 Apr-07 Jun-07 Sep-07 Oct-07 Dec-07 Jan-08 Feb-08 Jul-07 Apr-08 Jun-08 Sep-08 Oct-08 Dec-08 Jan-09 Feb-09 Jun-09 Jul-08 Apr-09 Oct-09 Dec-09 Jan-10 Feb-10 Jul-09 Sep-09 Apr-10 May-07 May-08 May-09 May-10 Mar-07 Mar-08 Mar-09 Mar-10 SOURCE: ForeclosureRadar.com
- 40. 0 5,000 10,000 15,000 20,000 25,000 30,000 Jan-07 Feb-07 Mar-07 Apr-07 May-07 Jun-07 Jul-07 REO: 13,709 Aug-07 SOURCE: ForeclosureRadar.com Sep-07 3rd Party: 3,741 Oct-07 6 Month Average: Cancelled: 15,553 REOs Nov-07 Dec-07 Jan-08 Feb-08 Mar-08 Apr-08 May-08 Jun-08 Jul-08 Aug-08 Sep-08 Oct-08 Sold to 3rd Party Nov-08 Dec-08 Jan-09 Cancellations Feb-09 Mar-09 Apr-09 May-09 Jun-09 Jul-09 Cancellations Aug-09 Sep-09 Oct-09 Nov-09 Dec-09 Jan-10 Feb-10 Mar-10 Apr-10 May-10: 13,719 REOs • 4,027 Sold to 3rd Party • 17,262 Cancelled May-10
- 41. Historic Increase in Affordability California 11 10 Median Price to Median HH Income Ratio 10 9 8 Average Over Years Shown: 6:1 Ratio 7 6 6 6 5 4.5 4 4 3 2 1 0 1989 1990 1991 1992 1993 1994 1995 1996 1997 1998 1999 2000 2001 2002 2003 2004 2005 2006 2007 2008 2009 SOURCE: California Association of REALTORS®
- 42. Proportion of First-Time Homebuyers California 60% % First-Tim e Hom e Buyers Long Run Average 47.0% 50% 38.6% 40% 30% 20% 10% 0% 81 83 85 87 89 91 93 95 97 99 01 03 05 07 09 Q. Was the buyer a first-time buyer? Source: C.A.R. Annual Housing Market Survey
- 43. Investors Share of Current Market -Average Overall Share of Buying Side of Transactions- Please tell us what share of your real estate business on the buying side of the transaction is devoted to 50.00% Jan-10 Mar-10 45.00% 40.30% 40.00% 35.00% 33.50% 30.00% 26.20% 25.00% 20.00% 15.00% 10.00% 5.00% 0.00% First-Time Buyers (%) Repeat Buyers (%) Investor Buyers (% Source: C.A.R. Broker Confidence Survey
- 44. FHA and VA Mortgages (First Mortgage) 40% FHA VA 35% 4.7% 30% 25% 20% 15% 32.0% 10% 5% 0% 2001 2002 2003 2004 2005 2006 2007 2008 2009 Q. Please indicate the type of mortgage CAR 2009 Annual Housing Market Survey
- 45. 0% 20% 40% 60% 80% 2004 Q1 100% 2004 Q2 2004 Q3 2004 Q4 2005 Q1 2005 Q2 2005 Q3 2005 Q4 SOURCE: Inside Mortgage Finance, compiled by C.A.R. 2006 Q1 2006 Q2 73% 2006 Q3 2006 Q4 2007 Q1 2007 Q2 Off Sharply since 2007 2007 Q3 2007 Q4 2008 Q1 2008 Q2 2008 Q3 2008 Q4 Jumbo Share of Mortgage Originations 13%
- 46. Fed & Treasury Market Intervention Drives Conf/Jumbo Spread Toward “Normal”…But Not There Yet Conv/Conf 30-Yr FRM N.C Jumbo 30-Yr FRM Spread 10% L/R Avg Spread: 1.6% 9% 8% 7% 6% 5% 4% 3% 2% 1% 0% Aug-08 Nov-08 Aug-09 Nov-09 Jan-08 Feb-08 Apr-08 Jun-08 Sep-08 Oct-08 Dec-08 Jan-09 Feb-09 Jul-08 Jun-09 Sep-09 Oct-09 Dec-09 Jan-10 Feb-10 Apr-09 Jul-09 Apr-10 May-08 May-09 May-10 Mar-08 Mar-09 Mar-10 SOURCE: Inside Mortgage Finance, compiled by C.A.R. Note: data for research purposes only, do not redistribute
- 47. 2010 Forecast:
- 48. Market 2010 and Beyond • Worst of market decline has past • Sales: • CA: recovering since late 2007 • US: bottom in late 2007, recovering since mid 2009 – Prices: • CA & US : trough in early 2009, up since • Name of the game: Financing • Distressed properties in many markets for next 2--3 yrs • Flow of distressed loans managed by lenders, some loans diverted by Fed programs • High end markets constrained by jumbo financing, but situation is improving
- 49. California Housing Market Outlook 2003 2004 2005 2006 2007 2008 2009 2010f SFH Resales 601.8 624.7 625.0 477.5 346.9 439.8 546.5 521.0 (000s) % Change 5.1% 3.8% 0.03% -23.6% -27.3% 26.8% 24.3% -4.7% Median Price $371.5 $450.8 $522.7 $556.4 $560.3 $346.4 $275.0 $300.0 ($000s) % Change 17.5% 21.3% 16.0% 6.5% 0.7% -38.2% -20.6% 9.1% 30-Yr FRM 5.8% 5.8% 5.9% 6.4% 6.3% 6.0% 5.1% 5.3% 1-Yr ARM 3.8% 3.9% 4.5% 5.5% 5.6% 5.2% 4.7% 4.2% Forecast Date: June 2010 Source: CALIFORNIA ASSOCIATION OF REALTORS®
- 50. New Construction Will Return CA New Housing Permits: -83% FROM 2004 300,000 Single Family Multi-Family 250,000 200,000 150,000 100,000 50,000 0 1988 1989 1990 1991 1992 1993 1994 1995 1996 1997 1998 1999 2000 2001 2002 2003 2004 2005 2006 2007 2008 2009 SOURCE: CBIA
- 51. 50% 55% 60% 65% 70% 1984 1985 1986 1987 SOURCE: U.S, Census Bureau 1988 1989 1990 1991 1992 1993 1994 1995 CA 1996 1997 1998 US 1999 California Vs. U.S. 2000 2001 2002 Homeownership Rates 2003 2004 2005 2006 2007 2008 2009
- 52. Buyers Remain Optimistic on Prices All Buyers, 2010 1 year 5 years 10 years Up 23% 52% 76% Dow n 0% 0% 0% Flat 28% 12% 2% Don't Know 48% 36% 22% Q. Do you think home prices in your neighborhood will go up, down, or stay flat in 1 year? 5 years? 10 years? Source: C.A.R. 2010 Survey of California Home Buyers
- 53. Thank You Joel Singer joels@car.org