Cybercrime & global mapping

This paper presents suggestions for an exploratory approach to understanding cybercrime that we call “cybercartography” using a set of tools that have not been frequently applied to this domain. We refer to 1) fifty-plus years of experience by scientists and governments in integrating socioeconomic and political data organized by administrative boundaries with satellite raster and global gridded global data sets 2) gridded global models 3) global event data sets 4) centuries of experience with the art and science of cartography. To make this less abstract, consider the broad generalization that most current generation cyberthreat maps involve lots of blinking dots and network graphs superimposed over an outline or “blue marble” view of the world. Then compare some of the cartographic techniques that are often used to map other knowledge domains—for example, National Geographic-style cartography, high-resolution administrative boundary maps produced using the US census, and gridded global data sets. A deeper level of insight into the world of cybercrime can be gained in combining the standard cyberthreat network analyses with place-specific variables which can lead to greater insights into who the cybercriminals are, what makes a particular region fertile ground for these activities, why some regions are less susceptible to developing cybercriminals, and where new criminal activities are likely to spring-up and flourish. These different approaches are not superior to one another, but they can be complementary.

Empfohlen
Empfohlen
Weitere ähnliche Inhalte
Was ist angesagt?
Was ist angesagt? (20)
Ähnlich wie Cybercrime & global mapping
Ähnlich wie Cybercrime & global mapping (20)
Kürzlich hochgeladen
Kürzlich hochgeladen (20)
Cybercrime & global mapping
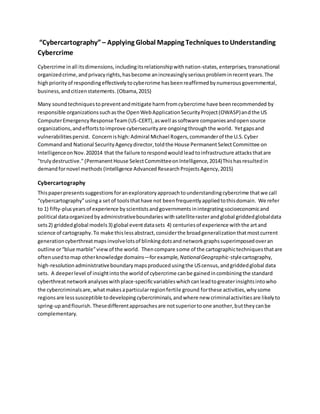
- 1. “Cybercartography” – Applying Global Mapping Techniques toUnderstanding Cybercrime Cybercrime inall itsdimensions,includingitsrelationshipwithnation-states,enterprises,transnational organizedcrime,andprivacyrights,hasbecome anincreasinglyseriousprobleminrecentyears.The highpriorityof respondingeffectivelytocybercrime hasbeenreaffirmedbynumerousgovernmental, business,andcitizenstatements. (Obama,2015) Many soundtechniquestopreventandmitigate harmfromcybercrime have beenrecommended by responsible organizationssuchasthe OpenWebApplicationSecurityProject(OWASP)andthe US ComputerEmergencyResponseTeam(US-CERT),aswell assoftware companiesandopensource organizations,andeffortstoimprove cybersecurityare ongoingthroughthe world. Yetgapsand vulnerabilitiespersist. Concernishigh:Admiral Michael Rogers,commanderof the U.S.Cyber Commandand National SecurityAgencydirector,toldthe House PermanentSelectCommittee on IntelligenceonNov.202014 that the failure torespondwouldleadtoinfrastructure attacksthatare "trulydestructive." (PermanentHouse SelectCommitteeonIntelligence,2014)Thishasresultedin demandfornovel methods (Intelligence AdvancedResearchProjectsAgency,2015) Cybercartography Thispaperpresentssuggestionsforanexploratoryapproachtounderstandingcybercrime thatwe call “cybercartography”usinga setof toolsthathave not beenfrequentlyappliedtothisdomain. We refer to 1) fifty-plusyearsof experience byscientistsandgovernmentsinintegratingsocioeconomicand political dataorganizedbyadministrativeboundaries withsatelliterasterandglobal griddedglobaldata sets2) griddedglobal models3) global eventdatasets 4) centuriesof experience withthe artand science of cartography.To make thislessabstract,considerthe broadgeneralizationthatmostcurrent generationcyberthreatmapsinvolvelotsof blinkingdotsandnetworkgraphssuperimposedoveran outline or“blue marble”viewof the world. Thencompare some of the cartographictechniquesthatare oftenusedtomap otherknowledge domains—forexample, NationalGeographic-stylecartography, high-resolutionadministrativeboundarymapsproducedusingthe UScensus,andgriddedglobal data sets. A deeperlevel of insightintothe worldof cybercrime canbe gainedincombiningthe standard cyberthreatnetworkanalyseswithplace-specificvariableswhichcanleadtogreaterinsightsintowho the cybercriminalsare,whatmakesaparticularregionfertile ground forthese activities,whysome regionsare lesssusceptible todevelopingcybercriminals,andwhere new criminalactivitiesare likelyto spring-upandflourish. Thesedifferentapproachesare notsuperiortoone another,buttheycanbe complementary.
- 2. Figure 1. Left to right: Real-time cyberthreat map (animated) (Norse, 2015); award-winning map of the United States (Imus, 2012); “hard to count” indicator for Census tracts in New York generated using 12 variables (Donnelly, 2010); and Gridded Population of the World composed of 399,381 administrative boundary units;West Africa is shown (Center for International Earth Science Information Network, CIAT, & Columbia University, 2005). Currentmappingof cybercrime seemstobe focusedonreal-timemappingof eventsand technical attributessuchas IP,port, andsignature. These methodsare well suitedtoseveral fundamental attributesof the cyberrealm:1) it isa structured networkof networksthatare significantlyindependent of physical andadministrative boundaries;2) attacksoccur in veryhigh volumesandata microsecond tempo;3) identificationandattributionof attackersandattack vectorsischallenging;and4) the physical locationof attackersgenerallydoesnotconstraintheirabilitytolaunchattacks. Butthese fundamentals are notabsolutes,andcurrentmethodsare part of a systemthatneedsimprovementtomeetits mission. Anothersetof issuesarises fromthinkingaboutthe nature of differenttypesof data (asopposedtothe nature of the realm). Cyberdata is present-focusedandcollectioncanbe close tocomplete, whereas socioeconomicandpolitical dataare usuallyeitherretrospective orprospective andare usually characterizedbymanygaps and uncertainties. Retrospective socioeconomicdataare oftensparse with regardto time and administrative coverage andinconsistentlygathered—forexample,everynation collectscensusdatainits ownway,oftenona differentschedule thanitspeers,withwidelyvarying levelsof depthandsophistication. Bythe same token,prospectivedataare,simplyput,projections whose accuracy has yetto be confirmed. Bythese standards,cyberdata manyadvantages,notleastits availability andscalability. Yet socioeconomicandpolitical datagatheringisaimedatunderstanding the human elementof problems, whichisjustasintegral asthe technical elementto“wickedproblems” such as cybersecuritythatare highlycomplexandresistant tounderstandingandresolution (Buchanan, 1992; Chang,2013; Churchman,1967). Human-focuseddatacan shedlightonintentions,motivations, and capabilitiesof attackers,illuminatedbytheirsocioeconomiccontext. Similarly,suchdatacan provide insightintothe extent,nature,andvulnerabilityof humantargetsincontext. Global Toolkits We turnnow to a brief discussionof how global socioeconomicandpolitical datahave beenusedin conjunctionwithglobal datasetsfromphysical andtechnical domains,global eventdata,andglobal models— togetherconstitutinga“global toolkit”forunderstandingandmanaging global strategicrisks. Keylandmarksinthe historyof global datasetsinclude programssuchas the CIA’sCORONA program, LANDSAT,andNASA’SMissiontoPlanetEarth(the Earth ObservingSystem, orEOS),all of whichhave yieldedimportantresultsinconjunctionwiththe USgovernment’sfundingof socioeconomicand
- 3. political datasetsdesignedtocomplementthese satellitecollections.Forexample,CORONA produceda transformative understandingof the militarycapacitiesof foreignnations,and,wheneventually declassifiedin1995, proveda vital resource forunderstandinghistorical landuse change and archaeology.LANDSAThasbeencrucial tonational andinternational assessmentsof currentlanduse change,desertification,andfoodsecurity. Mission toPlanetEarth (MTPE) has beenvital to understandingthe pace anddegree of anthropogenicclimate change andinformingthe international community’sresponse. Inresponse tocallstodemonstrate the social payoffof MTPE,NASA createda SocioeconomicDataandApplicationsCenter(SEDAC) thathasmade a numberof important contributions,suchasthe creationof global griddedpopulationdatasets. Robustinternational and national scientificandpolicyecosystemsincludinggovernment,science,business,andnonprofit organizationshave sprunguparoundCorona,LANDSAT,MTPE, and manyotherglobal observing missions. Muchof the value fromthese federalinvestmentshasbeengeneratedbyintegratingglobal physical andtechnical observationswithglobal administrativeandgriddeddatasets,global eventsdata, and global models. Some representative global socioeconomicdatasetsthatmay shedlightonprecursorsto andeffectsof cybercrime are providedinTable 1and discussedinthe followingtwoparagraphs. Because of the availabilityof global datasets,amore detailed,statisticallybasedpicture of the cybercriminal can emerge. Areaswithpoorgovernance are abreedinggroundfortransnational criminalactivity,asare areas thatare physicallyremote,whichcanbe visualizedathigherresolutionusingglobal mapsof accessibility. (Keefe,2013; Uchiga & Nelson,2009) Figure 2. From left to right: inset from remoteness map of the world using travel time cost (Uchiga & Nelson, 2009); output from the GCAM global gridded climate assessment model showing projected land use change at 1 km grid size (West, Le Page, Huang, Wolf, & Thomson, 2014); global model predicting areas at high cholera risk (Struck, 2011) The World Bankand nonprofitorganizationsprovidenational-scale dataongovernance efficacy, transparency,andcorruption. While cybercrime doesnotrequire highlevelsof skill,educationisa significantcomponentof national cybercapability.UNESCOhasthe mostcomprehensive global data regardingeducationandliteracy.Basicdemographicandeconomicconditionssuchasthe prevalence of 15-24 year-oldunder-employedmalescreate apool of potential offenders. (Ojedokun&Eraye,2012) Social trustbehaviorsexhibitsignificantgeospatial variationinbothintensityandnature—compare trust inpublicsystems(“social capital”) v.trustintribal,familyororganizedcrime networks (Collins& Mansell,2004; Johnson& Mislin,2012; WorldValuesSurveyAssociation,2008) Data available from online social networkscan be usedto model the identityattributesassociatedwithcurrentand
- 4. prospective cybercriminality (Fedushko&Bardyn,2013) While social networkdatahave the individual as the fundamental unitof analysis,such datacan be aggregatedspatiallyandtemporallytothe same resolutionassocioeconomicdatathatare basedonadministrative boundariesandgathered periodically. Global socioeconomicdatamay alsohelpunderstandvulnerabilitytoandimpactsof cybercrime.NASA and the Departmentof Energy,respectively,fundedthe twomajorgriddedglobal populationdatasets, the GriddedPopulationof the World(GPW) andLandScan,throughthe EOSSocieoconomicDataand ApplicationsCenter(SEDAC) andOakRidge National Laboratory(ORNL). These datasetsare the most significanttoolsavailable forprovidinggeospatially-explicitpopulationaffectedinformationonaglobal basis. Theyhave beneficial differencesforhazardassessmentinthatGPWdistributesambient populationtoresidencesinproportiontoadministrative boundariesatnighttime,whereasLandScan distributespopulationalongroadwaysatnoon. Griddedpopulationdatacomplementsinfrastructure data by enablingcalculationof affectedpopulationwithinafootprintof the targetedinfrastructure. Addedprecisionisfeasible whenusing tract- orcounty-level dataforpopulation,socialcharacteristics, and economicactivity;suchdataare available frommanydeveloped-nationcensusbureaus. Many ingeniousmethods(withvaryinglevelsof reliability) have beenappliedtothe DMSPNightLights data setas proxiesforaspectsof global economicandsocial activity (NOAA,2015). Existingdatasets assessingvulnerabilitytomultiple natural hazards (Dilleyetal.,2005) may be importantfor understandingthe potentiallydevastatingimpactof acyberattackthat accompaniesorfollowsanatural disaster.Conversely,cybersecuritydatathatsupportsgeospatial inferencescanalsobe valuable;for example,OWASP’sTop10 Risksmapsrisksto industries,andindustriescanbe locatedgeospatiallyusing data such as the U.S. CensusBureau’sOccupational EmploymentStatistics(OES),makingitpossibleto generate ageospatial footprintforotherwiseabstractcyberriskssuchas SQL injection. (Bureauof Labor Statistics,2013; OpenWebApplicationSecurityProject,2013) It isimportantto emphasize thatbothadministrativeboundaryandgridded globaldatasetsare often created in response tomissionneeds. It can be (andusuallyis) labor-intensive tocreate administrative data sets. The UnitedStatesgovernmentrecognizes195 independentstates (Office of the Geographer and Global Issues,Bureauof Intelligence andResearch,&U.S.Departmentof State,2015) whichmeans that creatinga complete newnational-scale datasetrequiresrepeatinganovel process atleast195 times,oftendealingwithinconsistentorunavailabledata. Forexample,creatingaglobal GISof populationdataforone particularethnicityinvolvinghandinspectingprintedcensusdataforall the countriesinthe world,a laborioustaskthatwasrequiredbecause mostcensusbureausonlymake a subsetof theirinformationavailable online andresearch-intensive because nosinglelibraryinthe world has a complete collectionof all publishedcensuses (ISciencesLLC,MDA Federal,&General Dynamics, 2006). Careful attentiontoadministrativeboundarydataisimportant. Inthe contextof cybercrime every networkdependsonphysical connectionsandeveryattackerhasa physical location,andafundamental attribute of the worldorderis thateveryphysical location“belongs”to a nestedseriesof administrative unitswiththe nation-state atthe top;2) political mapping techniquesare designedtobe effective at
- 5. summarizinglarge volumesof information;3) aggregate analysismayenable focusonthe evolving structure of the problemratherthanthe arbitrary details; 4) all thingsbeingequal,administrative control overa territory doesmake iteasiertoidentifyandneutralizeattackers.(Inaddition,it’sworth notingthat inthe internetworld,Administrative Domainsare fixedinterconnectionsbetweendomains that are jointlymanaged,whichhave ageographicmappingcapability.) Creatingnewglobal griddeddatasetsisalsochallengingandlabor-intensive. Simplifyingconsiderably, the effortusuallyrequiresdevelopingsome sortof algorithmtoallocate knownorestimatedentitiesto gridcells;suchalgorithmsmustbe designed,iteratedandvalidated.Differentorganizationshave differentlevelsof CapabilityMaturityModel Integration (Paulk,1993) interms of creatinggriddedglobal data sets. For example,NASA hasarelativelymature processthatinvolvescreatinganAlgorithm Theoretical BasisDocument(ATBD) foreveryderivedproductfromsensorssuchasMODIS. Individual science researchprojectsare likelytooperate ata lowerCMMI. Finally,global administrative andgriddeddatasets oftenneedtobe integrated sothatpolicymakers can make operationallyusefuldecisions. Thisrequiresassigninggridcellstoadministrativeunits,and generallyinvolvesalgorithmdevelopment. Table 1. Representative global data sets and models Name Source Comments Gridded Population of the World CIESIN Distributes ambientpopulation to residences (night time) LandScan Oak Ridge National Laboratory Distributes ambientpopulation alongroads (day time) CARMA power plants CARMA All power plants in world by lat/long Global Education and Literacy databases UNESCO Most complete national coverage Governance World Bank Synthetic indicator created from several variables Night Lights DMSP Used as proxy for many economic and social activities Multi-hazard mortality and economic vulnerability CIESIN, World Bank, IBRD Integrated vulnerability to natural disasters Global ChangeAssessment Model University of Maryland Integrated assessmentof future climatechange includingboth climateand economic modeling HealthMap Boston Children’s Hospital Epidemic detection and monitoring Global ethnicity data set ISciences/MDA GIS at lowest availableadministrativeunitper country
- 6. Federal ICEWS DARPA Event detection esp. conflict Griddedglobal datasetsare a prerequisite tomanytypesof global modelingandintegratedassessment that work,inessence,bysimulatingflowsthroughgridcellsandevaluatingthe instantandultimate state of those cellsasmeasuredinvariousdimensions.The minimumcommonresolutionof the data setsinvolvedgenerallysetsalowerboundonthe precisionwithwhichglobal modelscanbe applied to particularlocations. Forexample, global socioeconomicandpolitical data at administrative unitorgrid cell scale maybe lowerresolutionthan physical IPlocationdataatGPS plusrange of error. However, modelingisaboutfindinguseful levelsof abstraction fromaggregatedglobal data.Forexample, scientistshave beenabletopredictcholeraattacksaboutsix weeksaheadof time byusingsatellite sensorstomeasure justthree parameters:chlorophyll,seasurface temperature,andseaheight. (Colwell,1996; Struck,2011) it maybe interestingtoinvestigate “flowsandstates”of cybercrime at higherlevelsof aggregationthanusual. Are particulargriddedcellshighlytargetedregardlessof particularincidentlocations? Doesattackdensity“circulate”amongasetof adjacentor network connectedcells?Onlyexplorationcananswersuchquestions. Global eventsclassificationservicesrunningagainstnewsandsocial mediadataare anotherimportant tool that provide synopticawarenessof emergingglobal trends. Examplesinclude serviceslike HealthMap(Freifeld,Mandl,Reis,&Brownstein,2008) and the DARPA IntegratedCrisisEarlyWarning SystemICEWS (Kettler&Hoffman,2012). The companyRecordedFuture hasusedvisualizationand analysisof eventdatato achieve earlydetectionandunderstandthe historical spreadof malware and othercyberthreats (Truvé,2011). Global eventanalysis technologieshave beenintegratedwithglobal data setsand modelstoilluminate issuessuchasthe effectsof climate change onconflict (Hsiang, Meng,& Cane,2011)and the spreadand impactof infectiousdiseases (Nsoesie,2014). There may be value inusingeventanalysistechnologiestounderstandandmonitorthe precursorsandenablersof cybercrime. Finally,itisworthemphasizingthe value of informationvisualizationincommunicatingwithdecision- makers. Cartographyisa specializedformof informationvisualizationthatisan art untoitself,andthe difference betweenmediocre andexcellentcartographycanbe enormous. (Tufte &Graves-Morris, 1983). The expectationthatmapswill be interactive isbecomingstrongerandcustomerexpectationsof qualityhave risenatthe same time as new formsof visualizationhave proliferated. (The Economist, 2013) Investmentintop-of-the-line cartographyandinformationvisualization islikelytobe cost- effective,especiallywhenappliedtosupportnovel approachestowickedproblems,where the barriers to understandingare higher.
- 7. Figure 3. Charles Minard’s famous map of Napoleon’s invasion of Russia shows the numbers of troops dwindling on the way to Moscow and back. The best cartography is both beautiful and enlightening. Relevance ofCybercartography to National Priorities The 2011 Departmentof DefenseStrategyforOperatinginCyberspace identifiedfive strategicpriorities: 1) treat cyberspace asan operational domaintoorganize,train,andequipsothatDoD can take full advantage of cyberspace’spotential 2) EmploynewdefenseoperatingconceptstoprotectDoD networksandsystems 3) PartnerwithotherU.S. governmentdepartmentsandagenciesandthe private sectortoenable a whole-of-governmentcybersecuritystrategy 4) BuildrobustrelationshipswithU.S.alliesandinternationalpartnerstostrengthencollective cybersecurity 5) Leverage the nation’singenuitythroughanexceptional cyberworkforce andrapidtechnological innovation.” Cybercartographyisan opportunitytoimprove federal capabilityinall these areas. 1) Maps and cartography are fundamental tomilitarytrainingandoperations. 2) Newstrategicoperatingconceptscome new waysof visualizingandmappingthe world. (Barnett,2005; Kennan,1947; Mackinder,1904). 3) The 2014-2016 National Spatial DataInfrastructure Planreiteratesthat“protectingthe privacy and securityof citizens’personal data”isa guidingprinciple forall federalagencies. (Federal GeographicData Committee,2014) Furthermore,whole-of-governmentassessmentsinthe U.S. and elsewhere have repeatedlyfoundthatacoordinatednational geospatial strategyoffers benefitssuchasstimulatingeconomicgrowth,savingtaxpayerdollarsandimprovingresults, and ensuringpublicsafetyandbetterdecisionsupport. (NationalGeospatial Advisory Committee,2012; Natural ResourcesCanada,2014; Ng SiauYong, 2011)
- 8. 4) Cartographyisusuallyquite valuableinunderstandinginternational problems—thereisno betterwayto presentasynopticview of a worldthatis dividedinto192 countries!—and decision-makersneedanddeserve sophisticatedcartography. 5) Explorationof cybercartographyleveragesbothgovernmentandcivil humancapital and encouragesitsdevelopment. a. Afterfiftyyearsof pioneeringGISinvestmentsbygovernmentmostfederalagencies have strongin-house geospatial workforce;developmentforsome portionforsome portionof thisstaff couldinclude cybertrainingandbe directedtoaddressthe executivebranchemphasisoncyberprediction,awareness,response andmitigation. b. By the same token,the National Geospatial AdvisoryCommitteeobservedthat“ina highlycompetitive global economy,the UnitedStatescurrentlyoccupiesthe leading positioninthe geospatial sector.U.S.-basedgeospatial companies,whichgenerate technical,high-payingjobsinthe UnitedStates,helpdrive the Americaneconomyby providinggoodsandservicesthatare soldworldwide.A recentstudybythe Centerfor Strategicand International Studiesestimatedthatgeospatial-relatedcompanies generate $30 billionannually.The geospatial sectorhasgrownsteadily,withthe commercial side growingatanacceleratedrate.” (National Geospatial Advisory Committee,2012) Otherofficial assessmentshave identifiedsimilarpriorities. Ina 2013 studyfor the legislative branch, the General AccountingOffice foundfive keychallenge areas. (GovernmentAccountingOffice,2013) 1) designingandimplementingrisk-basedfederal andcritical infrastructureprograms 2) Detecting,respondingto,andmitigatingcyberattacks. 3) ImprovedR&D. 4) International cybersecurity challenges. 5) Shortfallsinpromotingeducation,awareness,andworkforce planning. Thus the developmentof novel cybercartographycapabilitiesisresponsivetochallengesidentifiedby boththe political branchesof governments andwill benefitbothnational securityandthe civil sectoras theyface the potential fora newtype of disaster.Ina 2006 bookentitled SuccessfulResponseStarts with a Map:A Blueprint forImproving GeospatialData,Tools,and Infrastructure the National Research Council observed:“Inthe past fewyearsthe UnitedStateshasexperiencedaseriesof disasters,suchas Hurricane Katrinain 2005, whichhave severelytaxedandinmanycasesoverwhelmedresponding agencies.Inall aspectsof emergencymanagement,geospatial dataand toolshave the potential tohelp save lives,limitdamage,andreduce the costsof dealingwithemergencies.” (National ResearchCouncil, 2007) The same studyalso remarkedthat“the effectivenessof anytechnologyisasmuchaboutthe humansystemsinwhichitis embeddedasaboutthe technologyitself.” A human-driven,proactive and dynamicprocessforcybercartographyinriskassessmentandresponse isfullyconsistentwithexpressed national prioritiesforcybersecurity,geospatialdata,andriskassessment.
- 9. Conclusion The precedingdiscussionisnotional. Developinguseful globaldatasetsrequiresdomainexpertise; understandingof the state of the science andbestpractices;dataacquisition,conditioning, harmonization,andintegration;errorchecking;informationdesign;andmore:avirtual “fusionlab”. The importantpointisthat these techniquescanandshouldbe appliedtounderstandingthe precursors,enablers,targets,andvulnerabilitiesassociatedwithcybercrime.
- 10. Bibliography Barnett,T. P. M. (2005). The Pentagon’snew map:Warand peacein the twenty-firstcentury.Penguin. Buchanan,R. (1992). Wickedproblemsindesignthinking. Design Issues,5–21. Bureauof Labor Statistics.(2013).Occupational Employment Statistics.RetrievedJanuary24,2015, from http://www.bls.gov/oes/tables.htm CenterforInternational EarthScience InformationNetwork,CIAT,C.I.de A.T., & ColumbiaUniversity. (2005). GriddedPopulationof the World,Version3(GPWv3):Centroids.Palisades,NY:NASA SocioeconomicDataandApplicationsCenter(SEDAC).Retrievedfrom http://dx.doi.org/10.7927/H4TT4NWQ Chang,F. (2013). Studyingthe “WickedProblem”of CyberSecurity.RetrievedJanuary22,2015, from http://www.securitymagazine.com/articles/84903-article-headline Churchman,C. W. (1967). Guest editorial:Wickedproblems.JSTOR. Collins,B.S.,& Mansell,R.(2004). Cybertrustand crime prevention:asynthesisof the state-of-the-art science reviews.Retrievedfrom http://www.foresight.gov.uk/Previous_Projects/Cyber_Trust_and_Crime_Prevention/index.html Colwell,R.R.(1996). Global climate andinfectiousdisease:the choleraparadigm*. Science, 274(5295), 2025–2031. Dilley,M.,Chen,R.S.,Deichmann,U.,Lerner-Lam, A.L., Arnold,M., & Burby,R. (2005). NaturalDisaster Hotspots:A Global Risk AnalysisSynthesisReport.Earth Science (Vol.75,p. 132). The World Bank. doi:10.1080/01944360902967228 Donnelly,F.(2010).Gothos » BlogArchive » MappingHardto Count AreasforCensus2010. Gothos. RetrievedJanuary21,2015, fromhttp://gothos.info/2010/02/mapping-hard-to-count-areas-for- census-2010/ Federal GeographicDataCommittee.(2014).National Spatial DataInfrastructure StrategicPlan, (December2013). Retrievedfromhttps://www.fgdc.gov/nsdi-plan/nsdi-strategic-plan-2014-2016- FINAL.pdf Fedushko,S.,&Bardyn,N. (2013). Algorithmof the Web-PersonalityIdentificationWeb-Personality Psychological ProfileCreation, 2(4),56–62. Freifeld,C.C.,Mandl,K. D.,Reis,B. Y., & Brownstein,J.S.(2008). HealthMap:global infectiousdisease monitoringthroughautomatedclassificationandvisualizationof Internetmediareports. Journalof the American Medical InformaticsAssociation, 15(2),150–157.
- 11. GovernmentAccountingOffice.(2013).Cybersecurity:National Strategy,Roles,andResponsibilities NeedtoBe BetterDefinedandMore EffectivelyImplemented,(February).Retrievedfrom http://www.gao.gov/products/GAO-13-187 Hsiang,S. M., Meng,K. C.,& Cane,M. A. (2011). Civil conflictsare associatedwiththe global climate. Nature,476(7361), 438–441. Imus,D. (2012). The bestAmericanwall map:DavidImus’“The Essential Geographyof the UnitedStates of America.”Slate.RetrievedJanuary21,2015, from http://www.slate.com/articles/arts/culturebox/2012/01/the_best_american_wall_map_david_imus _the_essential_geography_of_the_united_states_of_america_.html IntelligenceAdvancedResearchProjectsAgency.(2015).Cyber-attackAutomatedUnconventional SensorEnvironment(CAUSE).RetrievedJanuary21,2015, from http://www.iarpa.gov/index.php/research-programs/cause ISciencesLLC,MDA Federal,&General Dynamics.(2006). DiasporaProject.Arlington,Virginia. Johnson,N.D.,& Mislin,A.(2012). Howmuch shouldwe trustthe World ValuesSurveytrustquestion? EconomicsLetters, 116(2), 210–212. Keefe,P.R.(2013). The Geographyof Badness :Mappingthe Hubs of the IllicitGlobal Economy, 3,97– 109. Kennan,G.F. (1947). The sourcesof Sovietconduct.ForeignAffairs. Kettler,B.,& Hoffman,M.(2012). LessonsLearnedinInstabilityModeling,Forecasting,andMitigation fromthe DARPA IntegratedCrisisEarlyWarningSystem(ICEWS) Program.In 2nd International Conferenceon Cross-CulturalDecision Making:Focus2012. Mackinder,H. J.(1904). The geographical pivotof history. TheGeographicalJournal,23(4),421–437. National Geospatial AdvisoryCommittee.(2012).Toward a national geospatialstrategy,(December). Retrievedfrom https://www.fgdc.gov/ngac/meetings/december-2012/NGACGeospatialStrategy Paper.pdf National ResearchCouncil.(2007).Successful ResponseStartswithaMap: ImprovingGeospatialSupport for DisasterManagementonPlanningforCatastrophe:aBlueprintfor ImprovingGeospatialData Tools.National AcademiesPress.Retrievedfromhttp://www.nap.edu/catalog/11793/successful- response-starts-with-a-map-improving-geospatial-support-for Natural ResourcesCanada.(2014). The Federal GeospatialPlatform|Natural ResourcesCanada. RetrievedJanuary21,2015, fromhttp://www.nrcan.gc.ca/earth-sciences/geomatics/canadas- spatial-data-infrastructure/geospatial-communities/federal
- 12. Ng SiauYong.(2011). GeoSpace forSingapore’sWhole of GovernmentDataSharing. ESRIProceedings. RetrievedJanuary21,2015, from http://proceedings.esri.com/library/userconf/proc11/papers/3323_50.pdf NOAA.(2015). NGDC/STP - Defense Meteorological SatelliteProgam, Boulder.RetrievedJanuary23, 2015, fromhttp://ngdc.noaa.gov/eog/pubs_new.html Norse.(2015). Norse - IPVikingLive.RetrievedJanuary21,2015, from http://www.iarpa.gov/index.php/research-programs/cause Nsoesie,E.(2014).Digital Disease Detection:AnIntroduction. HealthMap.RetrievedJanuary23, 2015, fromhttp://www.healthmap.org/site/diseasedaily/article/digital-disease-detection-introduction- 21114 Obama,P. B. (2015). State of the unionaddress. Office of the GeographerandGlobal Issues,Bureauof Intelligence andResearch,&U.S.Departmentof State.(2015). IndependentStatesinthe World.RetrievedJanuary26,2015, from http://www.state.gov/s/inr/rls/4250.htm Ojedokun,U.A.,& Eraye,M. C. (2012). Socioeconomiclifestylesof the yahoo-boys:A studyof perceptionsof universitystudentsinNigeria. InternationalJournalof CyberCriminology,6(2),1001– 1013. OpenWebApplicationSecurityProject.(2013).The TenMost Critical WebApplicationSecurityRisks 2013. The Ten Most Critical WebApplicationSecurityRisks. Paulk,M. (1993). Capabilitymaturitymodelforsoftware.WileyOnline Library. PermanentHouse SelectCommittee onIntelligence.(2014).HearingonCybersecurityThreats. CSPAN. RetrievedJanuary24,2015, fromhttp://www.c-span.org/video/?322853-1/hearing-cybersecurity- threats Struck,D. (2011). Satellite DataAidsinPredictingCholeraOutbreaks - ScientificAmerican. Scientific American.RetrievedJanuary26,2015, from http://www.scientificamerican.com/article/satellite- data-aids-in-predicting-cholera-outbreaks/ The Economist.(2013). Infographics:Windsof change. TheEconomist.RetrievedJanuary23,2015, from http://www.economist.com/news/books-and-arts/21580446-revolution-taking-place-how-visualise- information-winds-change Truvé,S. (2011). Big Data for the future:Unlockingthe predictivepowerof the Web. Recorded Future, Cambridge,MA,Tech.Rep. Tufte,E. R.,& Graves-Morris,P.R.(1983). The visual display of quantitativeinformation (Vol.2). GraphicspressCheshire,CT.
- 13. Uchiga, H.,& Nelson,A.(2009).Travel time to majorcities:A global mapof Accessibility. JointResearch Centre.RetrievedJanuary25,2015, fromhttp://bioval.jrc.ec.europa.eu/products/gam/index.htm West,T. O., Le Page,Y., Huang,M., Wolf,J.,& Thomson,A.M. (2014). Downscalingglobal landcover projectionsfromanintegrated assessmentmodel foruse inregional analyses:resultsand evaluationforthe USfrom 2005 to 2095. EnvironmentalResearch Letters, 9(6),64004. WorldValuesSurveyAssociation.(2008). World valuessurvey.AnnArbor.