The pharmaceutical CDMO industry: Number of deals per country
•
1 like•344 views

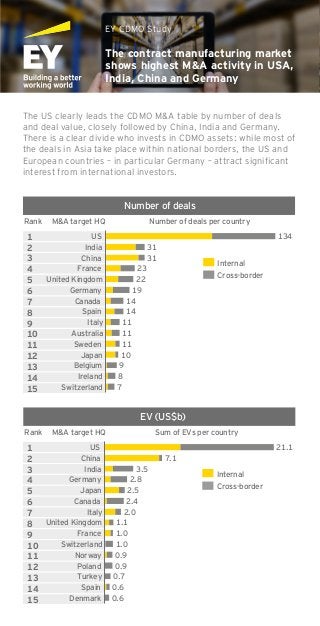
The contract manufacturing market reports highest M&A activities in USA, India, China and Germany. Find out more in our report: https://go.ey.com/2AIlfBr
Report
Share
Report
Share
Recommended
Recommended
More Related Content
More from EY
More from EY (20)
EY Price Point: global oil and gas market outlook (Q4, October 2020)
EY Price Point: global oil and gas market outlook (Q4, October 2020)
Liquidity for advanced manufacturing and automotive sectors in the face of Co...
Liquidity for advanced manufacturing and automotive sectors in the face of Co...
IBOR transition: Opportunities and challenges for the asset management industry
IBOR transition: Opportunities and challenges for the asset management industry
Fusionen und Übernahmen dürften nach der Krise zunehmen
Fusionen und Übernahmen dürften nach der Krise zunehmen
EY Price Point: global oil and gas market outlook, Q2, April 2020
EY Price Point: global oil and gas market outlook, Q2, April 2020
Trotz Rekordumsätzen ist die Stimmung im Agribusiness durchwachsen
Trotz Rekordumsätzen ist die Stimmung im Agribusiness durchwachsen
Deutschlands börsennotierte Unternehmen werden weiblicher
Deutschlands börsennotierte Unternehmen werden weiblicher
Paradigm shift in supply chain management for chemical operating models
Paradigm shift in supply chain management for chemical operating models
Bezpieczny Podatnik - Bezpieczne ulgi podatkowe 2019.pdf
Bezpieczny Podatnik - Bezpieczne ulgi podatkowe 2019.pdf
The pharmaceutical CDMO industry: Number of deals per country
- 1. The contract manufacturing market shows highest M&A activity in USA, India, China and Germany EY CDMO Study The US clearly leads the CDMO M&A table by number of deals and deal value, closely followed by China, India and Germany. There is a clear divide who invests in CDMO assets: while most of the deals in Asia take place within national borders, the US and European countries – in particular Germany – attract significant interest from international investors. 1 2 3 4 5 6 7 8 9 10 11 12 13 14 15 14 Germany 19 United Kingdom 22 France 23 China 31 India 31 US 134 Switzerland 7 Ireland 8 Belgium 9 Japan 10 Sweden 11 Australia 11 Italy 11 Spain 14 Canada Cross-border Internal Number of deals M&A target HQRank Number of deals per country EV (US$b) 1 2 3 4 5 6 7 8 9 10 11 12 13 14 15 Cross-border Internal Norway 0.9 Switzerland 1.0 France 1.0 United Kingdom 1.1 Italy 2.0 Canada 2.4 Japan 2.5 Germany 2.8 India 3.5 China 7.1 US 21.1 Poland 0.7 0.9 Denmark 0.6 Spain 0.6 Turkey M&A target HQRank Sum of EVs per country