Empfohlen

Empfohlen
Weitere ähnliche Inhalte
Was ist angesagt?
Was ist angesagt? (20)
Ähnlich wie Normalized Citation Indexes: a theoretical methodological study applied to sciencePoster number 12 gracio and oliveira
Ähnlich wie Normalized Citation Indexes: a theoretical methodological study applied to sciencePoster number 12 gracio and oliveira (20)
Kürzlich hochgeladen
Kürzlich hochgeladen (20)
Normalized Citation Indexes: a theoretical methodological study applied to sciencePoster number 12 gracio and oliveira
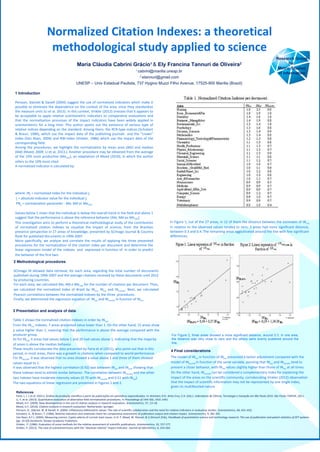
- 1. Normalized Citation Indexes: a theoretical methodological study applied to science Maria Cláudia Cabrini Grácio1 & Ely Francina Tannuri de Oliveira2 1 cabrini@marilia.unesp.br 2 etannuri@gmail.com UNESP – Univ Estadual Paulista, 737 Hygino Muzzi Filho Avenue, 17525-900 Marília (Brazil) 1 Introduction Persson, Glanzel & Danell (2004) suggest the use of normalized indicators which make it possible to eliminate the dependence on the context of the area, since they standardize the measure units (Li et al. 2013). In this context, Vinkler (2012) stresses that it appears to be acceptable to apply relative scientometric indicators to comparative evaluations and that the normalisation processes of the impact indicators have been widely applied in scientometrics for a long time. This author points out the existence of various type of relative indices depending on the standard. Among them, the RCR-type indices (Schubert & Braun, 1986), which use the impact data of the publishing journals and the "crown" index (Van Raan, 2004) and RW-index (Vinkler, 1986) which use the impact data of the corresponding field. Among the procedures, we highlight the normalization by mean area (Ma) and median (Md) (Moed, 2009; Li et al, 2013.). Another procedure may be obtained from the average of the 10% most productive (Ma10%), an adaptation of Moed (2010), in which the author refers to the 10% most cited. A normalized indicator is calculated by: where: INj = normalized index for the individual j; Ij = absolute indicator value for the individual j; PNg = normalization parameter - Ma, Md or Ma10%. Values below 1 mean that the individual is below the overall trend in the field and above 1 suggest that the performance is above the reference behavior (Ma, Md ou Ma10%). This investigation aims to perform a theoretical methodological study of the contribution of normalized citation indexes to visualize the impact of science, from the Brazilian presence perspective in 27 areas of knowledge, presented by SCImago Journal & Country Rank for published documents in 1996-2007. More specifically, we analyze and correlate the results of applying the three presented procedures for the normalization of the citation index per document and determine the linear regression model of the indexes and expressed in function of in order to predict the behavior of the first two. 2 Methodological procedures SCImago JR allowed data retrieval, for each area, regarding the total number of documents published during 1996-2007 and the average citations received by these documents until 2012 by producing countries. For each area, we calculated Ma, Md e Ma10% for the number of citations per document. Then, we calculated the normalized index of Brazil by INma, INmd and INma10%. Next, we calculated Pearson correlations between the normalized indexes by the three procedures. Finally, we determined the regression equation of INmd and INma10% in function of INma. 3 Presentation and analysis of data Table 1 shows the normalized citation indexes in order by INma. From the INma indexes, 7 areas presented value lower than 1. On the other hand, 15 areas show a value higher than 1, meaning that the performance is above the average compared with the producer group. As for INmd, 4 areas had values b elow 1 and 20 had values above 1, indicating that the majority of areas is above the median behavior. These results corroborate the data presented by Faria et al (2011), who point out that in this period, in most areas, there was a growth in citations when compared to world performance. For INma10%, it was observed that no area showed a value above 1 and three of them showed values e qual to 1. It was observed that the highest correlation (0.92) was between INma and INmd, showing that these indexes tend to exhibit similar behavior. The correlation between INma10% and the other two indexes have moderate intensity values (0.70 with INma10% and 0.51 with INmd). The two equations of linear regression are presented in Figures 1 and 2. Research Group for Metric Studies of Information In Figure 1, out of the 27 areas, in 12 of them the distance between the estimates of INmd in relation to the observed values tended to zero; 3 areas had more significant distance, between 0.3 and 0.4. The remaining areas agglutinated around the line with few significant differences. For Figure 2, three areas showed a more significant distance, around 0.3. In one area, the distance was very close to zero and the others were evenly scattered around the line. 4 Final considerations The model of INmd in function of INma presented a better adjustment compared with the model of INma10% in function of the same variable, pointing that INmd and INma10% tend to present a closer behavior, with INmd values slightly higher than those of INma at all times. On the other hand, INma10% can be considered a complementary index for explaining the impact of the areas on the scientific community, corroborating Vinkler (2012) observation that the impact of scientific information may not be represented by one single index, given its multifaceted nature. References Faria, L. I. L et al. (2011). Análise da produção científica a partir de publicações em periódicos especializados. In: Brentani, R.R.; Brito Cruz, C.H. (Eds.). Indicadores de Ciência, Tecnologia e Inovação em São Paulo 2010. São Paulo: FAPESP, 2011. Li, Y. et al. (2013). Quantitative evaluation of alternative field normalization procedures. In Proceedings of 14th ISSI, 1431-1441. Moed, H.F. (2009). New developments in the use of citation analysis in research evaluation. Scientometrics, 57, 13–18. Moed, H.F. (2010). Citation analysis in research evaluation. Netherlands: Springer. Persson, O., Glänzel, W. & Danell, R. (2004). Inflationary bibliometric values: The role of scientific collaboration and the need for relative indicators in evaluative studies. Scientometrics, 60, 421–432. Schubert, A., & Braun, T. (1986). Relative indicators and relational charts for comparative assessment of publication output and citation impact. Scientometrics, 9, 281-291. Van Raan, A.F.J. (2004). Measuring science. Capita selecta of current main issues. In H. F. Moed, W. Glanzel, & U.Shmoch (Eds), Handbook of quantitative science and techinology research. The use of publication and patent statistics of SET systems (pp. 19-50) Dordrecht: Kluwer Academic Publishers. Vinkler, P. (1986). Evaluation of some methods for the relative assessment of scientific publications. Scientometrics, 10, 157-177. Vinkler, P. (2012). The case of scientometricians with the “absolute relative” impact indicator. Journal of Informetrics, 6, 254-264.