Accident Analysis and Modeling on NH-55(India)
•
2 gefällt mir•1,366 views

International Journal of Engineering Inventions (IJEI) provides a multidisciplinary passage for researchers, managers, professionals, practitioners and students around the globe to publish high quality, peer-reviewed articles on all theoretical and empirical aspects of Engineering and Science. The peer-reviewed International Journal of Engineering Inventions (IJEI) is started with a mission to encourage contribution to research in Science and Technology. Encourage and motivate researchers in challenging areas of Sciences and Technology.

Empfohlen
Empfohlen
Weitere ähnliche Inhalte
Was ist angesagt?
Was ist angesagt? (20)
Andere mochten auch
Andere mochten auch (15)
Ähnlich wie Accident Analysis and Modeling on NH-55(India)
Ähnlich wie Accident Analysis and Modeling on NH-55(India) (20)
Mehr von International Journal of Engineering Inventions www.ijeijournal.com
Kürzlich hochgeladen
Kürzlich hochgeladen (20)
Accident Analysis and Modeling on NH-55(India)
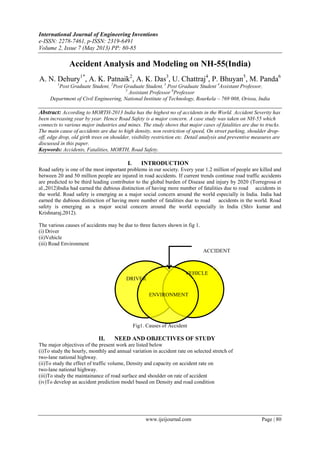
- 1. International Journal of Engineering Inventions e-ISSN: 2278-7461, p-ISSN: 2319-6491 Volume 2, Issue 7 (May 2013) PP: 80-85 www.ijeijournal.com Page | 80 Accident Analysis and Modeling on NH-55(India) A. N. Dehury1* , A. K. Patnaik2 , A. K. Das3 , U. Chattraj4 , P. Bhuyan5 , M. Panda6 1 Post Graduate Student, 2 Post Graduate Student, 3 Post Graduate Student 4 Assistant Professor, 5 Assistant Professor 6 Professor Department of Civil Engineering, National Institute of Technology, Rourkela – 769 008, Orissa, India Abstract: According to MORTH-2013 India has the highest no of accidents in the World. Accident Severity has been increasing year by year. Hence Road Safety is a major concern. A case study was taken on NH-55 which connects to various major industries and mines. The study shows that major cases of fatalities are due to trucks. The main cause of accidents are due to high density, non restriction of speed, On street parking, shoulder drop- off, edge drop, old girth trees on shoulder, visibility restriction etc. Detail analysis and preventive measures are discussed in this paper. Keywords: Accidents, Fatalities, MORTH, Road Safety. I. INTRODUCTION Road safety is one of the most important problems in our society. Every year 1.2 million of people are killed and between 20 and 50 million people are injured in road accidents. If current trends continue road traffic accidents are predicted to be third leading contributor to the global burden of Disease and injury by 2020 (Torregrosa et al.,2012)India had earned the dubious distinction of having more number of fatalities due to road accidents in the world. Road safety is emerging as a major social concern around the world especially in India. India had earned the dubious distinction of having more number of fatalities due to road accidents in the world. Road safety is emerging as a major social concern around the world especially in India (Shiv kumar and Krishnaraj,2012). The various causes of accidents may be due to three factors shown in fig 1. (i) Driver (ii)Vehicle (iii) Road Environment Fig1. Causes of Accident II. NEED AND OBJECTIVES OF STUDY The major objectives of the present work are listed below (i)To study the hourly, monthly and annual variation in accident rate on selected stretch of two-lane national highway. (ii)To study the effect of traffic volume, Density and capacity on accident rate on two-lane national highway. (iii)To study the maintainance of road surface and shoulder on rate of accident (iv)To develop an accident prediction model based on Density and road condition VEHICLE DRIVER ENVIRONMENT ACCIDENT
- 2. Accident Analysis and Modeling on NH-55 (India) www.ijeijournal.com Page | 81 III. STUDY STRETCH AND DATA COLLECTION The study stretch was selected fromchainage Km157/0 to Km 159/0 on NH-55 which connects Angul to Bhushan plant in Orissa state.The accidents data were collected from three police station named Angul,Nalco,Banarpal with prior permission of supertindent police angul and traffic datas from executive engineer office Dhenkanal. The study stretch was divided into Five equal stretches of each 5Km length.The Study Stretch is shown in Fig2The accident datas are shown in shown in fig Fig.2 Study StretchSource:Google Map IV. ACCIDENT DATA The accident data collected during last 10 years were plotted with MS excel.Total no of accidents,fatalities,injuries are shown in Table 1 and figs 3-6 of various stretches. TABLE 1 Accident Data during 2002-2011 Year Total Accident Fatal Major injury Minor injury 2002 47 15 16 37 2004 62 16 25 45 2005 53 20 32 39 2003 58 11 35 50 2008 66 4 24 61 2006 105 21 34 40 2011 62 11 30 58 2010 95 18 34 84 2009 86 13 32 81 2007 67 18 41 84
- 3. Accident Analysis and Modeling on NH-55 (India) www.ijeijournal.com Page | 82 Fig.3 Annual Variation in Accidents of Stretch-1 Fig.4 Annual Variation in Accidents of Stretch-1 Fig.5Annual Variation in Accidents of Stretch-1 0 5 10 15 20 25 30 2000 2005 2010 2015 NO YEAR FATAL MAJOR MINOR TOTAL NO OF ACCIDENTS 0 2 4 6 8 10 2000 2005 2010 2015 NO YEAR FATAL MAJOR MINOR TOTAL NO OF ACCIDENTS 0 10 20 30 40 50 2000 2005 2010 2015 NO YEAR FATAL MAJOR MINOR TOTAL NO OF ACCIDENTS
- 4. Accident Analysis and Modeling on NH-55 (India) www.ijeijournal.com Page | 83 Fig.6 Annual Variation in Accidents of Stretch-4 V. MONTHLY VARIATION IN ACCIDENTS Fig. 7 shows the monthly variation in accidents.peak accident occurs in summer season i.e in the month of march,april and may.This is due to distraction related to environment.Problem in these months are glare,fatigue, inconvienient heat. Fig.7 Accident month wise(2002-2011) VI. HOURLY VARIATION IN ACCIDENTS Fig. 8 shows hourly variation in accidents.One can observe more accidents occurs in between 8PM to 9PM.In this hour line truck(Truck Series) start their long journey.Most of the driver do not use speedometer as they drive by approximation.Speed crosses limiting speed as a result accident occur.Also they drink and drive in the evening hour.In the late night they use marijjuana as a result reaction time increases and loss of contro occurs.Some drivers make the vehicle over load.In india load capacity is 10 tonne or 16.2 tonne for goods carriage but they carry more than that results uncontrol and leads to accidents. Fig.8 Accident time wise(2002-2011) 0 10 20 30 40 50 60 70 2002 2003 2004 2005 2006 2007 2008 2009 2010 2011 TOTAL NO OF ACCIDENTS MINOR MAJOR FATAL 0 10 20 30 40 50 60 70 80 jan feb mar apr may jun jul aug sep oct nov dec 0 10 20 30 40 50 60 70 6.01AM-7AM 8.01AM-9AM 10.01AM-11AM 12.01PM-1PM 2.01PM-3PM 4.01PM-5PM 6.01PM-7PM 8.01PM-9PM 10.01PM-11PM 12.01AM-1AM 2.01AM-3AM 4.01AM-5AM NO OF ACCIDENT
- 5. Accident Analysis and Modeling on NH-55 (India) www.ijeijournal.com Page | 84 VII. VEHICLES INVOLVED IN FATALITIES Vehicle user related to fatalities during 2002-2011 are shown in pie chart in percent. The results indicate that 60 percent of fatalities are due to truck drivers followed by 25 percent by unknown driver,7 percent by motor cycles,5 percent by car and jeep,3percent by bus respectively as shown in fig. 9.They consume alcohol and drugs in long driving. As a result reaction time increases and loss of control occurs during speed driving leads to fatalities Fig.9 Vehicle involved in fatalities during(2002-2011) VIII. TRAFFIC DATA Traffic Datas were collected from PWD office.Different values of ADT (Volume), K (Density) and U(speed) for four stretches are shown in Table.It follows a relationship Q = U x K .From the below observation it clearly indicates that capacity(Qmax) exceeds for a two lane highway as per IRC-106.Hence it is necessary to increase lanewidth that is the road should be converted into four lane.Datas of four stretches are shown in Table 2. TABLE 2 Traffic Data STRETCH-1 STRETCH-2 STRETCH-3 STRETCH-4 ADT = 63600 ADT = 32160 ADT = 32160 ADT = 48960 QMAX =0.8 pcu/s QMAX =0.74pcu/s QMAX =0.74 pcu/s QMAX =0.92pcu/s K MEAN= 0.11358pcu/m K MEAN=0.107pcu/m K MEAN= 0.085pcu/m K MEAN=0.128pcu/m U MEAN=6.16 m/s U MEAN =6.73 m/s U MEAN=6.32m/s U MEAN =6.32 m/s IX. ACCIDENT PREDICTION MODEL The accident per year was regressed with Densityand Road side features. The general form of equation is represented as No of accident = 48.599 x density+ No of Trees on Shoulder x 0.7 + No of curves x 4.998-8.914x shoulder condition. The above equation shows that accidents increases with increasing in density,no of trees on shoulder and no of curves.The accident decreases with increase in shoulder condition.Hence regular maintainance of road should be done , old girth trees should be removed and widening of lane should be done by making into four lane. X. CONCLUSION Stretch IV has the highest no of accidents which accounts for 34.1% of total accidents. Stretch I has the second highest no of accidents accounts for 32.5% of total accident No of accidents in stretch II accounts for 29.6% of total accidents. Stretch III has minimum no of accidents accounts for 3.7% of total accidents The accident rate can be decreased by road side clearance, proper maintenance of shoulders, lighting, and junction improvement. Speed limit should be brought down by providing humps near accident spots. Sight distance near curves should be obstruction free. others 25% truck 60% bus 3% jeep/car 5% bike 7%
- 6. Accident Analysis and Modeling on NH-55 (India) www.ijeijournal.com Page | 85 REFERENCES [1] Torregrosa et al.,(2012) New geometric design consistency model based on operating speedProfiles for road safety evaluation,Accident Analysis and Prevention Article in press AAP-2915 pp.1-10 [2] Sivakumar,.Krishnaraj(2012),RoadTraffic Accidents (RTAs) Due To Drunken Driving In India,Challenges In Prevention international journal of research in management and Technology,ISSN:2249 9563 VOL. 2, pp.401-406 [3] Accidental deaths in india(2011), National Crime Records Bureau,Ministry of Home Affairs, Government of India,New Delhi [4] Bhuyan(2003) Accident Analysis on Two-Lane Road,M-Tech Thesis Indian Institute of Technology Roorkee [5] Golob et al.,(2004) Freeway safety as a function of traffic flow,Accident Analysis and Prevention Vol.36 pp. 933–946.