SlideShare ist ein Scribd-Unternehmen logo
1 von 7
Downloaden Sie, um offline zu lesen
Policy Analysis
CO2 Embodied in International Trade
with Implications for Global Climate
Policy
G L E N P . P E T E R S * A N D
E D G A R G . H E R T W I C H
Industrial Ecology Programme, Norwegian University of
Science and Technology (NTNU),
NO-7491 Trondheim, Norway
Received August 14, 2007. Revised manuscript received
December 17, 2007. Accepted December 18, 2007.
The flow of pollution through international trade flows has
the ability to undermine environmental policies, particularly for
globalpollutants.InthisarticlewedeterminetheCO2 emissions
embodied in international trade among 87 countries for the year
2001. We find that globally there are over 5.3 Gt of CO2
embodied in trade and that Annex B countries are net importers
of CO2 emissions. Depending on country characteristics—such
as size variables and geographic location—there are
considerable variations in the embodied emissions. We argue
that emissions embodied in trade may have a significant
impact on participation in and effectiveness of global climate
policies such as the Kyoto Protocol. We discuss several policy
options to reduce the impact of trade in global climate
policy. If countries take binding commitments as a part of a
coalition, instead of as individual countries, then the impacts of
trade can be substantially reduced. Adjusting emission
inventories for trade gives a more consistent description of a
country’s environmental pressures and circumvents many trade
related issues. It also gives opportunities to exploit trade as
ameansofmitigatingemissions.Notleast,abetterunderstanding
of the role that trade plays in a country’s economic and
environmental development will help design more effective
and participatory climate policy post-Kyoto.
1. Introduction
International trade causes a geographic separation of con-
sumers and the pollution emitted in the production of
consumable items. This gives a mechanism for consumers
to shift environmental pollution associated with their
consumption to distant lands. For local pollutants this may
be viewed as a rational option for consumers, but for global
pollutants—such as greenhouse gases (GHG)—consumers
will bear the costs regardless of where production occurs.
Consequently one would expect the optimal policy for global
pollutants to consider the implications of international trade.
Interestingly, the only reference to international trade in the
Kyoto Protocol is that “Parties. . .shall strive to implement
policiesandmeasures. . .insuchawayastominimizeadverse
effects. . .on international trade”. Many of the debated
problems of the Kyoto Protocol are manifested in interna-
tional trade—costs, competitiveness, carbon leakage, and
so on—and perhaps ironically, restructuring international
trade may help mitigation and accelerate sustainable
development.
Historically, international trade has played a significant
role in economic development by giving a mechanism to
efficiently allocate resources, typically labor and capital (1).
However, without fully and uniformly costing externalities,
production may occur in regions with poor environmental
performance or weak environmental legislation. This sepa-
ration of consumption and production has instigated many
studies on the pollution embodied in international trade—
primarily air pollutants (2, 3), but also water (4), land (5),
materials (6), and even forest products (7). These studies
have highlighted the magnitude and policy importance of
pollution embodied in trade for individual countries or small
groups of countries. Despite this, there is a clear need for
more comprehensive global studies to provide input for
climate policy analysis.
Given the political rhetoric associated with trade and
competitiveness issues in climate policy (8–10), there has
been little research on how trade may impact climate policy.
If a country has a large share of its exports in pollution-
intensive production, then there may be large—real or
perceived (11)—economic cost associated with participating
in a global climate regime (12). If the climate regime has
inadequate participation, then there is a risk that production
will increasingly shift to nonparticipating countries. Either
industries may close down and move to nonparticipating
countries, or more problematic, expanded production may
occur in nonparticipating countries (13) as is clearly dem-
onstrated by the rapid growth of production in China (14, 15).
Further, with increasingly global production, most low-cost
mitigation options may be located outside the country of
consumption. As an example, since Norway has almost 100%
hydropower, it would make economic sense for Norway to
focus emission reductions on coal power electricity genera-
tion in its important trading partners (16). The Kyoto Protocol
attempts to address this through the Clean Development
Mechanism (CDM), but evidence suggests that the CDM has
not been effective at meeting its goals (17).
There have been many proposals for climate policy in the
post-Kyoto period (18, 19) with many considering issues such
as equity, flexibility, economic costs, and environmental
effectiveness. Very few proposals have assessed whether
international trade may be underlying some of the concerns
with the Kyoto Protocol. International trade has been
discussed as a way to enforce climate policy (20) and there
is increasing interest in using trade-based mechanisms such
as border-tax adjustments (21–23). National emission in-
ventories can also be adjusted for trade (24, 25) which has
the potential to avoid issues such as carbon leakage, but has
received little attention in climate policy debates (12). Given
the importance of trade in most aspects of modern econo-
mies, it is certainly beneficial to investigate the role trade
has in climate policy.
The main focus of this article is a quantitative comparison
of how the emissions embodied in international trade shape
a country’s environmental profile and discuss the implica-
tions for global climate policy. We perform detailed analyses
on the emissions embodied in exports and imports, the
carbonleakagebetweenAnnexBandnon-AnnexBcountries,
and compare different methods for constructing GHG
inventories. Finally, we discuss the implications of anthro-
pogenic carbon flows for global climate policy.
* Correspondingauthorphone:+4773598938;e-mail:glen.peters@
ntnu.no; http://www.indecol.ntnu.no/.
10.1021/es072023k CCC: $40.75  2008 American Chemical Society VOL. 42, NO. 5, 2008 / ENVIRONMENTAL SCIENCE & TECHNOLOGY 9 1401
Published on Web 01/30/2008
2. Background and Methodology
Often, the most polluting aspect of a consumable product
is the pollution emitted in production. The emissions occur
either directly through the production processes or indirectly
in the global supply chain due to acquisitions such as
electricity, transportation, manufacturing, and so on. The
accumulated emissions emitted in the production of the
product are said to be “embodied” emissions (other authors
have used “virtual” or “hidden”). For global climate policy
the “emissions embodied in trade” (EET) between countries
are of most interest.
We consider three aspects of EET relevant for global
climate policy. First, a direct analysis of EET provides a better
understanding of the environmental separation between
domestic consumption and global production. Second, an
analysis of carbon leakage reveals to what extent pollution
is shifted rather than abated. Third, trade-adjusted GHG
emission inventories eliminate carbon leakage and attempt
to exploit trade to mitigate emissions.
2.1. Emissions Embodied in Trade (EET). Calculating
the EET can become complex due to the need to enumerate
the unique production systems in individual countries to a
reasonable level of sectorial detail and then to link this to
consumption systems through international trade data. The
most common methodology for this type of analysis is a
generalization of environmental input-output analysis (IOA)
(26) to a multiregional setting.
Using IOA there are two main approaches to modeling
EET at a national level (27). The simplest approach is to
determine the domestic CO2 emissions in each country to
producethebilateraltradewithanothercountry.Thismethod
is the most transparent, but does not assess the imports
required to produce the bilateral trade. A more complex
approach uses a multiregional input-output (MRIO) model
to determine the global emissions for an exogenous final
consumption with global trade determined endogenously.
Both methods give the same global emissions, but the
national emissions differ in the method of allocating inter-
mediate consumption (27). In this article we employ the
simplified version that we find is more transparent and
appropriate for quantitative analysis of EET in global climate
policy.
To explicitly model the EET requires a decomposition of
the standard IOA framework into domestic and traded
components. The total CO2 emissions occurring in each
region are
fr ) Fr(I - Arr)-1
(yrr + ∑s
ers) (1)
where Fr is a row vector with each element representing the
CO2 emissions per unit industry output, Arr are the inter-
industry requirements of domestically produced products
demanded by domestic industries, yrr are the products
produced and consumed domestically, ers are the bilateral
exports from region r to region s, and I is the identity matrix.
Summing over all regions gives the total global emissions
since bilateral trade is considered. In the full MRIO model
the bilateral trade, ers, is decomposed into components for
intermediate and final consumption (27).
The linearity assumption of IOA allows eq 1 to be
decomposed into components for domestic demand on
domestic production
frr ) Fr(I - Arr)-1
yrr (2)
and the EET from region r to region s
frs ) Fr(I - Arr)-1
ers (3)
Summation gives the total emissions occurring in the country
fr ) frr +Σs frs. Direct household and government emissions—
such as personal car use—can be included in frr. The total
emissions embodied in exports (EEE) from region r to all
other regions are
fr
e
) ∑s
frs (4)
and the total emissions embodied in imports (EEI) are
obtained by reversing the summation
fr
m
) ∑s
fsr (5)
Another quantity that is often discussed in the literature is
the Balance of Emissions Embodied in Trade (BEET)
fr
BEET
) fr
e
- fr
m
(6)
which represents a trade balance for pollution.
2.2. Carbon Leakage. Carbon leakage is an issue that
has been discussed quite extensively in the economics
literature on climate change (28). In this article we deviate
from the notion of carbon leakage used in Computable
General Equilibrium (CGE) modeling. The CGE literature
takes a very “strong” definition of carbon leakage (13) defined
as the increase in non-Annex B emissions divided by the
reduction in Annex B emissions (28). Under this definition,
the analyst seeks to determine the production that shifts from
an Annex B to a non-Annex B country in response to a GHG
mitigation policy in an Annex B country. Theoretical studies
of strong carbon leakage find the leakage to range between
0 and 130%, but it is highly dependent on the modeling
assumptions (28). Empirically, there is little evidence that
production shifts due to environmental legislation (29, 30).
The weakness of the IPCC definition of carbon leakage is
that it ignores the fact that production may increase in non-
Annex B countries for reasons totally disconnected to climate
mitigationinAnnexBcountries—“weak”carbonleakage(13).
From 1990 to 2006 global GHG emissions have increased
35% despite stabilizing in Annex B countries (31) and it is
important to quantify what portion of this increase is directly
or indirectly due to consumption in Annex B countries. This
gives rise to an alternative notion of “weak carbon leakage”,
defined as the CO2 EEI from non-Annex B countries to Annex
B countries
fr
*
) ∑s∉AnnexB
f sr (7)
where the summation includes only non-Annex B countries.
This weaker definition of carbon leakage is typically
employed in the EET literature and considers the total
aggregatedCO2 flowsfromnon-AnnexBtoAnnexBcountries.
The distinct advantage of “weak carbon leakage” is that it
quantifies how much production in non-Annex B countries
is to meet consumption in Annex B countries; for instance,
how much of China’s emissions are exported. In terms of the
global climate system, it is irrelevant if a policy change in an
AnnexBcountrycausedproductiontoincreaseinnon-Annex
B countries (“strong carbon leakage”). It is more important
to quantify how much Annex B consumption is produced in
countries without binding mitigation policies in place (“weak
carbon leakage”).
2.3. Production and Consumption Inventories. There
are several ways to allocate responsibility for anthropogenic
emissions to countries (32). Of particular interest for climate
policy is the allocation of production-based and consump-
tion-based emissions (25, 12, 27). We define the production-
1402 9 ENVIRONMENTAL SCIENCE & TECHNOLOGY / VOL. 42, NO. 5, 2008
based emission inventory as the total domestic emissions
occurring from economic production within a country
fr
prod
) fr (8)
The production-based inventory is related to, but different
from the IPCC definition. In the IPCC definition, emission
inventories are allocated according to “national (including
administered) territories and offshore areas over which the
country has jurisdiction” (33), while our production-based
inventories are based on the economic activities ofresidential
institutions as defined in the System of National Accounts
(SNA) (34) and used in the NAMEA (35, 36). Generally the
underlying source data are the same, but the production-
basedinventoriesincludeinternationaleconomicactivities—
primarily, international transportation and tourism—as
defined in the Gross Domestic Product (GDP) (12). Further,
the NAMEA are allocated to economic sectors, while the IPCC
data are allocated to technologies.
We define the consumption-based emission inventory as
the total global emissions occurring from economic con-
sumption within a country
fr
cons
) fr
prod
- fr
e
+ fr
m
) fr - fr
BEET
(9)
and can thus be considered a trade-adjusted version of the
production-based inventory. The consumption-based in-
ventory takes the production-based inventory, but deducts
the EEE and adds the EEI. According to our definitions of
EEE and EEI, the consumption-based inventory is based on
total consumption—intermediate and final—using bilateral
trade data. If using the full MRIO model a slightly different
definition would be used which considers the global emis-
sions from final consumption in each region (27).
3. Data
The data requirements for a multiregional IOA are consider-
able, but most developed countries and many developing
countries collect the necessary data. However, converting
the country data to a consistent global data set is a
considerable task. The Global Trade Analysis Project (GTAP)
has constructed the necessary data for the purposes of CGE
modeling and this data set can be applied for multiregional
IOA. The GTAP provides data for 87 countries and 57 industry
sectors covering IOA, trade, protection, energy, and CO2
emissions (37). Version 6 represents the world economy in
2001. We only consider CO2 emissions which covers over
70% of global GHG emissions (38).
While the GTAP database has impressive coverage, care
needs to be taken with its consistency and accuracy.
Generally, original data are supplied by the members of the
GTAP in return for free subscription. The data are often from
reputable sources such as national statistical offices. Un-
fortunately, due to the voluntary nature of data submissions,
the data are not always the most recently available. Further,
once the original data has been received “[GTAP] make[s]
further significant adjustments to ensure that the I-O table
matches the external macroeconomic, trade, protection, and
energy data” (37). These adjustments (or calibrations) are
made for internal consistency in computable general equi-
librium modeling and are of unknown magnitude. The key
data challenges and adjustments we perform on the GTAP
data in preparation for our analysis are described in the
Supporting Information.
4. Results
4.1. Emissions Embodied in Trade. Table 1 shows the EEE
and EEI for key Annex B and developing countries. The
Supporting Information contains the full data set in both
absolute and percentage quantities. For each region we show
the production-based emissions, fprod
r, the consumption-
based emissions, fcons
r, the percentage EEE, fe
r/fprod
r, the
percentage EEI, fm
r/fprod
r, the percentage BEET, fBEET
r/fprod
r,
the percentage carbon leakage normalized with respect to
the total production-based emissions, f*r/fprod
r, and the
percentage carbon leakage with respect to the EEI, f*r/fm
r.
We have cross checked our numbers with another study (39)
and found that our values generally lie between their lower
and upper bounds (see Supporting Information). Figure 1
gives a graphic representation of the EEE and EEI for the 15
countries in the data set with the highest domestic emissions.
Table 1 shows that 5.3 Gt (21.5%) of global CO2 emissions
are embodied in international trade. This number increases
to 5.7 Gt (23.0%) if all international transportation is allocated
to EEE (see Supporting Information). The Annex B countries
export 2.8 Gt (18.9%) of their domestic CO2 emissions and
the non-Annex B countries export 2.6 Gt (25.3%). For
individual countries the EEE can vary considerably. Over
half of the countries have more than 25% CO2 EEE with many
countries around 50% EEE. The range of values is between
7.4% and 59.7%. This increases to 7.8% and 71.5% if all
international transportation is included (see Supporting
Information).
Due to symmetry, the global EEI is the same as the global
EEE. The Annex B countries import 3.6 Gt (24.5%) of their
domestic CO2 emissions, while the non-Annex B countries
import 1.7 Gt (17.2%). Consequently, Annex B countries are
net importers of CO2 emissions and non-Annex B countries
are net exporters. For individual countries the CO2 EEI ranges
from5.9%(RussianFederation)to219.3%(HongKong).Their
are 9 of 87 countries which have an EEI of more than 100%
(that is, the CO2 EEI are greater than their domestic
emissions). These are generally small, trade-exposed coun-
tries. When interpreting the EEI it is important to note that
we normalize the EEI (numerator) with the domestic emis-
sions (denominator). This implies that if a country has a
cleaner electricity mix then its trading partners, then it is
likely that it will have a higher value of EEI compared to a
country with a dirtier electricity mix.
Table 1 also shows the “Balance of Emissions Embodied
in Trade” (BEET). Annex B countries are net importers of
CO2 emissions, while non-Annex B countries are net export-
ers. Some authors have placed emphasis on the BEET in the
literature (25), but we feel that care is needed in its
interpretation. The tendency is to argue that it is better to
export more pollution than you import (positive BEET). From
a global climate change perspective we argue that it is more
desirable to have production occur where it is environmen-
tally preferable and then trade the products internationally.
Based on this, some countries may have a large positive or
negative BEET depending on their environmental compara-
tive advantage (12).
Given the possible importance of EET in shaping a
countries environmental profile we performed regressions
between EET and various country characteristics (see Sup-
portingInformation).Wefoundthatgenerallylargecountries—
GDP, population, area—have smaller EET. This could be
interpreted as large countries being more self-sufficient (11).
In terms of the Kyoto Protocol, this suggests that the policy
implications of trade will differ depending on the size of the
country. Small, trade exposed countries (e.g., Belgium, EEE
45.5%, EEI 89.4%) may face greater economic impacts if
climate policy affects trade, compared to a bigger country
(e.g., United States, EEE 8.3%, EEI 15.6%) that has a relatively
large and independent domestic economy. This suggests that
if countries act in coalitions to increase their effective size
then they may negate some of the negative consequences of
trade.
Currently the United States has not ratified the Kyoto
Protocol (Croatia ratified May 2007 and Australia ratified
VOL. 42, NO. 5, 2008 / ENVIRONMENTAL SCIENCE & TECHNOLOGY 9 1403
December 2007). Since the United States represents around
one-third of Annex B emissions (38) the Annex B EET varies
substantially. Table 2 shows that the ratified countries are
significantlymoretradeexposedthentheUnitedStates,Table
1. The United States (8) and, previously Australia (9), both
cited competitiveness concerns as their rationale for not
ratifying the Kyoto Protocol. Based on EET arguments, our
results suggest that the United States and Australia have
considerably less competitiveness concerns compared to
many other Annex B countries.
4.2. Carbon Leakage. If an international climate regime
has limited participation, such as in the Kyoto Protocol, the
problem of carbon leakage arises. Increased carbon leakage
can be caused by two factors. First, industries close down in
a participating country and migrate to a nonparticipating
country with lax environmental regulations (strong Pollution
Haven Hypothesis, PHH). Evidence for the strong PHH is
poor (29, 30). Second, increased consumption in a partici-
pating country is met by increased production in a non-
participating country (weak PHH) (13). Given dynamic
economic development the weak PHH would be sufficient
tocausesubstantialconcernsfortheeffectivenessofaclimate
regime with limited participation.
Table 1 shows the carbon leakage from Annex B countries
for CO2 in 2001, and Figure 2 gives a graphical representation
for key countries. We use two measures of carbon leakage.
The first gives the carbon leakage compared to total domestic
emissions which indicates the magnitude of the leakage. The
second measure (shown in brackets below), normalizes
carbon leakage relative to EEI which indicates the share of
EEI coming from non-Annex B countries and is a maximum
of 100%. We estimate the carbon leakage from the Kyoto
Protocol for CO2 as 10.8% (44.3%). The leakage varies
considerably among countries. It is as high as 29.4% (32.9%)
for Belgium and decreases to 2.7% (46.6%) for the Russian
Federation. The general trend is for countries with high EEI
to have high carbon leakage, although geographic location
is important. For instance, Japan and the United States are
located far away from other Annex B countries and so
normalized to their EEI they have high carbon leakage (68.5%
and 61.7%, respectively). On the other hand, countries within
the EU have high absolute carbon leakage, but since most
TABLE 1. Emissions Embodied in Trade for Selected Countries (Complete List in Supporting Information)a
embodied emissions carbon leakage
production
Mt CO2
consumption
Mt CO2 exports % imports % BEET % total % share %
United States 6006.9 6445.8 8.3 15.6 -7.3 9.6 61.7
Russian Federation 1502.8 1178.0 27.5 5.9 21.6 2.7 46.6
Japan 1291.0 1488.8 14.5 29.8 -15.3 20.4 68.5
Germany 892.2 1032.1 25.3 41.0 -15.7 13.7 33.4
United Kingdom 618.6 721.3 21.3 37.9 -16.6 14.5 38.2
Canada 547.7 532.2 31.7 28.8 2.8 7.7 26.7
France 509.9 591.9 22.7 38.8 -16.1 12.8 33.0
Italy 475.1 547.6 26.5 41.8 -15.3 16.4 39.2
Belarus/Ukraine 363.3 314.8 28.5 15.1 13.3 3.1 20.3
Australia 351.6 293.7 31.4 14.9 16.5 8.6 57.6
Poland 309.8 280.6 21.9 12.5 9.4 3.0 24.1
Spain 305.7 336.7 26.4 36.6 -10.1 14.5 39.8
Netherlands 204.5 243.4 39.1 58.1 -19.0 21.1 36.3
Belgium 126.4 181.9 45.5 89.4 -43.9 29.4 32.9
Czech Republic 117.4 99.8 40.2 25.3 14.9 4.5 17.7
Greece 101.4 107.3 29.6 35.5 -5.8 14.8 41.8
Finland 94.9 86.3 44.6 35.5 9.1 6.3 17.7
Denmark 74.8 85.0 34.1 47.8 -13.7 13.0 27.2
Portugal 70.0 79.7 25.5 39.4 -13.9 10.7 27.2
Sweden 59.7 83.4 34.1 73.7 -39.7 18.1 24.5
Rest of Annex B 593.1 708.7 34.0 53.5 -19.5 12.7 23.7
Annex B 14616.7 15438.9 18.9 24.5 -5.6 10.8 44.3
China 3289.2 2703.7 24.4 6.6 17.8 3.2 48.2
Rest of Middle East 1199.9 1042.2 28.2 15.1 13.1 8.7 57.8
India 1024.8 953.9 13.1 6.2 6.9 4.3 69.7
Korea 397.7 443.1 27.6 39.1 -11.4 23.1 59.2
Mexico 389.9 407.5 19.4 23.9 -4.5 5.9 24.8
Rest of Former Soviet 350.6 303.8 28.5 15.1 13.3 3.1 20.3
South Africa 323.7 200.2 44.6 6.4 38.2 3.4 52.1
Brazil 321.0 318.5 19.7 18.9 0.8 9.2 48.7
Indonesia 305.4 247.3 31.4 12.4 19.0 7.9 64.3
Taiwan 247.9 240.2 40.0 36.9 3.1 20.2 54.8
Turkey 196.3 188.0 27.5 23.3 4.2 8.6 36.9
Thailand 178.7 154.3 41.8 28.1 13.7 16.6 59.2
Venezuela 155.8 124.0 29.3 8.9 20.4 4.7 53.2
Argentina 120.4 118.4 18.4 16.7 1.7 9.8 58.5
Malaysia 116.8 93.3 59.7 39.5 20.1 23.5 59.6
Rest of non-Annex B 1520.9 1778.4 22.3 39.3 -16.9 26.0 66.3
Non-Annex B 10138.9 9316.7 25.3 17.2 8.1 9.7 56.3
Total 24755.6 24755.6 21.5 21.5 0.0 10.4 48.2
a
The first columns show the production-based and consumption-based emission inventories. The EEE, EEI, and BEET
are expressed as a percentage of the production-based emissions. The carbon leakage is expressed as a percentage of the
production-based emissions (first column) and EEI (second column). Production-based totals differ from UNFCCC values
since we allocate emissions according to economic activity and not territory (see text).
1404 9 ENVIRONMENTAL SCIENCE & TECHNOLOGY / VOL. 42, NO. 5, 2008
of the trade is with surrounding Annex B countries their
carbon leakage normalized to total EEI is low.
4.3. Production versus Consumption Inventories. The
current approach to construct GHG emission inventories is
to use national borders as a system boundary. Due to
international trade, this production-based approach does
not reflect what a country consumes. Some authors have
argued that GHG inventories should be based on consump-
tion, mainly to circumvent issues with carbon leakage
(24, 25, 12). A GHG inventory based on consumption is
compiled by taking the production-based GHG inventory,
adding the EEI and subtracting the EEE (eq 9). Since the
consumption-based approach considers the environmental
pressures arising from a product it can be considered as a
generalization of life-cycle assessment to the aggregated
consumption of a country and is similar conceptually to the
ecological footprint (27).
Table 1 shows the production-based and consumption-
based GHG inventories for 2001. We do not compare with
the UNFCCC territorial-based GHG inventories since, first,
we allocate emission by economic activity and not territory,
and second, the GTAP emissions data are less accurate
makingcomparisonsmisleading.Globallythetotalemissions
from consumption and production are the same. However,
theallocationamongcountriesvariesdependingontheBEET.
If we consider Annex B countries then the emissions coverage
is822MtCO2 greater(5.6%)basedonconsumptioncompared
toproduction.ThisreflectsthenegativeBEETbetweenAnnex
B and non-Annex B countries. For non-Annex B countries
the consumption-based CO2 emissions are 822 Mt (-8.1%)
lower compared to production. A distinct advantage of the
consumption-based inventories is that they eliminate carbon
leakage, as all emissions associated with consumption are
connected to the consuming country.
Of the 35 Annex B countries in our data set, only 9 have
lower emissions based on consumption rather than produc-
tion. These nine countries generally have large exports of
natural resources (e.g., Australia, Canada, Poland, Russian
Federation, and so on). The remaining countries have
increased reported emissions, indicating that in terms of
CO2 they consume more than they produce. Most EU
countries have a large increase in emissions with consump-
tion, particularly the smaller countries as they are highly
dependent on trade. For the EU27 as a whole there is a 564
Mt CO2 (12.8%) increase in emissions using a consumption-
based approach. The United States has a 439 Mt (7.3%)
increase and this is rapidly increasing over time (3). To put
these magnitudes into context, a country emitting 500 Mt
CO2 annually would be the tenth biggest emitter in the
database.
5. Discussion
Our results highlight that there are considerable embodied
flows of anthropogenic carbon in international trade. We
found a total of over 5.3 Gt of CO2 emissions embodied in
international trade flows, and Annex B countries were found
to be net imports of CO2 emissions. As a percentage of
production-basedemissionswefoundconsiderablevariation
in the EET and this relates back to various country charac-
teristics such as size variables and geographic location. We
found the carbon leakage from non-Annex B to Annex B
countries was heavily dependent on geographic location.
In terms of policy we claim that a high share of EEE affects
competitivenessandhenceparticipationinbindingemission
reductions since deep emissions cuts would ultimately affect
export industries. This effect is greater for small and trade-
exposed countries. While it is desirable for countries to clean
up production, it is not necessarily desirable for them to
stop producing and to shift production elsewhere. As long
as there is trade some countries will specialize in pollution-
intensive production. In this regard, the challenge for policy
is to ensure that countries that specialize in pollution-
intensive exports do so with clean technology, rather than
moving production elsewhere (assuming production can be
relocated) or not taking part in a global climate regime.
With limited participation to binding commitments, EEI
can significantly undermine the effectiveness of the Kyoto
Protocol through carbon leakage. This is arguably already an
FIGURE 1. Percentage EEE and EEI compared to total production-based emissions for selected countries.
TABLE 2. Emissions Embodied in Trade for the Ratified Annex
B Countries (As of December 2007 the US was the only
non-ratified Annex B country)
embodied emissions
production
Mt CO2
consumption
Mt CO2
exports
%
imports
%
BEET
%
Annex B 14616.7 15438.9 18.9 24.5 -5.6
ratified 8609.8 8993.1 26.2 30.7 -4.5
U.S. 6006.9 6445.8 8.3 15.6 -7.3
non-Annex B 10138.9 9316.7 25.3 17.2 8.1
total 24755.6 24755.6 21.5 21.5 0.0
VOL. 42, NO. 5, 2008 / ENVIRONMENTAL SCIENCE & TECHNOLOGY 9 1405
issue in the Kyoto Protocol where the ratified Annex B
countries only account for one-third of global GHG emissions
(38). Further, from 1990 to 2006 global CO2 emissions have
increased by 35% (31), even though Annex B countries are
still on target for a 5% reduction in 1990 GHG emissions by
2008–2012 (40). This highlights a major challenge in the Kyoto
framework. To achieve global coverage and avoid carbon
leakage high participation is needed, but this runs the risk
of reducing effectiveness to encourage participation (41).
We claim these issues are inseparable from international
trade.
Within the context of the Kyoto Policy one way to reduce
the impact of trade on individual countries may be to
encouragecoalitionformation(42).TheEETisgenerallylower
for a coalition compared to individual members of the
coalition and this may reduce competitiveness concerns and
encourage participation. As an example, within the European
Communities (EC)—EU15 in the Kyoto Protocol—a signifi-
cant share of the EET are between EC members and so the
EET of individual countries are larger and more variable
compared to the EC as a whole, Figure 3. The coalition limits
trade impacts to products and services that leave the EC. It
is also possible that groupings of countries with similar
environmental objectives could form coalitions with binding
commitments;seeSupportingInformationforexampleswith
the Asia-Pacific Partnership on Clean Development and
Climate (AP6), Association of South East Asian Nations
(ASEAN), and the South American Community of Nations
(CSN). A further advantage of regional approaches is that
many geo-political and economic organizations are already
well-established and many of these bodies have already
implemented environmental initiatives. Negotiations among
regions with established dialogue and policies may face fewer
political obstacles and may be a more effective method of
designing an optimal global framework (42).
Anotherapproachtoreducetheimpactoftradeonclimate
policy is to adjust emission inventories for trade. Currently,
emission inventories are production-based and this causes
aseparationbetweenacountry’sconsumptionandtheglobal
production system. Arguably, it is this separation that causes
the competitiveness concerns in the Kyoto Protocol. With
consumption-based emission inventories consistency is
returned between a country’s consumption (which occurs
domestically) and the production system required for the
consumption (which occurs globally). Consumption-based
inventories eliminate carbon leakage and encourage mitiga-
tion to occur where the costs are lowest (16, 12). In the very
least, trade-adjusted emission inventories may offer a more
systematic approach for allocating differentiated commit-
ments (43, 44) if the Kyoto Protocol structure is retained
post-2012.
Another interesting feature of consumption-based in-
ventories in the context of the Kyoto Protocol is the
connection with Border Tax Adjustments (BTA). BTA have
been suggested as a way of addressing competitiveness
concerns and encouraging participation (20–23). BTA are
related to consumption-based inventories in two ways. First,
since the consumption-based inventory includes a share of
emissions from trading partners it indirectly places a cost of
carbon in those trading partners. Second, the methodology
used to construct consumption-based inventories is also a
consistent method to determine the value of border taxes for
aggregated sectors.
Asnegotiationsforapost-Kyotoclimateprotocolintensify,
it is important to not only strive for participation from
developing countries, but also to improve the structure of
the Kyoto Protocol. Arguably, the Kyoto Protocol has many
good features which should remain, but small improvements
may greatly increase its effectiveness (44). One potential hole
in the Kyoto Protocol is that global emissions can seemingly
increase unabated despite emissions reductions in Annex B
countries (40). While the Kyoto Protocol may be hailed as a
success in international political negotiations, it is yet to be
seen whether it will be successful in meeting its environ-
mentalgoals.Inthisarticle,wehavearguedthatinternational
trade underlies many of the debated issues in the Kyoto
Protocol—economic costs, competitiveness, participation,
carbon leakage—and trade issues should play a much
stronger role in post-Kyoto negotiations.
Acknowledgments
This research was funded by the Research Council of Norway
through contract 139853 and by the rector of NTNU. We
thank the reviewers for helpful contributions.
Supporting Information Available
Supplementary Methods, Data, Comparisons, Results, and
Discussion; the complete list of all 87 countries analyzed
shown in both absolute and percentage terms; three ad-
ditional figures on coalition formation. This information is
availablefreeofchargeviatheInternetathttp://pubs.acs.org.
Literature Cited
(1) Feenstra, R. C. Advanced International Trade: Theory and
Evidence; Princeton University Press: Princeton, NJ, 2003.
FIGURE 2. EEI of selected countries showing the EEI from
Annex B countries and non-Annex B countries (carbon
leakage). Relative to total EEI, EU countries have a larger share
of EEI originating in Annex B countries since EU countries are
surrounded by other Annex B countries. The carbon leakage for
non-Annex B countries is defined the same as for Annex B
countries.
FIGURE 3. EEE and EEI of selected EC members showing the
EET originating inside the coalition (left bar) and outside the
coalition (right bar). Generally, the EET are reduced if countries
act in a coalition since only the EET originating outside the
coalition is considered.
1406 9 ENVIRONMENTAL SCIENCE & TECHNOLOGY / VOL. 42, NO. 5, 2008
(2) Wiedmann, T.; Lenzen, M.; Turner, K.; Barrett, J. Examining the
global environmental impact of regional consumption activities
- Part 2: Review of input-output models for the assessment of
environmental impacts embodied in trade. Ecol. Econ. 2007,
61, 15–26.
(3) Weber, C.; Matthews, H. S. Embodied Environmental Emissions
in U.S. International Trade, 1997–2004. Environ. Sci. Technol.
2007, 41 (14), 4875–4881.
(4) Hoekstra, A. Y.; Hung, P. Q. Globalisation of water resources:
International virtual water flows in relation to crop trade. Global
Environ. Change 2005, 15 (1), 45–56.
(5) Hubacek, K.; Giljum, S. Applying physical input-output analysis
to estimate land appropriation (ecological footprints) of in-
ternational trade activities. Ecol. Econ. 2003, 44 (1), 137–151.
(6) Müller, D. B.; Wang, T.; Duval, B.; Graedel, T. E. Exploring the
engine of anthropogenic iron cycles. Proc. Natl. Acad. Sci. 2006,
103 (44), 16111–16116.
(7) Mayer, A. L.; Kauppi, P. E.; Angelstam, P. K.; Zhang, Y.; Tikka,
P. M. Importing timber, exporting ecological impact. Science
2005, 308, 359–360.
(8) Bush, G. W. Letter from the President to Senators Hagel, Helms,
Craig,andRoberts;TheWhiteHouse:Washington,DC,13March
2001.
(9) Hansard No. 18. Wednesday, 6 December 2006, Commonwealth
of Australia, 2006.
(10) Grubb, M.; Neuhoff, K. Allocation and competitiveness in the
EU emissions trading scheme: policy overview. Climate Policy
2006, 6, 7–30.
(11) Krugman, P. Competitiveness: A dangerous obsession. Foreign
Affairs 1994, 73 (2), 28–44.
(12) Peters, G. P.; Hertwich, E. G. Post-Kyoto greenhouse gas
inventories: Production versus consumption. Climatic Change
2008, 86 (1–2), 51–66.
(13) Rothman, D. S. Environmental Kuznets Curves—real progress
or passing the buck? A case for consumption-based approaches.
Ecol. Econ. 1998, 25, 177–194.
(14) Streets, D. G.; Yu, C.; Bergin, M. H.; Wang, X.; Carmichael, G. R.
Modeling study of air pollution due to the manufacture of export
goods in China’s Pearl River Delta. Environ. Sci. Technol. 2006,
40 (7), 2099–2107.
(15) Peters,G.P.;Weber,C.L.;Guan,D.;Hubacek,K.China’sgrowing
CO2 emissions - a race between increasing consumption and
efficiency gains. Environ. Sci. Technol. 2007, 41 (17), 5939–5944.
(16) Peters, G. P.; Hertwich, E. G. Structural analysis of international
trade: Environmental impacts of Norway. Econ. Syst. Res. 2006,
18 (2), 155–181.
(17) Wara, M. Is the global carbon market working? Nature 2007,
445, 595–596.
(18) Aldy, J. E.; Barrett, S.; Stavins, R. N. Thirteen plus one: A
comparisonofglobalclimatepolicyarchitectures.ClimatePolicy
2003, 3, 373–397.
(19) Bodansky, D.; Chou, S.; Jorge-Tresolini, C. International Climate
Efforts Beyond 2012: A Survey of Approaches; Pew Center on
Global Climate Change: Arlington, VA, 2004.
(20) Aldy, J. E.; Orszag, P. R.; Stiglitz, J. E. Climate change: An agenda
for global collective action. Prepared for the conference on “The
Timing of Climate Change Policies”; Pew Center on Global
Climate Change: Arlington, VA, 2001.
(21) Ismer, R.; Neuhoff, K. Border tax adjustments: A feasible way to
address nonparticipation in emission trading; Working Papers
in Economics CWPE 0409; Department of Applied Economics,
University of Cambridge: Cambridge, UK, 2004.
(22) de Cendra, J. Can emissions trading schemes be coupled with
border tax adjustments? An analysis vis-á-vis WTO law. Rev.
Eur. Commun. Int. Environ. Law 2006, 15 (2), 131–145.
(23) Pauwelyn, J. U.S. federal climate policy and competitiveness
concerns: The limits and options of international trade law; NI
WP07-02;NicholasInstituteforEnvironmentalPolicySolutions,
Duke University: Durham, NC, 2007.
(24) Kondo, Y.; Moriguchi, Y.; Shimizu, H. CO2 emissions in Japan:
Influences of imports and exports. Appl. Energy 1998, 59 (2–3),
163–174.
(25) Munksgaard, J.; Pedersen, K. A. CO2 accounts for open
economies: Producer or consumer responsibility. EnergyPolicy
2001, 29, 327–334.
(26) Leontief, W. Environmental repercussions and the economic
structure: An input-output approach. Rev. Econ. Statistics 1970,
52 (3), 262–271.
(27) Peters, G. P. From Production-Based to Consumption-Based
National Emission Inventories . Ecol. Econ. (published online:
doi:10.1016/j.ecolecon.2007.10.014).
(28) IPCC.ClimateChange2007:Mitigation;ContributionofWorking
Group III to the Fourth Assessment Report of the Intergov-
ernmental Panel on Climate Change; Metz, B., Davidson, O. R.,
Bosch, P. R., Dave, R., Meyer, L. A., Eds.; Cambridge University
Press: Cambridge, UK/New York, 2007.
(29) Cole, M. A.; Elliott, R. J. R.; Shimamoto, K. Why the grass is not
always greener: the competing effects of environmental regula-
tions and factor intensities on US specialization. Ecol. Econ.
2005, 54, 95–109.
(30) Spatareanu, M. Searching for pollution havens: The impact of
environmental regulations on foreign direct investment. J.
Environ. Devel. 2007, 16 (2), 161–182.
(31) MNP. China now no. 1 in CO2 emissions; USA in second position;
ClimateChangeDosier,NetherlandsEnvironmentalAssessment
Agency, 2007.
(32) Eder, P.; Narodoslawsky, M. What environmental pressures are
a region’s industries responsible for? A method of analysis with
descriptive indices and input-output models. J. Environ. Devel.
1999, 29, 359–374.
(33) IPCC. Revised 1996 IPCC Guidelines for National Greenhouse
GasInventories(3volumes);IntergovernmentalPanelonClimate
Change, 1996.
(34) United Nations. System of National Accounts 1993; United
Nations, 1993.
(35) deHaan,M.;Keuning,S.J.Takingtheenvironmentintoaccount:
The NAMEA approach. Rev. Income Wealth 1996, 42 (2), 131–
148.
(36) GravgårdPedersen,O.;deHaan,M.Thesystemofenvironmental
and economic accounts-2003 and the economic relevance of
physical flow accounting. J. Ind. Ecol. 2006, 10 (1–2), 19–42.
(37) Dimaranan, B. V., Ed. Global Trade, Assistance, and Production:
The GTAP 6 Data Base; Center for Global Trade Analysis, Purdue
University: West Lafayette, IN, 2006.
(38) CAIT. Climate Analysis Indicators Tool (CAIT) Version 4; World
Resources Institute: Washington, DC, 2007.
(39) Ahmad, N.; Wyckoff, A. Carbon dioxide emissions embodied in
international trade of goods; DSTI/DOC(2003)15; Organisation
for Economic Co-operation and Development (OECD): Paris,
2003.
(40) UNFCCC. Key GHG Data: Greenhouse Gas (GHG) Emissions Data
for 1990–2003; United Nations, 2005.
(41) Barrett, S.; Stavins, R. Increasing participation and compliance
in international climate change agreements. Int. Environ.
Agreements: Politics, Law Econ. 2003, 3, 349–376.
(42) Victor, D. G.; House, J. C.; Joy, S. A Madisonian approach to
climate policy. Science 2005, 309, 1820–1821.
(43) Babiker, M. H.; Eckaus, R. S. Rethinking the Kyoto emissions
targets. Climatic Change 2002, 54, 399–414.
(44) Grubb, M. Kyoto and the future of international climate change
responses: From here to where. Int. Rev. Environ. Strategies
2004, 5 (1), 15–38.
ES072023K
VOL. 42, NO. 5, 2008 / ENVIRONMENTAL SCIENCE & TECHNOLOGY 9 1407

Weitere ähnliche Inhalte

Was ist angesagt?

Policy and projects reduction of carbon emissions in the manufacturing industry
 Policy and projects reduction of carbon emissions in the manufacturing industry Policy and projects reduction of carbon emissions in the manufacturing industry
Policy and projects reduction of carbon emissions in the manufacturing industryAlexander Decker
 
Natural Gas Consumption Overview In Brazil
Natural Gas Consumption Overview In BrazilNatural Gas Consumption Overview In Brazil
Natural Gas Consumption Overview In BrazilQUESTJOURNAL
 
T&C Trade Challenges
T&C Trade ChallengesT&C Trade Challenges
T&C Trade ChallengesFNian
 
Consumption basedgh gemissionsc40towns
Consumption basedgh gemissionsc40townsConsumption basedgh gemissionsc40towns
Consumption basedgh gemissionsc40townsPatrickTanz
 
EU: Chemical Wood Pulp (Sulphite, Other Than Dissolving Grades) - Market Repo...
EU: Chemical Wood Pulp (Sulphite, Other Than Dissolving Grades) - Market Repo...EU: Chemical Wood Pulp (Sulphite, Other Than Dissolving Grades) - Market Repo...
EU: Chemical Wood Pulp (Sulphite, Other Than Dissolving Grades) - Market Repo...IndexBox Marketing
 
Adhesives global market report 2018 sample
Adhesives global market report 2018 sampleAdhesives global market report 2018 sample
Adhesives global market report 2018 sampleSainathMuntha1
 
How much energy is necessary to make 1 ton of building materials?
How much energy is necessary to make 1 ton of building materials?How much energy is necessary to make 1 ton of building materials?
How much energy is necessary to make 1 ton of building materials?EnergyEfficiencyplat
 
EU: Semi-Chemical Wood Pulp, Pulp Of Fibers Other Than Wood - Market Report. ...
EU: Semi-Chemical Wood Pulp, Pulp Of Fibers Other Than Wood - Market Report. ...EU: Semi-Chemical Wood Pulp, Pulp Of Fibers Other Than Wood - Market Report. ...
EU: Semi-Chemical Wood Pulp, Pulp Of Fibers Other Than Wood - Market Report. ...IndexBox Marketing
 
ENV GLOBAL FORUM OCT 2016 - Session 2 - Bernd MEYER
ENV GLOBAL FORUM OCT 2016 - Session 2 - Bernd MEYERENV GLOBAL FORUM OCT 2016 - Session 2 - Bernd MEYER
ENV GLOBAL FORUM OCT 2016 - Session 2 - Bernd MEYEROECD Environment
 
Dynamics of nitrous oxide emissions from different sources in bulgaria
Dynamics of nitrous oxide emissions from different sources in bulgariaDynamics of nitrous oxide emissions from different sources in bulgaria
Dynamics of nitrous oxide emissions from different sources in bulgariaeSAT Journals
 
EU: Wood in the Rough – Market Report. Analysis and Forecast to 2020
EU: Wood in the Rough – Market Report. Analysis and Forecast to 2020EU: Wood in the Rough – Market Report. Analysis and Forecast to 2020
EU: Wood in the Rough – Market Report. Analysis and Forecast to 2020IndexBox Marketing
 
Externalities of the Car Industry - First Ch. MSc Thesis
Externalities of the Car Industry - First Ch. MSc ThesisExternalities of the Car Industry - First Ch. MSc Thesis
Externalities of the Car Industry - First Ch. MSc Thesisserena boccardo
 

Was ist angesagt? (12)

Policy and projects reduction of carbon emissions in the manufacturing industry
 Policy and projects reduction of carbon emissions in the manufacturing industry Policy and projects reduction of carbon emissions in the manufacturing industry
Policy and projects reduction of carbon emissions in the manufacturing industry
 
Natural Gas Consumption Overview In Brazil
Natural Gas Consumption Overview In BrazilNatural Gas Consumption Overview In Brazil
Natural Gas Consumption Overview In Brazil
 
T&C Trade Challenges
T&C Trade ChallengesT&C Trade Challenges
T&C Trade Challenges
 
Consumption basedgh gemissionsc40towns
Consumption basedgh gemissionsc40townsConsumption basedgh gemissionsc40towns
Consumption basedgh gemissionsc40towns
 
EU: Chemical Wood Pulp (Sulphite, Other Than Dissolving Grades) - Market Repo...
EU: Chemical Wood Pulp (Sulphite, Other Than Dissolving Grades) - Market Repo...EU: Chemical Wood Pulp (Sulphite, Other Than Dissolving Grades) - Market Repo...
EU: Chemical Wood Pulp (Sulphite, Other Than Dissolving Grades) - Market Repo...
 
Adhesives global market report 2018 sample
Adhesives global market report 2018 sampleAdhesives global market report 2018 sample
Adhesives global market report 2018 sample
 
How much energy is necessary to make 1 ton of building materials?
How much energy is necessary to make 1 ton of building materials?How much energy is necessary to make 1 ton of building materials?
How much energy is necessary to make 1 ton of building materials?
 
EU: Semi-Chemical Wood Pulp, Pulp Of Fibers Other Than Wood - Market Report. ...
EU: Semi-Chemical Wood Pulp, Pulp Of Fibers Other Than Wood - Market Report. ...EU: Semi-Chemical Wood Pulp, Pulp Of Fibers Other Than Wood - Market Report. ...
EU: Semi-Chemical Wood Pulp, Pulp Of Fibers Other Than Wood - Market Report. ...
 
ENV GLOBAL FORUM OCT 2016 - Session 2 - Bernd MEYER
ENV GLOBAL FORUM OCT 2016 - Session 2 - Bernd MEYERENV GLOBAL FORUM OCT 2016 - Session 2 - Bernd MEYER
ENV GLOBAL FORUM OCT 2016 - Session 2 - Bernd MEYER
 
Dynamics of nitrous oxide emissions from different sources in bulgaria
Dynamics of nitrous oxide emissions from different sources in bulgariaDynamics of nitrous oxide emissions from different sources in bulgaria
Dynamics of nitrous oxide emissions from different sources in bulgaria
 
EU: Wood in the Rough – Market Report. Analysis and Forecast to 2020
EU: Wood in the Rough – Market Report. Analysis and Forecast to 2020EU: Wood in the Rough – Market Report. Analysis and Forecast to 2020
EU: Wood in the Rough – Market Report. Analysis and Forecast to 2020
 
Externalities of the Car Industry - First Ch. MSc Thesis
Externalities of the Car Industry - First Ch. MSc ThesisExternalities of the Car Industry - First Ch. MSc Thesis
Externalities of the Car Industry - First Ch. MSc Thesis
 

Andere mochten auch

Tipos de intervenção terapêutica
Tipos de intervenção terapêuticaTipos de intervenção terapêutica
Tipos de intervenção terapêuticaKatharine Fontes
 
Ecuaciones diferenciales
Ecuaciones diferencialesEcuaciones diferenciales
Ecuaciones diferencialesMaestros Online
 
Accesibilidad universal.
Accesibilidad universal.Accesibilidad universal.
Accesibilidad universal.José María
 
Teaching Young Learners
Teaching Young LearnersTeaching Young Learners
Teaching Young Learnerseaquals
 
Seminario de finanzas, actividades
Seminario de finanzas, actividadesSeminario de finanzas, actividades
Seminario de finanzas, actividadesMaestros Online
 
Superdotação luciane coelho
Superdotação luciane coelhoSuperdotação luciane coelho
Superdotação luciane coelhoUFSM
 
Desarrollo de proyecto de procesos de manufactura cert
Desarrollo de proyecto de procesos de manufactura certDesarrollo de proyecto de procesos de manufactura cert
Desarrollo de proyecto de procesos de manufactura certMaestros Online
 
Indicadores en la evaluación inclusiva.
Indicadores en la evaluación inclusiva.Indicadores en la evaluación inclusiva.
Indicadores en la evaluación inclusiva.José María
 

Andere mochten auch (15)

Me haces feliz
Me haces felizMe haces feliz
Me haces feliz
 
4vavaasmetenzonder
4vavaasmetenzonder 4vavaasmetenzonder
4vavaasmetenzonder
 
Tipos de intervenção terapêutica
Tipos de intervenção terapêuticaTipos de intervenção terapêutica
Tipos de intervenção terapêutica
 
A ciência da natureza
A ciência da naturezaA ciência da natureza
A ciência da natureza
 
CW RESUME12_8_15
CW RESUME12_8_15CW RESUME12_8_15
CW RESUME12_8_15
 
Ecuaciones diferenciales
Ecuaciones diferencialesEcuaciones diferenciales
Ecuaciones diferenciales
 
No hay palabras
No hay palabrasNo hay palabras
No hay palabras
 
Accesibilidad universal.
Accesibilidad universal.Accesibilidad universal.
Accesibilidad universal.
 
Teaching Young Learners
Teaching Young LearnersTeaching Young Learners
Teaching Young Learners
 
Eres mi amigo fiel
Eres mi amigo fielEres mi amigo fiel
Eres mi amigo fiel
 
Fisica 1 fi09101 2013
Fisica 1 fi09101 2013Fisica 1 fi09101 2013
Fisica 1 fi09101 2013
 
Seminario de finanzas, actividades
Seminario de finanzas, actividadesSeminario de finanzas, actividades
Seminario de finanzas, actividades
 
Superdotação luciane coelho
Superdotação luciane coelhoSuperdotação luciane coelho
Superdotação luciane coelho
 
Desarrollo de proyecto de procesos de manufactura cert
Desarrollo de proyecto de procesos de manufactura certDesarrollo de proyecto de procesos de manufactura cert
Desarrollo de proyecto de procesos de manufactura cert
 
Indicadores en la evaluación inclusiva.
Indicadores en la evaluación inclusiva.Indicadores en la evaluación inclusiva.
Indicadores en la evaluación inclusiva.
 

Ähnlich wie CO2 embodied in international Trade (Peters hertwich2008). Lecturas recomendadas. Luis Rico

Referee report paper 1.pdf
Referee report paper 1.pdfReferee report paper 1.pdf
Referee report paper 1.pdfssuser614e36
 
77a Corresponding author. Statistics Norway, Research Depa.docx
77a Corresponding author. Statistics Norway, Research Depa.docx77a Corresponding author. Statistics Norway, Research Depa.docx
77a Corresponding author. Statistics Norway, Research Depa.docxblondellchancy
 
Ipcc initiative in climate change mitigation
Ipcc initiative in climate change mitigationIpcc initiative in climate change mitigation
Ipcc initiative in climate change mitigationParvati Tamrakar
 
carbon trading and india s road map
carbon trading and india s road mapcarbon trading and india s road map
carbon trading and india s road mapIJEAB
 
IEA-ELECTRADE.WPD
IEA-ELECTRADE.WPDIEA-ELECTRADE.WPD
IEA-ELECTRADE.WPDJenny Hou
 
WEF Accelerating Decarbonization through Trade 2022
WEF Accelerating Decarbonization through Trade 2022WEF Accelerating Decarbonization through Trade 2022
WEF Accelerating Decarbonization through Trade 2022cdsk335
 
Toward international architecture for carbon markets, Richard Baron - OECD
Toward international architecture for carbon markets, Richard Baron - OECDToward international architecture for carbon markets, Richard Baron - OECD
Toward international architecture for carbon markets, Richard Baron - OECDOECD Environment
 
84th ICREA colloquium 'Carbon pricing and energy use pathways for staying wit...
84th ICREA colloquium 'Carbon pricing and energy use pathways for staying wit...84th ICREA colloquium 'Carbon pricing and energy use pathways for staying wit...
84th ICREA colloquium 'Carbon pricing and energy use pathways for staying wit...ICREA
 
An Economic View of Environmental Protection
An Economic View of Environmental ProtectionAn Economic View of Environmental Protection
An Economic View of Environmental ProtectioneAmbiente
 
11/2014convegno su Green Economy e industria manifatturiera in Italia. Presen...
11/2014convegno su Green Economy e industria manifatturiera in Italia. Presen...11/2014convegno su Green Economy e industria manifatturiera in Italia. Presen...
11/2014convegno su Green Economy e industria manifatturiera in Italia. Presen...Gabriella Foglio
 
Green Talks LIVE | Assessing the Economic Impacts of Environmental Policies
Green Talks LIVE | Assessing the Economic Impacts of Environmental PoliciesGreen Talks LIVE | Assessing the Economic Impacts of Environmental Policies
Green Talks LIVE | Assessing the Economic Impacts of Environmental PoliciesOECD Environment
 
Key Messages on Aligning Policies, Kurt Van Dender - OECD
Key Messages on Aligning Policies, Kurt Van Dender - OECDKey Messages on Aligning Policies, Kurt Van Dender - OECD
Key Messages on Aligning Policies, Kurt Van Dender - OECDOECD Environment
 
O54138146.pdf
O54138146.pdfO54138146.pdf
O54138146.pdfaijbm
 
Responsibility For Carbon Emission Reduction
Responsibility For Carbon Emission ReductionResponsibility For Carbon Emission Reduction
Responsibility For Carbon Emission ReductionMichelle Madero
 
3-OECD-Tax-policy-and-climate-change.pdf
3-OECD-Tax-policy-and-climate-change.pdf3-OECD-Tax-policy-and-climate-change.pdf
3-OECD-Tax-policy-and-climate-change.pdfOECD Governance
 
Estimating consumptionbasedgh gemissions_sei2019
Estimating consumptionbasedgh gemissions_sei2019Estimating consumptionbasedgh gemissions_sei2019
Estimating consumptionbasedgh gemissions_sei2019PatrickTanz
 

Ähnlich wie CO2 embodied in international Trade (Peters hertwich2008). Lecturas recomendadas. Luis Rico (20)

tyesterser.pdf
tyesterser.pdftyesterser.pdf
tyesterser.pdf
 
Referee report paper 1.pdf
Referee report paper 1.pdfReferee report paper 1.pdf
Referee report paper 1.pdf
 
77a Corresponding author. Statistics Norway, Research Depa.docx
77a Corresponding author. Statistics Norway, Research Depa.docx77a Corresponding author. Statistics Norway, Research Depa.docx
77a Corresponding author. Statistics Norway, Research Depa.docx
 
Ipcc initiative in climate change mitigation
Ipcc initiative in climate change mitigationIpcc initiative in climate change mitigation
Ipcc initiative in climate change mitigation
 
carbon trading and india s road map
carbon trading and india s road mapcarbon trading and india s road map
carbon trading and india s road map
 
IEA-ELECTRADE.WPD
IEA-ELECTRADE.WPDIEA-ELECTRADE.WPD
IEA-ELECTRADE.WPD
 
WEF Accelerating Decarbonization through Trade 2022
WEF Accelerating Decarbonization through Trade 2022WEF Accelerating Decarbonization through Trade 2022
WEF Accelerating Decarbonization through Trade 2022
 
Toward international architecture for carbon markets, Richard Baron - OECD
Toward international architecture for carbon markets, Richard Baron - OECDToward international architecture for carbon markets, Richard Baron - OECD
Toward international architecture for carbon markets, Richard Baron - OECD
 
84th ICREA colloquium 'Carbon pricing and energy use pathways for staying wit...
84th ICREA colloquium 'Carbon pricing and energy use pathways for staying wit...84th ICREA colloquium 'Carbon pricing and energy use pathways for staying wit...
84th ICREA colloquium 'Carbon pricing and energy use pathways for staying wit...
 
Presentation1
Presentation1Presentation1
Presentation1
 
An Economic View of Environmental Protection
An Economic View of Environmental ProtectionAn Economic View of Environmental Protection
An Economic View of Environmental Protection
 
11/2014convegno su Green Economy e industria manifatturiera in Italia. Presen...
11/2014convegno su Green Economy e industria manifatturiera in Italia. Presen...11/2014convegno su Green Economy e industria manifatturiera in Italia. Presen...
11/2014convegno su Green Economy e industria manifatturiera in Italia. Presen...
 
The Kyoto Protocol
The Kyoto ProtocolThe Kyoto Protocol
The Kyoto Protocol
 
tarekegne
 tarekegne tarekegne
tarekegne
 
Green Talks LIVE | Assessing the Economic Impacts of Environmental Policies
Green Talks LIVE | Assessing the Economic Impacts of Environmental PoliciesGreen Talks LIVE | Assessing the Economic Impacts of Environmental Policies
Green Talks LIVE | Assessing the Economic Impacts of Environmental Policies
 
Key Messages on Aligning Policies, Kurt Van Dender - OECD
Key Messages on Aligning Policies, Kurt Van Dender - OECDKey Messages on Aligning Policies, Kurt Van Dender - OECD
Key Messages on Aligning Policies, Kurt Van Dender - OECD
 
O54138146.pdf
O54138146.pdfO54138146.pdf
O54138146.pdf
 
Responsibility For Carbon Emission Reduction
Responsibility For Carbon Emission ReductionResponsibility For Carbon Emission Reduction
Responsibility For Carbon Emission Reduction
 
3-OECD-Tax-policy-and-climate-change.pdf
3-OECD-Tax-policy-and-climate-change.pdf3-OECD-Tax-policy-and-climate-change.pdf
3-OECD-Tax-policy-and-climate-change.pdf
 
Estimating consumptionbasedgh gemissions_sei2019
Estimating consumptionbasedgh gemissions_sei2019Estimating consumptionbasedgh gemissions_sei2019
Estimating consumptionbasedgh gemissions_sei2019
 

Mehr von Ecologistas en Accion

Aria più pulita spostamenti più facili e veloci per tutti
Aria più pulita spostamenti più facili e veloci per tuttiAria più pulita spostamenti più facili e veloci per tutti
Aria più pulita spostamenti più facili e veloci per tuttiEcologistas en Accion
 
Londres en el camino a ciudad cero emisiones
Londres en el camino a ciudad cero emisionesLondres en el camino a ciudad cero emisiones
Londres en el camino a ciudad cero emisionesEcologistas en Accion
 
¿Ha sido Madrid Central efectivo para reducir los niveles de NO2?
¿Ha sido Madrid Central efectivo para reducir los niveles de NO2?¿Ha sido Madrid Central efectivo para reducir los niveles de NO2?
¿Ha sido Madrid Central efectivo para reducir los niveles de NO2?Ecologistas en Accion
 
Balance del efecto de Madrid Central
Balance del efecto de Madrid CentralBalance del efecto de Madrid Central
Balance del efecto de Madrid CentralEcologistas en Accion
 
Sistemas Urbanos de Drenaje Sostenible (SUDS)
Sistemas Urbanos de Drenaje Sostenible (SUDS)Sistemas Urbanos de Drenaje Sostenible (SUDS)
Sistemas Urbanos de Drenaje Sostenible (SUDS)Ecologistas en Accion
 
Cómo reducir la huella de Carbono en nuestro día a día
Cómo reducir la huella de Carbono en nuestro día a díaCómo reducir la huella de Carbono en nuestro día a día
Cómo reducir la huella de Carbono en nuestro día a díaEcologistas en Accion
 
Exposición a contaminantes por la alimentación
Exposición a contaminantes por la alimentaciónExposición a contaminantes por la alimentación
Exposición a contaminantes por la alimentaciónEcologistas en Accion
 
La reciente decisión del Tribunal español sobre planes de calidad del aire
La reciente decisión del Tribunal español sobre planes de calidad del aireLa reciente decisión del Tribunal español sobre planes de calidad del aire
La reciente decisión del Tribunal español sobre planes de calidad del aireEcologistas en Accion
 
El transport públic front la contaminació
El transport públic front la contaminacióEl transport públic front la contaminació
El transport públic front la contaminacióEcologistas en Accion
 

Mehr von Ecologistas en Accion (20)

Autoconsumo fotovoltaica
Autoconsumo fotovoltaicaAutoconsumo fotovoltaica
Autoconsumo fotovoltaica
 
Aria più pulita spostamenti più facili e veloci per tutti
Aria più pulita spostamenti più facili e veloci per tuttiAria più pulita spostamenti più facili e veloci per tutti
Aria più pulita spostamenti più facili e veloci per tutti
 
Londres en el camino a ciudad cero emisiones
Londres en el camino a ciudad cero emisionesLondres en el camino a ciudad cero emisiones
Londres en el camino a ciudad cero emisiones
 
Calidad del aire urbano y movilidad
Calidad del aire urbano y movilidadCalidad del aire urbano y movilidad
Calidad del aire urbano y movilidad
 
¿Ha sido Madrid Central efectivo para reducir los niveles de NO2?
¿Ha sido Madrid Central efectivo para reducir los niveles de NO2?¿Ha sido Madrid Central efectivo para reducir los niveles de NO2?
¿Ha sido Madrid Central efectivo para reducir los niveles de NO2?
 
Balance del efecto de Madrid Central
Balance del efecto de Madrid CentralBalance del efecto de Madrid Central
Balance del efecto de Madrid Central
 
Sistemas Urbanos de Drenaje Sostenible (SUDS)
Sistemas Urbanos de Drenaje Sostenible (SUDS)Sistemas Urbanos de Drenaje Sostenible (SUDS)
Sistemas Urbanos de Drenaje Sostenible (SUDS)
 
Cómo reducir la huella de Carbono en nuestro día a día
Cómo reducir la huella de Carbono en nuestro día a díaCómo reducir la huella de Carbono en nuestro día a día
Cómo reducir la huella de Carbono en nuestro día a día
 
Exposición a contaminantes por la alimentación
Exposición a contaminantes por la alimentaciónExposición a contaminantes por la alimentación
Exposición a contaminantes por la alimentación
 
La reciente decisión del Tribunal español sobre planes de calidad del aire
La reciente decisión del Tribunal español sobre planes de calidad del aireLa reciente decisión del Tribunal español sobre planes de calidad del aire
La reciente decisión del Tribunal español sobre planes de calidad del aire
 
Transformar el mundo no el clima
Transformar el mundo no el climaTransformar el mundo no el clima
Transformar el mundo no el clima
 
El transport públic front la contaminació
El transport públic front la contaminacióEl transport públic front la contaminació
El transport públic front la contaminació
 
Miguel Ceballos
Miguel CeballosMiguel Ceballos
Miguel Ceballos
 
Gloria Carrasco
Gloria CarrascoGloria Carrasco
Gloria Carrasco
 
Peatge urbá a Barcelona
Peatge urbá a BarcelonaPeatge urbá a Barcelona
Peatge urbá a Barcelona
 
Nuria Blazquez
Nuria BlazquezNuria Blazquez
Nuria Blazquez
 
Maria Cruz Mminguillon
Maria Cruz MminguillonMaria Cruz Mminguillon
Maria Cruz Mminguillon
 
Juan Barcena
Juan BarcenaJuan Barcena
Juan Barcena
 
Josep Manuel Felisi
Josep Manuel FelisiJosep Manuel Felisi
Josep Manuel Felisi
 
Isabell Buschel
Isabell BuschelIsabell Buschel
Isabell Buschel
 

Kürzlich hochgeladen

Get Premium Hoskote Call Girls (8005736733) 24x7 Rate 15999 with A/c Room Cas...
Get Premium Hoskote Call Girls (8005736733) 24x7 Rate 15999 with A/c Room Cas...Get Premium Hoskote Call Girls (8005736733) 24x7 Rate 15999 with A/c Room Cas...
Get Premium Hoskote Call Girls (8005736733) 24x7 Rate 15999 with A/c Room Cas...MOHANI PANDEY
 
VIP Model Call Girls Chakan ( Pune ) Call ON 8005736733 Starting From 5K to 2...
VIP Model Call Girls Chakan ( Pune ) Call ON 8005736733 Starting From 5K to 2...VIP Model Call Girls Chakan ( Pune ) Call ON 8005736733 Starting From 5K to 2...
VIP Model Call Girls Chakan ( Pune ) Call ON 8005736733 Starting From 5K to 2...SUHANI PANDEY
 
Verified Trusted Kalyani Nagar Call Girls 8005736733 𝐈𝐍𝐃𝐄𝐏𝐄𝐍𝐃𝐄𝐍𝐓 Call 𝐆𝐈𝐑𝐋 𝐕...
Verified Trusted Kalyani Nagar Call Girls  8005736733 𝐈𝐍𝐃𝐄𝐏𝐄𝐍𝐃𝐄𝐍𝐓 Call 𝐆𝐈𝐑𝐋 𝐕...Verified Trusted Kalyani Nagar Call Girls  8005736733 𝐈𝐍𝐃𝐄𝐏𝐄𝐍𝐃𝐄𝐍𝐓 Call 𝐆𝐈𝐑𝐋 𝐕...
Verified Trusted Kalyani Nagar Call Girls 8005736733 𝐈𝐍𝐃𝐄𝐏𝐄𝐍𝐃𝐄𝐍𝐓 Call 𝐆𝐈𝐑𝐋 𝐕...tanu pandey
 
Call Girls Magarpatta Call Me 7737669865 Budget Friendly No Advance Booking
Call Girls Magarpatta Call Me 7737669865 Budget Friendly No Advance BookingCall Girls Magarpatta Call Me 7737669865 Budget Friendly No Advance Booking
Call Girls Magarpatta Call Me 7737669865 Budget Friendly No Advance Bookingroncy bisnoi
 
Call Now ☎ Russian Call Girls Connaught Place @ 9899900591 # Russian Escorts ...
Call Now ☎ Russian Call Girls Connaught Place @ 9899900591 # Russian Escorts ...Call Now ☎ Russian Call Girls Connaught Place @ 9899900591 # Russian Escorts ...
Call Now ☎ Russian Call Girls Connaught Place @ 9899900591 # Russian Escorts ...kauryashika82
 
Hot Call Girls 🫤 Malviya Nagar ➡️ 9711199171 ➡️ Delhi 🫦 Whatsapp Number
Hot Call Girls 🫤 Malviya Nagar ➡️ 9711199171 ➡️ Delhi 🫦 Whatsapp NumberHot Call Girls 🫤 Malviya Nagar ➡️ 9711199171 ➡️ Delhi 🫦 Whatsapp Number
Hot Call Girls 🫤 Malviya Nagar ➡️ 9711199171 ➡️ Delhi 🫦 Whatsapp Numberkumarajju5765
 
CSR_Module5_Green Earth Initiative, Tree Planting Day
CSR_Module5_Green Earth Initiative, Tree Planting DayCSR_Module5_Green Earth Initiative, Tree Planting Day
CSR_Module5_Green Earth Initiative, Tree Planting DayGeorgeDiamandis11
 
Alandi Road ( Call Girls ) Pune 6297143586 Hot Model With Sexy Bhabi Ready ...
Alandi Road ( Call Girls ) Pune  6297143586  Hot Model With Sexy Bhabi Ready ...Alandi Road ( Call Girls ) Pune  6297143586  Hot Model With Sexy Bhabi Ready ...
Alandi Road ( Call Girls ) Pune 6297143586 Hot Model With Sexy Bhabi Ready ...tanu pandey
 
Booking open Available Pune Call Girls Budhwar Peth 6297143586 Call Hot Indi...
Booking open Available Pune Call Girls Budhwar Peth  6297143586 Call Hot Indi...Booking open Available Pune Call Girls Budhwar Peth  6297143586 Call Hot Indi...
Booking open Available Pune Call Girls Budhwar Peth 6297143586 Call Hot Indi...Call Girls in Nagpur High Profile
 
Call Girls In Okhla DELHI ~9654467111~ Short 1500 Night 6000
Call Girls In Okhla DELHI ~9654467111~ Short 1500 Night 6000Call Girls In Okhla DELHI ~9654467111~ Short 1500 Night 6000
Call Girls In Okhla DELHI ~9654467111~ Short 1500 Night 6000Sapana Sha
 
Booking open Available Pune Call Girls Yewalewadi 6297143586 Call Hot Indian...
Booking open Available Pune Call Girls Yewalewadi  6297143586 Call Hot Indian...Booking open Available Pune Call Girls Yewalewadi  6297143586 Call Hot Indian...
Booking open Available Pune Call Girls Yewalewadi 6297143586 Call Hot Indian...Call Girls in Nagpur High Profile
 
Call Girls Ramtek Call Me 7737669865 Budget Friendly No Advance Booking
Call Girls Ramtek Call Me 7737669865 Budget Friendly No Advance BookingCall Girls Ramtek Call Me 7737669865 Budget Friendly No Advance Booking
Call Girls Ramtek Call Me 7737669865 Budget Friendly No Advance Bookingroncy bisnoi
 
Book Sex Workers Available Pune Call Girls Kondhwa 6297143586 Call Hot India...
Book Sex Workers Available Pune Call Girls Kondhwa  6297143586 Call Hot India...Book Sex Workers Available Pune Call Girls Kondhwa  6297143586 Call Hot India...
Book Sex Workers Available Pune Call Girls Kondhwa 6297143586 Call Hot India...Call Girls in Nagpur High Profile
 
Types of Pollution Powerpoint presentation
Types of Pollution Powerpoint presentationTypes of Pollution Powerpoint presentation
Types of Pollution Powerpoint presentationmarygraceaque1
 
Call Girl Nagpur Roshni Call 7001035870 Meet With Nagpur Escorts
Call Girl Nagpur Roshni Call 7001035870 Meet With Nagpur EscortsCall Girl Nagpur Roshni Call 7001035870 Meet With Nagpur Escorts
Call Girl Nagpur Roshni Call 7001035870 Meet With Nagpur EscortsCall Girls in Nagpur High Profile
 
Call On 6297143586 Pimpri Chinchwad Call Girls In All Pune 24/7 Provide Call...
Call On 6297143586  Pimpri Chinchwad Call Girls In All Pune 24/7 Provide Call...Call On 6297143586  Pimpri Chinchwad Call Girls In All Pune 24/7 Provide Call...
Call On 6297143586 Pimpri Chinchwad Call Girls In All Pune 24/7 Provide Call...tanu pandey
 
Call Girls In Bloom Boutique | GK-1 ☎ 9990224454 High Class Delhi NCR 24 Hour...
Call Girls In Bloom Boutique | GK-1 ☎ 9990224454 High Class Delhi NCR 24 Hour...Call Girls In Bloom Boutique | GK-1 ☎ 9990224454 High Class Delhi NCR 24 Hour...
Call Girls In Bloom Boutique | GK-1 ☎ 9990224454 High Class Delhi NCR 24 Hour...rajputriyana310
 

Kürzlich hochgeladen (20)

Get Premium Hoskote Call Girls (8005736733) 24x7 Rate 15999 with A/c Room Cas...
Get Premium Hoskote Call Girls (8005736733) 24x7 Rate 15999 with A/c Room Cas...Get Premium Hoskote Call Girls (8005736733) 24x7 Rate 15999 with A/c Room Cas...
Get Premium Hoskote Call Girls (8005736733) 24x7 Rate 15999 with A/c Room Cas...
 
VIP Model Call Girls Chakan ( Pune ) Call ON 8005736733 Starting From 5K to 2...
VIP Model Call Girls Chakan ( Pune ) Call ON 8005736733 Starting From 5K to 2...VIP Model Call Girls Chakan ( Pune ) Call ON 8005736733 Starting From 5K to 2...
VIP Model Call Girls Chakan ( Pune ) Call ON 8005736733 Starting From 5K to 2...
 
Verified Trusted Kalyani Nagar Call Girls 8005736733 𝐈𝐍𝐃𝐄𝐏𝐄𝐍𝐃𝐄𝐍𝐓 Call 𝐆𝐈𝐑𝐋 𝐕...
Verified Trusted Kalyani Nagar Call Girls  8005736733 𝐈𝐍𝐃𝐄𝐏𝐄𝐍𝐃𝐄𝐍𝐓 Call 𝐆𝐈𝐑𝐋 𝐕...Verified Trusted Kalyani Nagar Call Girls  8005736733 𝐈𝐍𝐃𝐄𝐏𝐄𝐍𝐃𝐄𝐍𝐓 Call 𝐆𝐈𝐑𝐋 𝐕...
Verified Trusted Kalyani Nagar Call Girls 8005736733 𝐈𝐍𝐃𝐄𝐏𝐄𝐍𝐃𝐄𝐍𝐓 Call 𝐆𝐈𝐑𝐋 𝐕...
 
Call Girls Magarpatta Call Me 7737669865 Budget Friendly No Advance Booking
Call Girls Magarpatta Call Me 7737669865 Budget Friendly No Advance BookingCall Girls Magarpatta Call Me 7737669865 Budget Friendly No Advance Booking
Call Girls Magarpatta Call Me 7737669865 Budget Friendly No Advance Booking
 
Call Now ☎ Russian Call Girls Connaught Place @ 9899900591 # Russian Escorts ...
Call Now ☎ Russian Call Girls Connaught Place @ 9899900591 # Russian Escorts ...Call Now ☎ Russian Call Girls Connaught Place @ 9899900591 # Russian Escorts ...
Call Now ☎ Russian Call Girls Connaught Place @ 9899900591 # Russian Escorts ...
 
young Whatsapp Call Girls in Delhi Cantt🔝 9953056974 🔝 escort service
young Whatsapp Call Girls in Delhi Cantt🔝 9953056974 🔝 escort serviceyoung Whatsapp Call Girls in Delhi Cantt🔝 9953056974 🔝 escort service
young Whatsapp Call Girls in Delhi Cantt🔝 9953056974 🔝 escort service
 
Hot Call Girls 🫤 Malviya Nagar ➡️ 9711199171 ➡️ Delhi 🫦 Whatsapp Number
Hot Call Girls 🫤 Malviya Nagar ➡️ 9711199171 ➡️ Delhi 🫦 Whatsapp NumberHot Call Girls 🫤 Malviya Nagar ➡️ 9711199171 ➡️ Delhi 🫦 Whatsapp Number
Hot Call Girls 🫤 Malviya Nagar ➡️ 9711199171 ➡️ Delhi 🫦 Whatsapp Number
 
CSR_Module5_Green Earth Initiative, Tree Planting Day
CSR_Module5_Green Earth Initiative, Tree Planting DayCSR_Module5_Green Earth Initiative, Tree Planting Day
CSR_Module5_Green Earth Initiative, Tree Planting Day
 
Call Girls In Yamuna Vihar꧁❤ 🔝 9953056974🔝❤꧂ Escort ServiCe
Call Girls In Yamuna Vihar꧁❤ 🔝 9953056974🔝❤꧂ Escort ServiCeCall Girls In Yamuna Vihar꧁❤ 🔝 9953056974🔝❤꧂ Escort ServiCe
Call Girls In Yamuna Vihar꧁❤ 🔝 9953056974🔝❤꧂ Escort ServiCe
 
Alandi Road ( Call Girls ) Pune 6297143586 Hot Model With Sexy Bhabi Ready ...
Alandi Road ( Call Girls ) Pune  6297143586  Hot Model With Sexy Bhabi Ready ...Alandi Road ( Call Girls ) Pune  6297143586  Hot Model With Sexy Bhabi Ready ...
Alandi Road ( Call Girls ) Pune 6297143586 Hot Model With Sexy Bhabi Ready ...
 
Booking open Available Pune Call Girls Budhwar Peth 6297143586 Call Hot Indi...
Booking open Available Pune Call Girls Budhwar Peth  6297143586 Call Hot Indi...Booking open Available Pune Call Girls Budhwar Peth  6297143586 Call Hot Indi...
Booking open Available Pune Call Girls Budhwar Peth 6297143586 Call Hot Indi...
 
Call Girls In Okhla DELHI ~9654467111~ Short 1500 Night 6000
Call Girls In Okhla DELHI ~9654467111~ Short 1500 Night 6000Call Girls In Okhla DELHI ~9654467111~ Short 1500 Night 6000
Call Girls In Okhla DELHI ~9654467111~ Short 1500 Night 6000
 
Booking open Available Pune Call Girls Yewalewadi 6297143586 Call Hot Indian...
Booking open Available Pune Call Girls Yewalewadi  6297143586 Call Hot Indian...Booking open Available Pune Call Girls Yewalewadi  6297143586 Call Hot Indian...
Booking open Available Pune Call Girls Yewalewadi 6297143586 Call Hot Indian...
 
Call Girls Ramtek Call Me 7737669865 Budget Friendly No Advance Booking
Call Girls Ramtek Call Me 7737669865 Budget Friendly No Advance BookingCall Girls Ramtek Call Me 7737669865 Budget Friendly No Advance Booking
Call Girls Ramtek Call Me 7737669865 Budget Friendly No Advance Booking
 
Book Sex Workers Available Pune Call Girls Kondhwa 6297143586 Call Hot India...
Book Sex Workers Available Pune Call Girls Kondhwa  6297143586 Call Hot India...Book Sex Workers Available Pune Call Girls Kondhwa  6297143586 Call Hot India...
Book Sex Workers Available Pune Call Girls Kondhwa 6297143586 Call Hot India...
 
Types of Pollution Powerpoint presentation
Types of Pollution Powerpoint presentationTypes of Pollution Powerpoint presentation
Types of Pollution Powerpoint presentation
 
Call Girl Nagpur Roshni Call 7001035870 Meet With Nagpur Escorts
Call Girl Nagpur Roshni Call 7001035870 Meet With Nagpur EscortsCall Girl Nagpur Roshni Call 7001035870 Meet With Nagpur Escorts
Call Girl Nagpur Roshni Call 7001035870 Meet With Nagpur Escorts
 
Call On 6297143586 Pimpri Chinchwad Call Girls In All Pune 24/7 Provide Call...
Call On 6297143586  Pimpri Chinchwad Call Girls In All Pune 24/7 Provide Call...Call On 6297143586  Pimpri Chinchwad Call Girls In All Pune 24/7 Provide Call...
Call On 6297143586 Pimpri Chinchwad Call Girls In All Pune 24/7 Provide Call...
 
Call Girls In Bloom Boutique | GK-1 ☎ 9990224454 High Class Delhi NCR 24 Hour...
Call Girls In Bloom Boutique | GK-1 ☎ 9990224454 High Class Delhi NCR 24 Hour...Call Girls In Bloom Boutique | GK-1 ☎ 9990224454 High Class Delhi NCR 24 Hour...
Call Girls In Bloom Boutique | GK-1 ☎ 9990224454 High Class Delhi NCR 24 Hour...
 
E Waste Management
E Waste ManagementE Waste Management
E Waste Management
 

CO2 embodied in international Trade (Peters hertwich2008). Lecturas recomendadas. Luis Rico

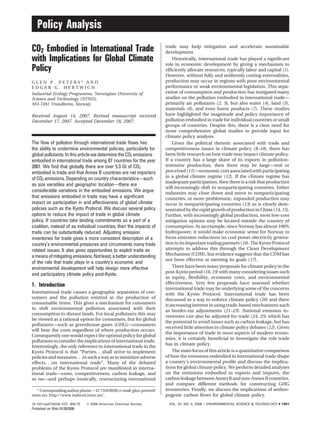
  • 1. Policy Analysis CO2 Embodied in International Trade with Implications for Global Climate Policy G L E N P . P E T E R S * A N D E D G A R G . H E R T W I C H Industrial Ecology Programme, Norwegian University of Science and Technology (NTNU), NO-7491 Trondheim, Norway Received August 14, 2007. Revised manuscript received December 17, 2007. Accepted December 18, 2007. The flow of pollution through international trade flows has the ability to undermine environmental policies, particularly for globalpollutants.InthisarticlewedeterminetheCO2 emissions embodied in international trade among 87 countries for the year 2001. We find that globally there are over 5.3 Gt of CO2 embodied in trade and that Annex B countries are net importers of CO2 emissions. Depending on country characteristics—such as size variables and geographic location—there are considerable variations in the embodied emissions. We argue that emissions embodied in trade may have a significant impact on participation in and effectiveness of global climate policies such as the Kyoto Protocol. We discuss several policy options to reduce the impact of trade in global climate policy. If countries take binding commitments as a part of a coalition, instead of as individual countries, then the impacts of trade can be substantially reduced. Adjusting emission inventories for trade gives a more consistent description of a country’s environmental pressures and circumvents many trade related issues. It also gives opportunities to exploit trade as ameansofmitigatingemissions.Notleast,abetterunderstanding of the role that trade plays in a country’s economic and environmental development will help design more effective and participatory climate policy post-Kyoto. 1. Introduction International trade causes a geographic separation of con- sumers and the pollution emitted in the production of consumable items. This gives a mechanism for consumers to shift environmental pollution associated with their consumption to distant lands. For local pollutants this may be viewed as a rational option for consumers, but for global pollutants—such as greenhouse gases (GHG)—consumers will bear the costs regardless of where production occurs. Consequently one would expect the optimal policy for global pollutants to consider the implications of international trade. Interestingly, the only reference to international trade in the Kyoto Protocol is that “Parties. . .shall strive to implement policiesandmeasures. . .insuchawayastominimizeadverse effects. . .on international trade”. Many of the debated problems of the Kyoto Protocol are manifested in interna- tional trade—costs, competitiveness, carbon leakage, and so on—and perhaps ironically, restructuring international trade may help mitigation and accelerate sustainable development. Historically, international trade has played a significant role in economic development by giving a mechanism to efficiently allocate resources, typically labor and capital (1). However, without fully and uniformly costing externalities, production may occur in regions with poor environmental performance or weak environmental legislation. This sepa- ration of consumption and production has instigated many studies on the pollution embodied in international trade— primarily air pollutants (2, 3), but also water (4), land (5), materials (6), and even forest products (7). These studies have highlighted the magnitude and policy importance of pollution embodied in trade for individual countries or small groups of countries. Despite this, there is a clear need for more comprehensive global studies to provide input for climate policy analysis. Given the political rhetoric associated with trade and competitiveness issues in climate policy (8–10), there has been little research on how trade may impact climate policy. If a country has a large share of its exports in pollution- intensive production, then there may be large—real or perceived (11)—economic cost associated with participating in a global climate regime (12). If the climate regime has inadequate participation, then there is a risk that production will increasingly shift to nonparticipating countries. Either industries may close down and move to nonparticipating countries, or more problematic, expanded production may occur in nonparticipating countries (13) as is clearly dem- onstrated by the rapid growth of production in China (14, 15). Further, with increasingly global production, most low-cost mitigation options may be located outside the country of consumption. As an example, since Norway has almost 100% hydropower, it would make economic sense for Norway to focus emission reductions on coal power electricity genera- tion in its important trading partners (16). The Kyoto Protocol attempts to address this through the Clean Development Mechanism (CDM), but evidence suggests that the CDM has not been effective at meeting its goals (17). There have been many proposals for climate policy in the post-Kyoto period (18, 19) with many considering issues such as equity, flexibility, economic costs, and environmental effectiveness. Very few proposals have assessed whether international trade may be underlying some of the concerns with the Kyoto Protocol. International trade has been discussed as a way to enforce climate policy (20) and there is increasing interest in using trade-based mechanisms such as border-tax adjustments (21–23). National emission in- ventories can also be adjusted for trade (24, 25) which has the potential to avoid issues such as carbon leakage, but has received little attention in climate policy debates (12). Given the importance of trade in most aspects of modern econo- mies, it is certainly beneficial to investigate the role trade has in climate policy. The main focus of this article is a quantitative comparison of how the emissions embodied in international trade shape a country’s environmental profile and discuss the implica- tions for global climate policy. We perform detailed analyses on the emissions embodied in exports and imports, the carbonleakagebetweenAnnexBandnon-AnnexBcountries, and compare different methods for constructing GHG inventories. Finally, we discuss the implications of anthro- pogenic carbon flows for global climate policy. * Correspondingauthorphone:+4773598938;e-mail:glen.peters@ ntnu.no; http://www.indecol.ntnu.no/. 10.1021/es072023k CCC: $40.75  2008 American Chemical Society VOL. 42, NO. 5, 2008 / ENVIRONMENTAL SCIENCE & TECHNOLOGY 9 1401 Published on Web 01/30/2008
  • 2. 2. Background and Methodology Often, the most polluting aspect of a consumable product is the pollution emitted in production. The emissions occur either directly through the production processes or indirectly in the global supply chain due to acquisitions such as electricity, transportation, manufacturing, and so on. The accumulated emissions emitted in the production of the product are said to be “embodied” emissions (other authors have used “virtual” or “hidden”). For global climate policy the “emissions embodied in trade” (EET) between countries are of most interest. We consider three aspects of EET relevant for global climate policy. First, a direct analysis of EET provides a better understanding of the environmental separation between domestic consumption and global production. Second, an analysis of carbon leakage reveals to what extent pollution is shifted rather than abated. Third, trade-adjusted GHG emission inventories eliminate carbon leakage and attempt to exploit trade to mitigate emissions. 2.1. Emissions Embodied in Trade (EET). Calculating the EET can become complex due to the need to enumerate the unique production systems in individual countries to a reasonable level of sectorial detail and then to link this to consumption systems through international trade data. The most common methodology for this type of analysis is a generalization of environmental input-output analysis (IOA) (26) to a multiregional setting. Using IOA there are two main approaches to modeling EET at a national level (27). The simplest approach is to determine the domestic CO2 emissions in each country to producethebilateraltradewithanothercountry.Thismethod is the most transparent, but does not assess the imports required to produce the bilateral trade. A more complex approach uses a multiregional input-output (MRIO) model to determine the global emissions for an exogenous final consumption with global trade determined endogenously. Both methods give the same global emissions, but the national emissions differ in the method of allocating inter- mediate consumption (27). In this article we employ the simplified version that we find is more transparent and appropriate for quantitative analysis of EET in global climate policy. To explicitly model the EET requires a decomposition of the standard IOA framework into domestic and traded components. The total CO2 emissions occurring in each region are fr ) Fr(I - Arr)-1 (yrr + ∑s ers) (1) where Fr is a row vector with each element representing the CO2 emissions per unit industry output, Arr are the inter- industry requirements of domestically produced products demanded by domestic industries, yrr are the products produced and consumed domestically, ers are the bilateral exports from region r to region s, and I is the identity matrix. Summing over all regions gives the total global emissions since bilateral trade is considered. In the full MRIO model the bilateral trade, ers, is decomposed into components for intermediate and final consumption (27). The linearity assumption of IOA allows eq 1 to be decomposed into components for domestic demand on domestic production frr ) Fr(I - Arr)-1 yrr (2) and the EET from region r to region s frs ) Fr(I - Arr)-1 ers (3) Summation gives the total emissions occurring in the country fr ) frr +Σs frs. Direct household and government emissions— such as personal car use—can be included in frr. The total emissions embodied in exports (EEE) from region r to all other regions are fr e ) ∑s frs (4) and the total emissions embodied in imports (EEI) are obtained by reversing the summation fr m ) ∑s fsr (5) Another quantity that is often discussed in the literature is the Balance of Emissions Embodied in Trade (BEET) fr BEET ) fr e - fr m (6) which represents a trade balance for pollution. 2.2. Carbon Leakage. Carbon leakage is an issue that has been discussed quite extensively in the economics literature on climate change (28). In this article we deviate from the notion of carbon leakage used in Computable General Equilibrium (CGE) modeling. The CGE literature takes a very “strong” definition of carbon leakage (13) defined as the increase in non-Annex B emissions divided by the reduction in Annex B emissions (28). Under this definition, the analyst seeks to determine the production that shifts from an Annex B to a non-Annex B country in response to a GHG mitigation policy in an Annex B country. Theoretical studies of strong carbon leakage find the leakage to range between 0 and 130%, but it is highly dependent on the modeling assumptions (28). Empirically, there is little evidence that production shifts due to environmental legislation (29, 30). The weakness of the IPCC definition of carbon leakage is that it ignores the fact that production may increase in non- Annex B countries for reasons totally disconnected to climate mitigationinAnnexBcountries—“weak”carbonleakage(13). From 1990 to 2006 global GHG emissions have increased 35% despite stabilizing in Annex B countries (31) and it is important to quantify what portion of this increase is directly or indirectly due to consumption in Annex B countries. This gives rise to an alternative notion of “weak carbon leakage”, defined as the CO2 EEI from non-Annex B countries to Annex B countries fr * ) ∑s∉AnnexB f sr (7) where the summation includes only non-Annex B countries. This weaker definition of carbon leakage is typically employed in the EET literature and considers the total aggregatedCO2 flowsfromnon-AnnexBtoAnnexBcountries. The distinct advantage of “weak carbon leakage” is that it quantifies how much production in non-Annex B countries is to meet consumption in Annex B countries; for instance, how much of China’s emissions are exported. In terms of the global climate system, it is irrelevant if a policy change in an AnnexBcountrycausedproductiontoincreaseinnon-Annex B countries (“strong carbon leakage”). It is more important to quantify how much Annex B consumption is produced in countries without binding mitigation policies in place (“weak carbon leakage”). 2.3. Production and Consumption Inventories. There are several ways to allocate responsibility for anthropogenic emissions to countries (32). Of particular interest for climate policy is the allocation of production-based and consump- tion-based emissions (25, 12, 27). We define the production- 1402 9 ENVIRONMENTAL SCIENCE & TECHNOLOGY / VOL. 42, NO. 5, 2008
  • 3. based emission inventory as the total domestic emissions occurring from economic production within a country fr prod ) fr (8) The production-based inventory is related to, but different from the IPCC definition. In the IPCC definition, emission inventories are allocated according to “national (including administered) territories and offshore areas over which the country has jurisdiction” (33), while our production-based inventories are based on the economic activities ofresidential institutions as defined in the System of National Accounts (SNA) (34) and used in the NAMEA (35, 36). Generally the underlying source data are the same, but the production- basedinventoriesincludeinternationaleconomicactivities— primarily, international transportation and tourism—as defined in the Gross Domestic Product (GDP) (12). Further, the NAMEA are allocated to economic sectors, while the IPCC data are allocated to technologies. We define the consumption-based emission inventory as the total global emissions occurring from economic con- sumption within a country fr cons ) fr prod - fr e + fr m ) fr - fr BEET (9) and can thus be considered a trade-adjusted version of the production-based inventory. The consumption-based in- ventory takes the production-based inventory, but deducts the EEE and adds the EEI. According to our definitions of EEE and EEI, the consumption-based inventory is based on total consumption—intermediate and final—using bilateral trade data. If using the full MRIO model a slightly different definition would be used which considers the global emis- sions from final consumption in each region (27). 3. Data The data requirements for a multiregional IOA are consider- able, but most developed countries and many developing countries collect the necessary data. However, converting the country data to a consistent global data set is a considerable task. The Global Trade Analysis Project (GTAP) has constructed the necessary data for the purposes of CGE modeling and this data set can be applied for multiregional IOA. The GTAP provides data for 87 countries and 57 industry sectors covering IOA, trade, protection, energy, and CO2 emissions (37). Version 6 represents the world economy in 2001. We only consider CO2 emissions which covers over 70% of global GHG emissions (38). While the GTAP database has impressive coverage, care needs to be taken with its consistency and accuracy. Generally, original data are supplied by the members of the GTAP in return for free subscription. The data are often from reputable sources such as national statistical offices. Un- fortunately, due to the voluntary nature of data submissions, the data are not always the most recently available. Further, once the original data has been received “[GTAP] make[s] further significant adjustments to ensure that the I-O table matches the external macroeconomic, trade, protection, and energy data” (37). These adjustments (or calibrations) are made for internal consistency in computable general equi- librium modeling and are of unknown magnitude. The key data challenges and adjustments we perform on the GTAP data in preparation for our analysis are described in the Supporting Information. 4. Results 4.1. Emissions Embodied in Trade. Table 1 shows the EEE and EEI for key Annex B and developing countries. The Supporting Information contains the full data set in both absolute and percentage quantities. For each region we show the production-based emissions, fprod r, the consumption- based emissions, fcons r, the percentage EEE, fe r/fprod r, the percentage EEI, fm r/fprod r, the percentage BEET, fBEET r/fprod r, the percentage carbon leakage normalized with respect to the total production-based emissions, f*r/fprod r, and the percentage carbon leakage with respect to the EEI, f*r/fm r. We have cross checked our numbers with another study (39) and found that our values generally lie between their lower and upper bounds (see Supporting Information). Figure 1 gives a graphic representation of the EEE and EEI for the 15 countries in the data set with the highest domestic emissions. Table 1 shows that 5.3 Gt (21.5%) of global CO2 emissions are embodied in international trade. This number increases to 5.7 Gt (23.0%) if all international transportation is allocated to EEE (see Supporting Information). The Annex B countries export 2.8 Gt (18.9%) of their domestic CO2 emissions and the non-Annex B countries export 2.6 Gt (25.3%). For individual countries the EEE can vary considerably. Over half of the countries have more than 25% CO2 EEE with many countries around 50% EEE. The range of values is between 7.4% and 59.7%. This increases to 7.8% and 71.5% if all international transportation is included (see Supporting Information). Due to symmetry, the global EEI is the same as the global EEE. The Annex B countries import 3.6 Gt (24.5%) of their domestic CO2 emissions, while the non-Annex B countries import 1.7 Gt (17.2%). Consequently, Annex B countries are net importers of CO2 emissions and non-Annex B countries are net exporters. For individual countries the CO2 EEI ranges from5.9%(RussianFederation)to219.3%(HongKong).Their are 9 of 87 countries which have an EEI of more than 100% (that is, the CO2 EEI are greater than their domestic emissions). These are generally small, trade-exposed coun- tries. When interpreting the EEI it is important to note that we normalize the EEI (numerator) with the domestic emis- sions (denominator). This implies that if a country has a cleaner electricity mix then its trading partners, then it is likely that it will have a higher value of EEI compared to a country with a dirtier electricity mix. Table 1 also shows the “Balance of Emissions Embodied in Trade” (BEET). Annex B countries are net importers of CO2 emissions, while non-Annex B countries are net export- ers. Some authors have placed emphasis on the BEET in the literature (25), but we feel that care is needed in its interpretation. The tendency is to argue that it is better to export more pollution than you import (positive BEET). From a global climate change perspective we argue that it is more desirable to have production occur where it is environmen- tally preferable and then trade the products internationally. Based on this, some countries may have a large positive or negative BEET depending on their environmental compara- tive advantage (12). Given the possible importance of EET in shaping a countries environmental profile we performed regressions between EET and various country characteristics (see Sup- portingInformation).Wefoundthatgenerallylargecountries— GDP, population, area—have smaller EET. This could be interpreted as large countries being more self-sufficient (11). In terms of the Kyoto Protocol, this suggests that the policy implications of trade will differ depending on the size of the country. Small, trade exposed countries (e.g., Belgium, EEE 45.5%, EEI 89.4%) may face greater economic impacts if climate policy affects trade, compared to a bigger country (e.g., United States, EEE 8.3%, EEI 15.6%) that has a relatively large and independent domestic economy. This suggests that if countries act in coalitions to increase their effective size then they may negate some of the negative consequences of trade. Currently the United States has not ratified the Kyoto Protocol (Croatia ratified May 2007 and Australia ratified VOL. 42, NO. 5, 2008 / ENVIRONMENTAL SCIENCE & TECHNOLOGY 9 1403
  • 4. December 2007). Since the United States represents around one-third of Annex B emissions (38) the Annex B EET varies substantially. Table 2 shows that the ratified countries are significantlymoretradeexposedthentheUnitedStates,Table 1. The United States (8) and, previously Australia (9), both cited competitiveness concerns as their rationale for not ratifying the Kyoto Protocol. Based on EET arguments, our results suggest that the United States and Australia have considerably less competitiveness concerns compared to many other Annex B countries. 4.2. Carbon Leakage. If an international climate regime has limited participation, such as in the Kyoto Protocol, the problem of carbon leakage arises. Increased carbon leakage can be caused by two factors. First, industries close down in a participating country and migrate to a nonparticipating country with lax environmental regulations (strong Pollution Haven Hypothesis, PHH). Evidence for the strong PHH is poor (29, 30). Second, increased consumption in a partici- pating country is met by increased production in a non- participating country (weak PHH) (13). Given dynamic economic development the weak PHH would be sufficient tocausesubstantialconcernsfortheeffectivenessofaclimate regime with limited participation. Table 1 shows the carbon leakage from Annex B countries for CO2 in 2001, and Figure 2 gives a graphical representation for key countries. We use two measures of carbon leakage. The first gives the carbon leakage compared to total domestic emissions which indicates the magnitude of the leakage. The second measure (shown in brackets below), normalizes carbon leakage relative to EEI which indicates the share of EEI coming from non-Annex B countries and is a maximum of 100%. We estimate the carbon leakage from the Kyoto Protocol for CO2 as 10.8% (44.3%). The leakage varies considerably among countries. It is as high as 29.4% (32.9%) for Belgium and decreases to 2.7% (46.6%) for the Russian Federation. The general trend is for countries with high EEI to have high carbon leakage, although geographic location is important. For instance, Japan and the United States are located far away from other Annex B countries and so normalized to their EEI they have high carbon leakage (68.5% and 61.7%, respectively). On the other hand, countries within the EU have high absolute carbon leakage, but since most TABLE 1. Emissions Embodied in Trade for Selected Countries (Complete List in Supporting Information)a embodied emissions carbon leakage production Mt CO2 consumption Mt CO2 exports % imports % BEET % total % share % United States 6006.9 6445.8 8.3 15.6 -7.3 9.6 61.7 Russian Federation 1502.8 1178.0 27.5 5.9 21.6 2.7 46.6 Japan 1291.0 1488.8 14.5 29.8 -15.3 20.4 68.5 Germany 892.2 1032.1 25.3 41.0 -15.7 13.7 33.4 United Kingdom 618.6 721.3 21.3 37.9 -16.6 14.5 38.2 Canada 547.7 532.2 31.7 28.8 2.8 7.7 26.7 France 509.9 591.9 22.7 38.8 -16.1 12.8 33.0 Italy 475.1 547.6 26.5 41.8 -15.3 16.4 39.2 Belarus/Ukraine 363.3 314.8 28.5 15.1 13.3 3.1 20.3 Australia 351.6 293.7 31.4 14.9 16.5 8.6 57.6 Poland 309.8 280.6 21.9 12.5 9.4 3.0 24.1 Spain 305.7 336.7 26.4 36.6 -10.1 14.5 39.8 Netherlands 204.5 243.4 39.1 58.1 -19.0 21.1 36.3 Belgium 126.4 181.9 45.5 89.4 -43.9 29.4 32.9 Czech Republic 117.4 99.8 40.2 25.3 14.9 4.5 17.7 Greece 101.4 107.3 29.6 35.5 -5.8 14.8 41.8 Finland 94.9 86.3 44.6 35.5 9.1 6.3 17.7 Denmark 74.8 85.0 34.1 47.8 -13.7 13.0 27.2 Portugal 70.0 79.7 25.5 39.4 -13.9 10.7 27.2 Sweden 59.7 83.4 34.1 73.7 -39.7 18.1 24.5 Rest of Annex B 593.1 708.7 34.0 53.5 -19.5 12.7 23.7 Annex B 14616.7 15438.9 18.9 24.5 -5.6 10.8 44.3 China 3289.2 2703.7 24.4 6.6 17.8 3.2 48.2 Rest of Middle East 1199.9 1042.2 28.2 15.1 13.1 8.7 57.8 India 1024.8 953.9 13.1 6.2 6.9 4.3 69.7 Korea 397.7 443.1 27.6 39.1 -11.4 23.1 59.2 Mexico 389.9 407.5 19.4 23.9 -4.5 5.9 24.8 Rest of Former Soviet 350.6 303.8 28.5 15.1 13.3 3.1 20.3 South Africa 323.7 200.2 44.6 6.4 38.2 3.4 52.1 Brazil 321.0 318.5 19.7 18.9 0.8 9.2 48.7 Indonesia 305.4 247.3 31.4 12.4 19.0 7.9 64.3 Taiwan 247.9 240.2 40.0 36.9 3.1 20.2 54.8 Turkey 196.3 188.0 27.5 23.3 4.2 8.6 36.9 Thailand 178.7 154.3 41.8 28.1 13.7 16.6 59.2 Venezuela 155.8 124.0 29.3 8.9 20.4 4.7 53.2 Argentina 120.4 118.4 18.4 16.7 1.7 9.8 58.5 Malaysia 116.8 93.3 59.7 39.5 20.1 23.5 59.6 Rest of non-Annex B 1520.9 1778.4 22.3 39.3 -16.9 26.0 66.3 Non-Annex B 10138.9 9316.7 25.3 17.2 8.1 9.7 56.3 Total 24755.6 24755.6 21.5 21.5 0.0 10.4 48.2 a The first columns show the production-based and consumption-based emission inventories. The EEE, EEI, and BEET are expressed as a percentage of the production-based emissions. The carbon leakage is expressed as a percentage of the production-based emissions (first column) and EEI (second column). Production-based totals differ from UNFCCC values since we allocate emissions according to economic activity and not territory (see text). 1404 9 ENVIRONMENTAL SCIENCE & TECHNOLOGY / VOL. 42, NO. 5, 2008
  • 5. of the trade is with surrounding Annex B countries their carbon leakage normalized to total EEI is low. 4.3. Production versus Consumption Inventories. The current approach to construct GHG emission inventories is to use national borders as a system boundary. Due to international trade, this production-based approach does not reflect what a country consumes. Some authors have argued that GHG inventories should be based on consump- tion, mainly to circumvent issues with carbon leakage (24, 25, 12). A GHG inventory based on consumption is compiled by taking the production-based GHG inventory, adding the EEI and subtracting the EEE (eq 9). Since the consumption-based approach considers the environmental pressures arising from a product it can be considered as a generalization of life-cycle assessment to the aggregated consumption of a country and is similar conceptually to the ecological footprint (27). Table 1 shows the production-based and consumption- based GHG inventories for 2001. We do not compare with the UNFCCC territorial-based GHG inventories since, first, we allocate emission by economic activity and not territory, and second, the GTAP emissions data are less accurate makingcomparisonsmisleading.Globallythetotalemissions from consumption and production are the same. However, theallocationamongcountriesvariesdependingontheBEET. If we consider Annex B countries then the emissions coverage is822MtCO2 greater(5.6%)basedonconsumptioncompared toproduction.ThisreflectsthenegativeBEETbetweenAnnex B and non-Annex B countries. For non-Annex B countries the consumption-based CO2 emissions are 822 Mt (-8.1%) lower compared to production. A distinct advantage of the consumption-based inventories is that they eliminate carbon leakage, as all emissions associated with consumption are connected to the consuming country. Of the 35 Annex B countries in our data set, only 9 have lower emissions based on consumption rather than produc- tion. These nine countries generally have large exports of natural resources (e.g., Australia, Canada, Poland, Russian Federation, and so on). The remaining countries have increased reported emissions, indicating that in terms of CO2 they consume more than they produce. Most EU countries have a large increase in emissions with consump- tion, particularly the smaller countries as they are highly dependent on trade. For the EU27 as a whole there is a 564 Mt CO2 (12.8%) increase in emissions using a consumption- based approach. The United States has a 439 Mt (7.3%) increase and this is rapidly increasing over time (3). To put these magnitudes into context, a country emitting 500 Mt CO2 annually would be the tenth biggest emitter in the database. 5. Discussion Our results highlight that there are considerable embodied flows of anthropogenic carbon in international trade. We found a total of over 5.3 Gt of CO2 emissions embodied in international trade flows, and Annex B countries were found to be net imports of CO2 emissions. As a percentage of production-basedemissionswefoundconsiderablevariation in the EET and this relates back to various country charac- teristics such as size variables and geographic location. We found the carbon leakage from non-Annex B to Annex B countries was heavily dependent on geographic location. In terms of policy we claim that a high share of EEE affects competitivenessandhenceparticipationinbindingemission reductions since deep emissions cuts would ultimately affect export industries. This effect is greater for small and trade- exposed countries. While it is desirable for countries to clean up production, it is not necessarily desirable for them to stop producing and to shift production elsewhere. As long as there is trade some countries will specialize in pollution- intensive production. In this regard, the challenge for policy is to ensure that countries that specialize in pollution- intensive exports do so with clean technology, rather than moving production elsewhere (assuming production can be relocated) or not taking part in a global climate regime. With limited participation to binding commitments, EEI can significantly undermine the effectiveness of the Kyoto Protocol through carbon leakage. This is arguably already an FIGURE 1. Percentage EEE and EEI compared to total production-based emissions for selected countries. TABLE 2. Emissions Embodied in Trade for the Ratified Annex B Countries (As of December 2007 the US was the only non-ratified Annex B country) embodied emissions production Mt CO2 consumption Mt CO2 exports % imports % BEET % Annex B 14616.7 15438.9 18.9 24.5 -5.6 ratified 8609.8 8993.1 26.2 30.7 -4.5 U.S. 6006.9 6445.8 8.3 15.6 -7.3 non-Annex B 10138.9 9316.7 25.3 17.2 8.1 total 24755.6 24755.6 21.5 21.5 0.0 VOL. 42, NO. 5, 2008 / ENVIRONMENTAL SCIENCE & TECHNOLOGY 9 1405
  • 6. issue in the Kyoto Protocol where the ratified Annex B countries only account for one-third of global GHG emissions (38). Further, from 1990 to 2006 global CO2 emissions have increased by 35% (31), even though Annex B countries are still on target for a 5% reduction in 1990 GHG emissions by 2008–2012 (40). This highlights a major challenge in the Kyoto framework. To achieve global coverage and avoid carbon leakage high participation is needed, but this runs the risk of reducing effectiveness to encourage participation (41). We claim these issues are inseparable from international trade. Within the context of the Kyoto Policy one way to reduce the impact of trade on individual countries may be to encouragecoalitionformation(42).TheEETisgenerallylower for a coalition compared to individual members of the coalition and this may reduce competitiveness concerns and encourage participation. As an example, within the European Communities (EC)—EU15 in the Kyoto Protocol—a signifi- cant share of the EET are between EC members and so the EET of individual countries are larger and more variable compared to the EC as a whole, Figure 3. The coalition limits trade impacts to products and services that leave the EC. It is also possible that groupings of countries with similar environmental objectives could form coalitions with binding commitments;seeSupportingInformationforexampleswith the Asia-Pacific Partnership on Clean Development and Climate (AP6), Association of South East Asian Nations (ASEAN), and the South American Community of Nations (CSN). A further advantage of regional approaches is that many geo-political and economic organizations are already well-established and many of these bodies have already implemented environmental initiatives. Negotiations among regions with established dialogue and policies may face fewer political obstacles and may be a more effective method of designing an optimal global framework (42). Anotherapproachtoreducetheimpactoftradeonclimate policy is to adjust emission inventories for trade. Currently, emission inventories are production-based and this causes aseparationbetweenacountry’sconsumptionandtheglobal production system. Arguably, it is this separation that causes the competitiveness concerns in the Kyoto Protocol. With consumption-based emission inventories consistency is returned between a country’s consumption (which occurs domestically) and the production system required for the consumption (which occurs globally). Consumption-based inventories eliminate carbon leakage and encourage mitiga- tion to occur where the costs are lowest (16, 12). In the very least, trade-adjusted emission inventories may offer a more systematic approach for allocating differentiated commit- ments (43, 44) if the Kyoto Protocol structure is retained post-2012. Another interesting feature of consumption-based in- ventories in the context of the Kyoto Protocol is the connection with Border Tax Adjustments (BTA). BTA have been suggested as a way of addressing competitiveness concerns and encouraging participation (20–23). BTA are related to consumption-based inventories in two ways. First, since the consumption-based inventory includes a share of emissions from trading partners it indirectly places a cost of carbon in those trading partners. Second, the methodology used to construct consumption-based inventories is also a consistent method to determine the value of border taxes for aggregated sectors. Asnegotiationsforapost-Kyotoclimateprotocolintensify, it is important to not only strive for participation from developing countries, but also to improve the structure of the Kyoto Protocol. Arguably, the Kyoto Protocol has many good features which should remain, but small improvements may greatly increase its effectiveness (44). One potential hole in the Kyoto Protocol is that global emissions can seemingly increase unabated despite emissions reductions in Annex B countries (40). While the Kyoto Protocol may be hailed as a success in international political negotiations, it is yet to be seen whether it will be successful in meeting its environ- mentalgoals.Inthisarticle,wehavearguedthatinternational trade underlies many of the debated issues in the Kyoto Protocol—economic costs, competitiveness, participation, carbon leakage—and trade issues should play a much stronger role in post-Kyoto negotiations. Acknowledgments This research was funded by the Research Council of Norway through contract 139853 and by the rector of NTNU. We thank the reviewers for helpful contributions. Supporting Information Available Supplementary Methods, Data, Comparisons, Results, and Discussion; the complete list of all 87 countries analyzed shown in both absolute and percentage terms; three ad- ditional figures on coalition formation. This information is availablefreeofchargeviatheInternetathttp://pubs.acs.org. Literature Cited (1) Feenstra, R. C. Advanced International Trade: Theory and Evidence; Princeton University Press: Princeton, NJ, 2003. FIGURE 2. EEI of selected countries showing the EEI from Annex B countries and non-Annex B countries (carbon leakage). Relative to total EEI, EU countries have a larger share of EEI originating in Annex B countries since EU countries are surrounded by other Annex B countries. The carbon leakage for non-Annex B countries is defined the same as for Annex B countries. FIGURE 3. EEE and EEI of selected EC members showing the EET originating inside the coalition (left bar) and outside the coalition (right bar). Generally, the EET are reduced if countries act in a coalition since only the EET originating outside the coalition is considered. 1406 9 ENVIRONMENTAL SCIENCE & TECHNOLOGY / VOL. 42, NO. 5, 2008
  • 7. (2) Wiedmann, T.; Lenzen, M.; Turner, K.; Barrett, J. Examining the global environmental impact of regional consumption activities - Part 2: Review of input-output models for the assessment of environmental impacts embodied in trade. Ecol. Econ. 2007, 61, 15–26. (3) Weber, C.; Matthews, H. S. Embodied Environmental Emissions in U.S. International Trade, 1997–2004. Environ. Sci. Technol. 2007, 41 (14), 4875–4881. (4) Hoekstra, A. Y.; Hung, P. Q. Globalisation of water resources: International virtual water flows in relation to crop trade. Global Environ. Change 2005, 15 (1), 45–56. (5) Hubacek, K.; Giljum, S. Applying physical input-output analysis to estimate land appropriation (ecological footprints) of in- ternational trade activities. Ecol. Econ. 2003, 44 (1), 137–151. (6) Müller, D. B.; Wang, T.; Duval, B.; Graedel, T. E. Exploring the engine of anthropogenic iron cycles. Proc. Natl. Acad. Sci. 2006, 103 (44), 16111–16116. (7) Mayer, A. L.; Kauppi, P. E.; Angelstam, P. K.; Zhang, Y.; Tikka, P. M. Importing timber, exporting ecological impact. Science 2005, 308, 359–360. (8) Bush, G. W. Letter from the President to Senators Hagel, Helms, Craig,andRoberts;TheWhiteHouse:Washington,DC,13March 2001. (9) Hansard No. 18. Wednesday, 6 December 2006, Commonwealth of Australia, 2006. (10) Grubb, M.; Neuhoff, K. Allocation and competitiveness in the EU emissions trading scheme: policy overview. Climate Policy 2006, 6, 7–30. (11) Krugman, P. Competitiveness: A dangerous obsession. Foreign Affairs 1994, 73 (2), 28–44. (12) Peters, G. P.; Hertwich, E. G. Post-Kyoto greenhouse gas inventories: Production versus consumption. Climatic Change 2008, 86 (1–2), 51–66. (13) Rothman, D. S. Environmental Kuznets Curves—real progress or passing the buck? A case for consumption-based approaches. Ecol. Econ. 1998, 25, 177–194. (14) Streets, D. G.; Yu, C.; Bergin, M. H.; Wang, X.; Carmichael, G. R. Modeling study of air pollution due to the manufacture of export goods in China’s Pearl River Delta. Environ. Sci. Technol. 2006, 40 (7), 2099–2107. (15) Peters,G.P.;Weber,C.L.;Guan,D.;Hubacek,K.China’sgrowing CO2 emissions - a race between increasing consumption and efficiency gains. Environ. Sci. Technol. 2007, 41 (17), 5939–5944. (16) Peters, G. P.; Hertwich, E. G. Structural analysis of international trade: Environmental impacts of Norway. Econ. Syst. Res. 2006, 18 (2), 155–181. (17) Wara, M. Is the global carbon market working? Nature 2007, 445, 595–596. (18) Aldy, J. E.; Barrett, S.; Stavins, R. N. Thirteen plus one: A comparisonofglobalclimatepolicyarchitectures.ClimatePolicy 2003, 3, 373–397. (19) Bodansky, D.; Chou, S.; Jorge-Tresolini, C. International Climate Efforts Beyond 2012: A Survey of Approaches; Pew Center on Global Climate Change: Arlington, VA, 2004. (20) Aldy, J. E.; Orszag, P. R.; Stiglitz, J. E. Climate change: An agenda for global collective action. Prepared for the conference on “The Timing of Climate Change Policies”; Pew Center on Global Climate Change: Arlington, VA, 2001. (21) Ismer, R.; Neuhoff, K. Border tax adjustments: A feasible way to address nonparticipation in emission trading; Working Papers in Economics CWPE 0409; Department of Applied Economics, University of Cambridge: Cambridge, UK, 2004. (22) de Cendra, J. Can emissions trading schemes be coupled with border tax adjustments? An analysis vis-á-vis WTO law. Rev. Eur. Commun. Int. Environ. Law 2006, 15 (2), 131–145. (23) Pauwelyn, J. U.S. federal climate policy and competitiveness concerns: The limits and options of international trade law; NI WP07-02;NicholasInstituteforEnvironmentalPolicySolutions, Duke University: Durham, NC, 2007. (24) Kondo, Y.; Moriguchi, Y.; Shimizu, H. CO2 emissions in Japan: Influences of imports and exports. Appl. Energy 1998, 59 (2–3), 163–174. (25) Munksgaard, J.; Pedersen, K. A. CO2 accounts for open economies: Producer or consumer responsibility. EnergyPolicy 2001, 29, 327–334. (26) Leontief, W. Environmental repercussions and the economic structure: An input-output approach. Rev. Econ. Statistics 1970, 52 (3), 262–271. (27) Peters, G. P. From Production-Based to Consumption-Based National Emission Inventories . Ecol. Econ. (published online: doi:10.1016/j.ecolecon.2007.10.014). (28) IPCC.ClimateChange2007:Mitigation;ContributionofWorking Group III to the Fourth Assessment Report of the Intergov- ernmental Panel on Climate Change; Metz, B., Davidson, O. R., Bosch, P. R., Dave, R., Meyer, L. A., Eds.; Cambridge University Press: Cambridge, UK/New York, 2007. (29) Cole, M. A.; Elliott, R. J. R.; Shimamoto, K. Why the grass is not always greener: the competing effects of environmental regula- tions and factor intensities on US specialization. Ecol. Econ. 2005, 54, 95–109. (30) Spatareanu, M. Searching for pollution havens: The impact of environmental regulations on foreign direct investment. J. Environ. Devel. 2007, 16 (2), 161–182. (31) MNP. China now no. 1 in CO2 emissions; USA in second position; ClimateChangeDosier,NetherlandsEnvironmentalAssessment Agency, 2007. (32) Eder, P.; Narodoslawsky, M. What environmental pressures are a region’s industries responsible for? A method of analysis with descriptive indices and input-output models. J. Environ. Devel. 1999, 29, 359–374. (33) IPCC. Revised 1996 IPCC Guidelines for National Greenhouse GasInventories(3volumes);IntergovernmentalPanelonClimate Change, 1996. (34) United Nations. System of National Accounts 1993; United Nations, 1993. (35) deHaan,M.;Keuning,S.J.Takingtheenvironmentintoaccount: The NAMEA approach. Rev. Income Wealth 1996, 42 (2), 131– 148. (36) GravgårdPedersen,O.;deHaan,M.Thesystemofenvironmental and economic accounts-2003 and the economic relevance of physical flow accounting. J. Ind. Ecol. 2006, 10 (1–2), 19–42. (37) Dimaranan, B. V., Ed. Global Trade, Assistance, and Production: The GTAP 6 Data Base; Center for Global Trade Analysis, Purdue University: West Lafayette, IN, 2006. (38) CAIT. Climate Analysis Indicators Tool (CAIT) Version 4; World Resources Institute: Washington, DC, 2007. (39) Ahmad, N.; Wyckoff, A. Carbon dioxide emissions embodied in international trade of goods; DSTI/DOC(2003)15; Organisation for Economic Co-operation and Development (OECD): Paris, 2003. (40) UNFCCC. Key GHG Data: Greenhouse Gas (GHG) Emissions Data for 1990–2003; United Nations, 2005. (41) Barrett, S.; Stavins, R. Increasing participation and compliance in international climate change agreements. Int. Environ. Agreements: Politics, Law Econ. 2003, 3, 349–376. (42) Victor, D. G.; House, J. C.; Joy, S. A Madisonian approach to climate policy. Science 2005, 309, 1820–1821. (43) Babiker, M. H.; Eckaus, R. S. Rethinking the Kyoto emissions targets. Climatic Change 2002, 54, 399–414. (44) Grubb, M. Kyoto and the future of international climate change responses: From here to where. Int. Rev. Environ. Strategies 2004, 5 (1), 15–38. ES072023K VOL. 42, NO. 5, 2008 / ENVIRONMENTAL SCIENCE & TECHNOLOGY 9 1407