1. Assumptions:
homogeneous surface waters,
mixed layer is deeper than SD
Based on the theory of Secchi disc (Tyler, 1968)
where is the photopic luminosity function, and
is a measurement conditions factor (dimensionless)
Influence of optically active substances on the light field
in inland waters in terms of Secchi depths
*M. Terrel・T. Fukushima・B. Matsushita
Graduate School of Life and Environmental Sciences, University of Tsukuba, Japan
Overview
We compare two predictive models for Secchi
depths, that quantify the influence of optical active
substances on the light field. The models were
developed and tested for long-term datasets of two
lakes with diverse morphological and limnological
attributes.
Introduction
Optically active substances (OAS): Chlorophyll-a
(Chl-a), Tripton (Tr), Dissolved organic matter
(DOC), and water itself.
Secchi depth (SD) is the most straightforward
index to evaluate light penetration in aquatic
ecosystems (Wetzel, 2001).
Previous studies related SD with OAS by using two
approaches: a widely used empirical model and a
model based on water optics theory; the later had a
further attempt because many considerations
should be taken in order to prepare the input
parameters for the model.
The objectives of our study include:
to compare empirical and semi-analytical
models used for the long-term prediction of SD-in
two lakes which offer a broad range of optical
conditions within their water bodies;
to elucidate the most influential substance that
determine the light field in the two lakes by
quantifying each OAS contribution to SD.
Literature cited
Wetzel RG (2001) Limnology: Lake and river ecosystems. Academic,
Philadelphia, PA.
Tyler JE (1968) The Secchi disc. Limnol. Oceanogr. 13:1-6
Results
Methodology
Study area
* Please contact mterrelg@ies.life.tsukuba.co.jp for further information
Table 1 - Characteristics of lakes and input data
Conclusions
Both predictive models captured Secchi depths
variability quite good.
Only semi-analytical models properly help to
understand how the water component affects the
in-lake light field .
Tripton followed by Chl-a have been identified to
be the most influential components that control the
light regime in the two lakes.
The weak non-linearity encountered in the semi-
analytical model gives a support to the widely used
empirical models.
Lake MODEL Chl-a coeff.
(μg-1lm-1)
Tr coeff.
(mg-1lm-1)
DOC coeff.
(mg-1lm-1)
Water
(m-1)
Biwa Empirical a1=0.0150 a2=0.100 a3=0.040 b1=0.05
Semi-analyt. 0.0058 0.130 0.034 0.06
Kasumigaura Empirical a1=0.0080 a2=0.040 a3=0.010 b1=0.68
Semi-analyt. 0.0051 0.101 0.030 0.06
Fig.2. Semi-analytical model flowchart
2) Semi-analytical model
Uniform
OAS conc.
Fig.3. Example of Lake Biwa SIOPs (9-10/11/2009)
Characteristics Lake Biwa northern basin Lake Kasumigaura
Description Mesotrophic, monomictic Eutrophic, polymictic
Surface area (km2) 616 171
Mean depth (m) 45.5 4.0
Long-term
measurements
Database Lake Biwa Environmental
Research Institute (LBERI)
National Institute for
Environmental Studies (NIES)
Period 04/1998-03/2008 04/1988-03/2007
Frequency monthly monthly
N. of stations 28 10
Acknowledgements
This research was supported by “Global Environment Research Fund
by the Ministry of Environment Japan” B-0909.
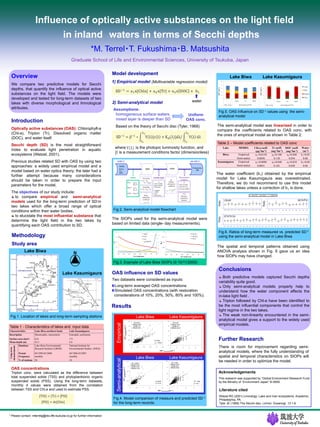
Table 2 – Model coefficients related to OAS conc
Fig.6. Ratios of long-term measured vs. predicted SD-1
using the semi-analytical model in Lake Biwa
Fig.4. Model comparison of measure and predicted SD-1
for the long-term records.
Semi-analyticalEmpirical
Fig.5. OAS influence on SD-1 values using the semi-
analytical model
The SIOPs used for the semi-analytical model were
based on limited data (single- day measurements).
Further Research
There is room for improvement regarding semi-
analytical models, where the fully understanding of
spatial and temporal characteristics on SIOPs will
be needed in order to optimize the model.
The spatial and temporal patterns obtained using
ANOVA analysis shown in Fig. 6 gave us an idea
how SIOPs may have changed.
Lake Biwa Lake Kasumigaura
Fig.1. Location of lakes and long-term sampling stations
Lake Biwa
Lake Kasumigaura
N
Model development
1) Empirical model (Multivariable regression model)
water
Two datasets were considered as inputs:
Long-term averaged OAS concentrations
Simulated OAS concentrations (with restoration
considerations of 10%, 20%, 50%, 80% and 100%).
OAS influence on SD values
The semi-analytical model was linearized in order to
compare the coefficients related to OAS conc. with
the ones of empirical model as shown in Table 2.
Lake Biwa Lake Kasumigaura
Lake Biwa Lake Kasumigaura
OAS concentrations
Tripton conc. were calculated as the difference between
total suspended solids (TSS) and phytoplanktonic organic
suspended solids (PSS). Using the long-term datasets,
monthly d values were obtained from the correlation
between TSS and Chl-a and used to estimate PSS.
The water coefficient (b1) obtained by the empirical
model for Lake Kasumigaura was overestimated.
Therefore, we do not recommend to use this model
for shallow lakes unless a correction of b1 is done.