1. Biological Forum – An International Journal 6(2): 98-109(2014)
ISSN No. (Print): 0975-1130
ISSN No. (Online): 2249-3239
Bioclimatic Niche Model to predict Afghan Pika (Ochotona rufescens)
distribution range in Iran
S. Khaki Sahneha, Z. Nourib, A. Alizadeh Shabanic , M. Ahmadid andM. Dehdar Dargahie
aM. Sc. in Environment, Department of Environment,
College of Natural Resources and Environment, Malayer University, Iran
bM. Sc. in Environment, Department of Environment,
Faculty of Natural Resources, Lahijan Islamic Azad University, Iran
cAssistant Professor, Department of Environmental Sciences,
Faculty of Natural Resources, University of Tehran, I.R. Iran
dM. Sc. in Environment, Department of Environmental Sciences,
Faculty of Natural Resources, University of Tehran, I.R. Iran
eAssistant Professor, Department of Environment,
Faculty of Natural Resources, Lahijan Islamic Azad University, Iran
(Corresponding author: Z. Nouri)
(Received 08 August 2014, Accepted 16 September, 2014)
ABSTRACT: Effective management and protection of wild life population depends to a large part on our
ability to understand and predict species habitat and its relevant evolutions. Therefore, various methods of
habitat modelling which have been increasingly used in wild life management since 1970 are able to provide
useful information on the relationship between species and species habitat. We used a novel method known as
maximum entropy distribution modelling or Maxent for predicting potential suitable habitat for Afghan Pika
(Ochotona rufescens) in Iran Using climatic parameters in fact we predicted the area in which the climate is
suitable for pika to succeed, the results of the present study indicated that some of the most important
climatic factors in habitat suitability and limiting the distribution of Pikas include annual mean temperature
(54.8%), temperature annual range (31.5%), Precipitation of Coldest Quarter (4.8%). In addition, the
performance of the model by the area under receiver-operating characteristic curve (AUC), showed that the
modelling approach used in this study is in excellent yield (average AUC = 0.846; SD = 0.103). Therefore,
using Maxent method and presence dataset, it is possible to model the geographical location of species. The
obtained suitability map significantly explains the dispersal of Pika in Iran and has a good consistency with
other studies done. The method presented in this method is effectively able to predict suitable habitats of
many species of wild life, especially the species subject to extinction by a limited number of sampling points.
Keywords: Afghan Pika (Ochotona rufescens), Bioclimatic niche, Habitat modelling, Maxent, climatic perspective,
Iran
2000). Nowadays, species distribution modelling is
INTRODUCTION
extensively used as a tool in the area of ecology and
Nowadays, the protection of the heritage of future
various environmental programs (Bunnell and Johnson
generations is not possible without observing scientific
1974, MacArthur and Wang. 1974). These models show
principles and without careful management plans. The
the relationship between species and the surrounding
critical factor in protecting, identifying and acquiring
environment in the study area. In this regard, climatic
valid knowledge, especially about the habitat
models have a high status, and, in fact, understanding
requirements of species is importance that human
the impact of climate change on wildlife populations is
attaches to a species. Many of the problems and
highly important for the environmental experts and
bottlenecks of wildlife conservation root from lack of
natural resource managers (Root and Schneider, 2006).
understanding of wildlife requirements, including the
Climatic changes can change existing resources and
habitat requirements. Understanding distribution and
suitable habitats for animal species, which in turn it can
ecological needs of habitats is essential to achieve
significantly influence the survival percent of wild life
species conservation. In fact, to determine the nature of
(Hughes, 2000; Schwartz et al., 2006). There are a
distribution and determinants of species dispersion is
myriad of methods for modelling and prediction of
the working foundation of an ecologist (Elith and
favorable species habitats (Gray, 1842, Guisan and
Leathwick, 2009; Guisan and Thuiller, 2005).
Thuiller, 2005, Wei-Dong and Smith, 2005). In this
Probability distribution models can create a vision
study, we use the maximum entropy method Maxent to
indicating the impact of different factors on the
model Pika's favorable habitat in Iran by using climate
occurrence and continuation of species with time
parameters.
(Guisan and Zimmermann, 2000, Araujo and Williams,
2. Sahneh, Nouri, Shabani, Ahmadi andDargahi 99
Pika is a species of Lagomorph family and is physically
highly similar to big mouse, except that the tail of Pika
is so small and is almost removed, Pika's ears are highly
round and small, legs are not so high unlike rabbits and
are somehow similar to arms, and their palms is covered
with dense furs, its color is variable and akin to
environment, and it converts from mixed gray and dark
into bright red (Ziaei, 2008). Evidence suggests that
contemporary Pikas within the family Ochotonidae
originated in Asia in the early Oligocene and diversified
into many different genera by the Miocene. At that
time, Pikas were found throughout North America,
Asia, and Africa (Grzimek 2004). Current distribution
of Pika includes northern Holartic which covers North
America, Europe and Asia (Elith et al., 2006); only one
species of the family of Pikas entitled Afghan Pika or
O. rufescens (Ochotona rufescens) have been reported
by Gray in 1842 in the Middle East. Distribution of this
species could be seen in mountainous regions including
Afghanistan, Armenia, south west Turkey and Iran
(Smith et al., 1990; Hoffman et al., 2005). Pika is one
of most important member of their native ecosystem
and play significant roles in the dispersal of vegetation
species by collecting and feeding from various plant
species (Nowak, 1999) and because of limited mobility
caused by climatic changes, Pikas may become subject
to extinction. Pikas are very sensitive to the ambience
and they physiologically are not able to survive in a
thermal degree higher than one threshold (Smith and
Weston, 1990; Verts and Carraway, 1998). Due to such
sensitivity to high temperature and habitat conditions
(Mc Arthur, 1974, Smith and Wang, 1974), Pika can be
regarded as a superior indicator for climatic changes
(Beever et al., 2003; Smith et al., 2004). Therefore,
environmental managers and protection groups must be
equipped with innovative technology and research in
order to protect Pikas with limited mobility against
climatic crises in the contemporary world. One of such
research requirements is to identify the climatic
condition of species current habitats, sensitivities and
climatic limitations in order to predict and study future
variations. One of the most appropriate tools to achieve
such objectives is to model habitats and, in the present
study, to model species climatic niche.
In Iran, so far, Maxent metod has been applied to
model distribution and dispersal of Asian Zebra Doneky
in Touran Reservation Biosphere (Madani, 2008), to
examine the factors influencing on the distribution and
abundance of buck in Hirkani Khiroud Forests
(Ibrahimi, 2011), and also to model wolf's attacks on
man and livestock in Hamadan Province (Behdarvand,
2011). Although many studies have been done on
ecology and habitat of different species of Pika in the
world, there exist limited research on Afghan Pika in
Iran; one example is a MA thesis entitled “a study of
intra-species variations of Pika population” by Mansour
Ali Abadian in 1992. In addition, Cermak et al., (2006)
in a study entitled “notes on Pika family in the Middle
East”, specified some distribution points of Afghan Pika
in Iran. Also, using Binary Logistic Regression
Methods, HEP and Ecological Niche Factor Analysis
(ENFA), Khaki et al., evaluated the habitats of Afghan
Pika in the Lashkar Protected Area (Khaki Sahneh et
al., 2011, Nouri, 2010). However, so far, no study has
been conducted on Pika habitat using Maxent method.
Therefore, the present study mainly aims to model
Afghan Pika habitats using the factor of climate in order
to model Afghan Pika climatic niche in Iran. This study
can pave the way for future studies on climatic
variations on the distribution of this species. Therefore,
while introducing such habitat modelling method, the
present study attempts to achieve two main objectives
including 1) the achievement of the suitability map of
Pika bioclimatic niche, and 2) identification of the most
important climate parameters relevant to the presence of
this species and its climatic limitations in the study area.
We used species occurrence records, GIS geographical
information system, climate parameters, and the
maximum entropy distribution modelling approach
(Phillips et al., 2006) to predict potential the area in
which the climate is suitable for O. rufescens to
succeed.
MATERIAL AND METHODS
A. Species distribution data
In the present study which was done from 2011 to 2012,
considering studies on Pika natural history and the
studies already conducted on its distribution in the
Middle East and Iran, the distribution points of Afghan
Pika in Iran were examined (Blanford, 1876; Murray,
1884; Misonne, 1956; Taghizadeh, 1964; Lay, 1967;
Obuch & Kristín, 2004; Cermak et al., 2006), and
evidence and reports approved by practitioners and
scholars (environment specialists and experts, biologist,
taxidermists, nature photographers, environment
protectors and experiences hunters) were collected.
Finally, 50 points of the presence of Pika in Iran were
recorded.
B. Environmental data
Considering the sensitivity of the stations to climatic
factors which introduces this species as an excellent
indicator for climatic variations (Beever et al., 2003;
Smith et al., 2004), some studies have been done on
other species of Pika which have the same habitat as
Afghan Pika (Smith, 1974; Verts and Carraway 1998,
Smith and Weston 1990; Bruggeman 2010). In addition,
some other habitat modelling studies have been done by
using Maxent method (Kumar et al., 2006; Guisan et
al., 2007a-b).
3. Sahneh, Nouri, Shabani, Ahmadi andDargahi 100
We used as environmental predictors the climatic data
provided by WorldClim (Hijmans et al., 2005).
Nineteen bioclimatic variables (Nix, 1986), biologically
more meaningful to define eco-physiological tolerances
of a species (Graham and Hijmans 2006; Murienne et
al., 2009), were obtained from WorldClim dataset
(Hijmans et al., 2005, http://www.worldclim.org/bioclim.htm.
This climate parameters were 1 km spatial resolution
(Table 1).
Table 1. Climatic variables used to elaborate the models.
Bio_1 = Annual Mean Temperature
Bio_2 = Mean Diurnal Range (Mean of monthly (max temp - min temp))
Bio_3 = Isothermality (P2/P7)*(100)
Bio_4 =Temperature Seasonality (standard deviation*100)
Bio_5 = Max Temperature of Warmest Month
Bio_6 =Min Temperature of Coldest Month
Bio_7 =temperature Annual Range (P5-P6)
Bio_8 =Mean Temperature of Wettest Quarter
Bio_9 =Mean Temperature of Driest Quarter
Bio_10 =Mean Temperature of Warmest Quarter
Bio_11 =Mean Temperature of Coldest Quarter
Bio_12 =Annual Precipitation
Bio_13 =Precipitation of Wettest Month
Bio_14 =Precipitation of Driest Month
Bio_15 =Precipitation of Seasonality (Coefficient of Variation)
Bio_16 =Precipitation of Wettest Quarter
Bio_17 =Precipitation of Driest Quarter
Bio_18 =Precipitation of Warmest Quarter
Bio_19 =Precipitation of Coldest Quarter
C. Modelling Procedure
We used the freely available Maxent software,
version3.1 (http://www.cs.princeton.edu/~schapire/maxent/),
which generates an estimate of probability of presence
of the species that varies from 0 to 1, where 0 being the
lowest and 1 the highest probability.
While working with Maxent software, user is faced by a
number of inputs, outputs and parameters. The inputs
are the same information relevant to the presence of
species and environmental layers. Environmental layers
format (habitat parameters) is ASC. In the present
study, to prepare data layers to enter software Maxent,
Arc GIS 9.3, Conversation Tools were used and the
presence points of the species include 50 points in the
separate Excel file with CSV format were prepared. In
addition, to examine the correlation between the
variables, Multivariant tape wire in Spatial Analysis
Tools, software Arc GIS 9.3 was used. After
performing correlation analysis, out of the variables
with a correlation higher than 0.8, one was selected. 50
occurrence records and 7 climate parameters were used
in Maxent to model potential habitat distribution for O.
rufescens.
D. Modelling with maximum entropy method
Maxent is one of the most common algorithms in
machine learning. The principle of Maxent is related to
the maximum entropy or prximity to reality.
Shannon in 1984 described entropy as a criterion out of
the options involved in the occurrence of an event. The
application of maximum entropy rule for species
distribution is supported by thermodynamic law of
ecological processes. According to the second
thermodynamic rule, in the close systems, the process
goes along the maximum entropy. Therefore, in the
absence of the impact of other confining factors
compared to the limitations imposed on the model,
species geographical distribution tends to the maximum
entropy. Maxent Modelling program was scripted by
Philips et al., (2006). Maxent is regarded as one
presence method for species distribution modelling. The
model is obtained as a species by a number of
environmental layers along with some points relevant to
the presence of species, and the suitability of each cell
in habitat is explained as a function of environmental
variables. The high value of each cell indicates that the
cell has a good condition for that species. The
calculated model expresses the possibility of population
distribution within all cells. The selected distribution is
the part which is closer to reality (maximum entropy)
and it must have the same condition for each variable.
Based on the study by Ausin, the statistical modelling
of species distribution is composed of three parts: 1)
ecological model regarding the used ecological theory
2) the data model regarding data collection 3) the
statistical model regarding statistical theory.
4. Sahneh, Nouri, Shabani, Ahmadi andDargahi 101
Maxent is a statistical model and to obtain the species
distribution, a relation must be established between this
model and two other components of modelling (data
model and ecological model). The important step to
formulate the ecological model of Maxent method is to
use a set of appropriate characteristics which are
regarded as environmental factors limiting species
geographical distribution. The environmental layers are
applied to produce characteristics which limit the
possibility of species distribution. In the model Maxent,
using the points of the presence of species (x1 to xm)
and limited geographical space X (a set of the pixel of
the relevant area) the possibility of unknown
distribution is calculated. The entropy is defined as
follows: H(π) = −Σ π(X)ln π(x)
ln: natural logarithm
X: the set of the area pixels
x: the points of the presence of the species
It is worth mentioning that Maxent is the most capable
modelling method in producing useful results with
sample sizes of less occurrences (Hernandez et al.,
2006; Pearson et al., 2007).
Considering that the number of the presence points of
Pikas in the study is 50, to make better use of the small
sample size of Pika present in Iran, we used the cross-validation
method in Maxent (Behdarvand et al., 2014).
Instead of extracting a training-test dataset from the
data, all of the pika locations were used to build Maxent
model. Pika location were randomly split into 10 folds
containing equal number of occurrences, and training
models were created by eliminating each fold in turn.
The removed fold was then used for testing the model
derived from the remaining training folds. We used the
area under receiver-operating characteristic curve
(AUC), calculated for test folds, to evaluate models
derived from training folds.
5. Sahneh, Nouri, Shabani, Ahmadi andDargahi 102
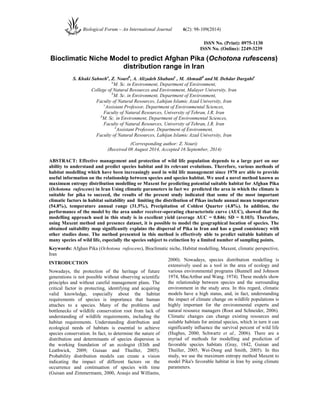
Fig. 1. Predicted map of bioclimatic niche for O. rufescens in Iran : Maps depicting areas in which the climate is
suitable for O. rufescens to succeed and present in Iran from the cross-validated Maxent models a: continuous And
b: reclassified into 5 equal-sized probability classes.
Maxent calculates some thresholds to categorize
continuous probability maps into suitable/unsuitable
classes. This is more important when identifying
suitable habitats and applying management activity is
inevitable (Phillips et al., 2006).
By using cross-validation method for resampling,
Maxent provides a number of thresholds for each cross-validated
fold which will cause ambiguity to choose a
single threshold to categorize the concluding probability
map (Behdarvand et al, 2014).
6. Sahneh, Nouri, Shabani, Ahmadi andDargahi 103
RESULTS
There are various files in Maxent outlet. The Plots
folder contains all the pictures of graphs, maps, and
charts that Maxent creates from the run. Ochotona
rufescens.asc incudes a prediction map by asc format
which could be converted into raster file and then
classified, and Ochotona rufescens.png which is
regarded as the image of distribution prediction.
The prediction map designed by Maxent is a continuous
possibility map which it was categorized into 5 classes
in Arc GIS environment, and we assume that at the
classes with higher ranks, the possibility of the presence
of Pikas is higher. The prediction map shows that the
highest habitat suitability exists in north-eastern Iran,
and this location takes privilege of the maximum points
relevant to the presence of Pikas.
A. Analysis of variable contributions
In this part you will see a table that shows the Analysis
of variable contributions (Table 2). This table shows the
climatic variables used in the model and their percent
predictive contribution of each variable. The higher the
contribution, the more impact that particular variable
has on predicting the occurrence of that species
(Phillips et al., 2006). In this study Annual Mean
Temperature (. bio_1) had the highest predictive
contribution of 54.8% (Table 2).
Table 2: Selected climate parameters and their percent contribution in Maxent model for O. rufescenc species
in Iran.
Percent Source/Reference
contribution
No. Environmental variable
WorldClim; Hijmans et al.
2005
1 Annual Mean Temperature (Bio1, degree C) 54.8
WorldClim; Hijmans et al.
2005
2 Precipitation of Coldest Quarter (Bio19, degree C) 31.5
WorldClim; Hijmans et al.
2005
3 Temperature Annual Range (Bio7, degree C) 4.8
WorldClim; Hijmans et al.
2005
Precipitation of Seasonality (Coefficient of Variation (Bio15, 4.4
degree C)
4
WorldClim; Hijmans et al.
2005
Mean Diurnal Range (Mean of monthly (max temp – min 2.8
temp)) (Bio2 degree C)
5
WorldClim; Hijmans et al.
2005
6 Precipitation of Driest Month (Bio14, degree C) 1.8
WorldClim; Hijmans et al.
2005
7 Isothermality (P2/P7)*(100) (Bio3, degree C) 0
B. Graph of the Jackknife of Regularized Training Gain
The Jackknifing shows the training gain of each
variable if the model was run in isolation, and compares
it to the training gain with all the variables. This is
useful to identify which variables contribute the most
individually (Phillips et al., 2006). In the jackknife
procedure, we calculated the loss in regularized training
gain of models when each variable was sequentially
omitted. We also estimated obtained gain for each
variable when used alone in the model. Subsequently,
by considering the regularized training gains, the most
important variables were determined.
Fig. 2. Results of jackknife evaluations of relative importance of predictor variables for 0. rufescens Maxent model.
7. Sahneh, Nouri, Shabani, Ahmadi andDargahi 104
The Maxent model's internal jackknife test of variable
importance and Analysis of variable contributions
showed that 'Annual Mean Temperature (Bio1, degree
C)', Precipitation of Coldest Quarter (Bio19, degree
C)'and Mean Diurnal Range (Mean of monthly (max
temp - min temp)) (Bio7, degree C) were the three most
important predictors of O. rufescens distribution (Fig. 2,
Table 2).
C. Response curves
These curves show how each environmental variable
affects the Maxent prediction. The curves show how the
logistic prediction changes as each environmental
variable is varied, keeping all other environmental
variables at their average sample value (Phillips et al.,
2006).
Results derived from curves showed that the probability
of the presence of O. rufescens decrease with the
increase in Annual Mean Temperature; but with
increase in Precipitation of Coldest Quarter,
Precipitation of Seasonality, Precipitation of Driest
Month, Temperature Annual Range, Mean Diurnal
Range, it somehow increases.
Fig. 3. Response curves affect the Maxent prediction of 0. rufescens These curves are generated for the most
important variables and show the mean response of the cross-validated models with 10 replicate runs (red) and the
mean±one standard deviation (blue).
D. Area under (ROC) Curve
This is a graph of the area under the Receiver Operating
Characteristic (ROC) Curve or AUC. The AUC values
allow you to easily compare performance of one model
with another, and are useful in evaluating multiple
Maxent models.
An AUC value of 0.5 indicates that the performance of
the model is no better than random, while values closer
to 1.0 indicate better model performance (Phillips et al.,
2006). The average test AUC for the replicate runs is
0.846, and the standard deviation is 0.103.
8. Sahneh, Nouri, Shabani, Ahmadi andDargahi 105
Fig. 4. Area under the (ROC) Curve.
DISCUSSION
As climate can directly influence plant populations,
increased temperature in the current age can change the
distribution of plant species toward higher geographical
latitudes, and in turn, this can lead to the mobilization
and emigration of animal species, especially
herbivorous mammals to supply their required food
(Root et al., 2003). Notably, the population of the
species with limited mobility and habitat range becomes
limited to a special location due to the presence of
geographical and physical hurdles; also it can hinder
any genetic exchange with other populations and so
they become more exposed to extinction risks
(Parmesan, 2006). Pikas as small mammals are more
susceptible to extinction due to their limited mobility
potential caused by climatic variations. In fact, the
results of different studies indicate that the climate is
the most significant factor in shrinking the distribution
rate of Pikas throughout the world. Therefore, using
Maxent modelling method, the present study mainly
aims to determine the optimal bioclimatic niche for
Pikas in Iran and also to specify the climatic limitations
of this species. Notably, the obtained suitability map in
the present study was in a good from consistency with
the distribution of Pika in Iran reported in other studies,
which this shows the significance of climatic
parameters on Pika distribution.
The model obtained from Maxent successfully shows
the climatic characteristics of Pika environment and
climatic factors limiting the species distribution. There
is a direct relationship between some climatic factors
and the presence of the species. The model results
underline the significance of temperature and
precipitation on distribution and selection of Pika
habitat. In fact, considering the results from the present
study, it could be said that the most significant climatic
factor influencing the distribution or paucity of Pikas is
annual mean temperature, which by an increase in this
parameter, habitat suitability will be reduced (Fig. 2,
Table 2).
Smith (1974) believes that when Pikas get exposed to
the temperature over 77°F (25°C) for a couple of hours,
they experience a severe stress due to their fur and it is
even possible to die. Also, the studies done on
American Pika shows that increased temperature has
reduced the agility, increased the sensitivity and
decreased the reproduction rate of this species (Beever
et al., 2003; MacDonald and Brown, 1992). These
results are in a good consistency with the results from
the present study, and the model obtained from the
present study underlines the significant impact of
temperature (Fig. 2, Table 2).
MacArthur and Wang (1974) argued that in temperature
range of 37 to 81°F, there is a negative correlation
between the time that Pikas spend outdoor and
temperature degree. The response curve resulted from
the current study indicate that by an increase in Mean
Diurnal Range and Temperature Annual Range, habitat
suitability first increases and then reduces.
Both very elevated and very low temperatures can
influence reproduction rate of Pika. This is because this
species reproduces mostly in hot months of year (Smith
et al., 1990; Nowak, 1999). Therefore, there is low
possibility of the presence of Pika in the regions with
very low diurnal temperature and hot days, and such
places are not a good habitat for the species.
9. Sahneh, Nouri, Shabani, Ahmadi andDargahi 106
Recent studies indicate that climatic change can
significantly influence the population of Pikas in the
world (Wei-Dong and Smith, 2005; Beever et al. 2003).
Increase in temperature influences Pikas' different
living aspects such as the abundance or paucity of
vegetation, change in the time of forage collection and
change of behavior due to Pika's body varying thermal
regulation.
As Pikas do not experience winter sleeps, they must
store their required food for winter. So they spend a lot
of time in summer and autumn to collect plants. The
main challenge faced by Pikas for collecting plants in
these seasons is high temperature. Therefore, by an
increase in temperature annual range, mean diurnal
range (mean of monthly (max temp-min temp)), the
behavior of plant collection is influenced. During
summer, Pikas have two feeding states; one is direct
feeding from fresh plants (Dearing, 1996). The second
state of feeding is related to plants collection for the use
in winter. By an increase in plants age, their biomass
will be increased, and they produce secondary
intoxicating compositions. However, these can preserve
plant in winter and when plants are dried, they will be
removed (Dearing 1996). So Pikas collect plants at the
peak of their growth and biomass (Huntly, 1987).
Increase in temperature and precipitation can positively
influence the growth of plants and plants achieve their
growth peak sooner, in turn, Pikas can sooner collect
their required plants (Parmesan, 2006). Therefore, other
roles of the factors influencing Pika habitat suitability
include precipitation of coldest quarter, precipitation of
seasonality and precipitation of driest month. It is
expected that by an increase in precipitation rate,
vegetation and food for Pika will be enhanced.
However, excessive precipitation rate also makes plants
achieve sooner their growth peak and so Pikas are not
able to directly use it.
The results of the observation by Ricankova on Alpine
Pika and the study results of Wei-Dong and Smith
(2005) on Ili Pika indicate that precipitation rate can
somehow influence Pika habitat suitability and higher
than that rate can have a negative impact. Considering
the current distribution points of Afghan Pika and
obtained suitability map in Iran (Fig. 1), the lack of
Afghan Pikas on the Caspian Sea, Persian Gulf and
Gulf of Oman and the low suitability of these regions
for Pikas can justify the results from Response Curves
on Precipitation of Driest Month, Precipitation of
Coldest Quarter, and Precipitation of Seasonality.
In fact, excessive precipitation can reduce the
possibility of the presence of Pikas. It must be noted
that it is possible that two parameters annual mean
temperature and precipitation of coldest quarter in a
macro-level and other parameters in regional level
influence Pikas habitat suitability and this issue requires
doing more research.
Overall, it could be concluded that temperature play
significant roles in the distribution of Pika, and this
species is highly sensitive to climatic variations due to
its limited mobility and unique habitats; as climatic
variations, especially increase in temperature is a
potential threat to Pikas, different studies recently have
been done on the condition of Pikas as a species subject
to extinction (Federal Register, 2009). In addition, a
study of exposition of Afghan Pikas to varying
temperatures as the only species of Pikas which are
used as in laboratory (Smith et al., 1990) can be more
significant.
The obtained suitability map (Fig. 1) is able to
significantly justify the distribution of Afghan Pikas in
Iran.
Based on the recordings, the main distribution points of
Afghan Pikas could be categorized into five areas
including 1) Northeast and East Iran including Hezar
Masjed Mountains and Kopet Dag and Binaloud 2)
Southeastern Iran including Taftan and Deh Baraki
Mountains in Kerman 3) central Iran including the
central Alborz and Zagros mountain ranges and
northern part of Kouhroud 4) the length of Alborz from
south eastern Kerman to Iran and Turkey border located
in Bastam in Western Azarbaijan, and 5) central and
eastern part of Alborz (Fig. 1). In fact, the distribution
of Afghan Pikas starts from Southeastern Iran from
Taftan Mountain ranges in Sistan and Balouchestan and
extends from the extreme point of Zagros Mountain
ranges including Kerman and Bastam in the border of
Iran and Turkey.
Another part of the distribution of Afghan Pika which
accounts for main population of Pika in Iran starts from
Eastern Iran and Kopet Dag and Binaloud Mountains
and extends along Alborz to Qazvin province.
Considering the obtained suitability map, these regions
have a high climatic suitability.
Along with the above explanations on the valid
depiction of the Afghan Pika distribution in Iran by the
model, this model has a higher accuracy as well, for
example in some parts of Iran such as Semnan,
Tandoureh in Khorasan and different parts of Southern
Khorasan as the main habitats of Afghan Pikas(Fig. 1).
Considering the resultant climatic suitability map, the
possibility of the presence of the species is higher than
other assumptions and predictions, and such regions
have a better suitability class (1-0.8). This indicates the
higher accuracy of this model in determining the
distribution of Afghan Pika based on the climate
parameter in Iran. Given the model, it is possible to
obtain the relative climatic suitability percent of each
point for Afghan Pikas in Iran, and so to measure the
intensity and weakness of other factors on the
distribution of Pika. The model also shows that Pikas
often live in Iran mountainous areas with cold and
Semiarid weather and this confirms the results of Lay
(1974).
10. Sahneh, Nouri, Shabani, Ahmadi andDargahi 107
Using this model as an appropriate living climate for
Afghan Pika and considering its elevation
displacements, it is possible to examine the role of
climatic changes on the displacement and mobility of
Pikas and to use it as an indicator for climatic
conditions. The results from some studies indicate that
due to climatic changes in some areas, Pikas have
changed their elevation up to 190 m (Beever et al., in
review).
A review of different resources shows that Pikas
basically live in elevated regions and are severely
dependent upon low temperatures and are not
physiologically able to reproduce under the other
conditions (Smith and Weston, 1990; Verts and
Carraway, 1998). In fact, the elevation plays a
modifying role for climatic parameters of Pikas' life.
Species like Pikas with obligate temperature thresholds
will shift their distribution either poleward or upward.
On average, species have been predicted to respond to a
3o C increase in temperature by moving 250 km north
or 500 meters upward in elevation (MacArthur 1972).
Considering the above, it is suggested that, in case of
increase in temperature, the new habitat of Pika in Iran
achieve a better and new modelling and suitability map,
compared to the current suitability map obtained in the
present study. This could be done for other species,
especially the species subject to extinction risks.
It is noteworthy that Areas of a bioclimatic niche can
be empty of the
expected species because:
-It can't get there
-The substrate is wrong
-It can't compete with other species
In addition, as the obtained suitability map
comrhensively covers a large part of Iran, it is possible
that Iran Pikas have different species or sub-species
with a different climatic niche, and the obtained model
is an estimation and mean of this different climatic
niches. Therefore, succeeding studies assume that Iran
Pikas have two or more sub-species with a different
climatic niche.
REFERENCES
Aliabadian, M., J. Darvish, and B. Kiabi. (1996). Study
of intraspecific variation of pika (Ochontona
rufescsns Gray 1842) in Khorasan province
(Ochontonidae- lagomorgha). Iranian Journal of
Biology, 3(3 & 4): 286- 303.
Araujo, M. B., and P. H. Williamz. (2000). Selecting
areas for species persistence using occurrence
data. Biological Conservation, 96: 331-345.
Beever, E.A., P.F. Brussard, and J. Berger. (2003).
Patterns of apparent extirpation among isolated
populations of pikas (Ochotonaprinceps) in the
Great Basin. Journal of Mammalogy, 84: 37-54.
Behdarvand, N., (2011). Modelling of recent wolves
attacks on men and livestck in Hamadan, MA
Thesis, Univeristy of Tehran, P. 120.
Behdarvand, N ., Kaboli, M ., Ahmadi, M ., Nourani E.,
Mahini A. S., and Asadi Aghbolaghi, M. (2014).
Spatial risk model and mitigation implications
for wolf-human conflict in a highly modified
agroecosystem in western Iran. Biological
Conservation. 177: 156-164.
Blanford W. T., (1876). Eastern Persia, an account of
the Journeys of the Persian Boundary
Commission1870-71-72. Volume II. The
Zoology and Geology.London, vii+516 pp, 28
pls.
Bruggeman, J.B. (2010). Pilot study on factors
Affecting Pika population In the north cascades
ecosystem. Beartooth Wildlife Research,
LLC700 Ninth Street. Final report. California
Press, Berkeley.
Bunnell S.D. and Johnson D.R. (1974). Physical factors
affecting pika density and dispersal. Journal
Mammalogy, 55(4): 866-869.
Cermak,S., J, Obuchch. & P., Benda. (2006). Notes on
the genus Ochotona in the Middle
East(Lagomorpha: Ochotonidae). Lynx (Praha),
n. s., 37: 51-66.
Dearing, M.D. (1996). Disparate determinants of
summer and winter diet selection of a generalist
herbivore, Ochotonaprinceps. Oecologia 108:
467-478.Etemad, E., 1963.
Elith, J., and J. R. Leathwick. (2009). Species
distribution models: ecological explanation and
prediction across space and time. Annual
Review of Ecology, Evolution and Systematics,
40: 677-679.
Elith J, Graham CH, Anderson RP, Dudik M, Ferrier S,
Guisan A, Hijmans RJ, Huettmann F, Leathwick
JR, Lehmann A, Li J, Lohmann LG, Loiselle
BA, Manion G, Moritz C, Nakamura M,
Nakazawa Y, Overton JM, Peterson AT, Phillips
SJ, Richardson K, Scachetti- Pereira R, Schapire
RE, Soberon J, Williams S, Wisz MS,
Zimmermann NE (2006). Novel methods
improve prediction of species' distributions from
occurrence data. Ecography, 29: 129-151.
Federal Register. (2009). Endangered and threatened
wildlife and plants; 90-day finding on a petition
to list the American pika as threatened or
endangered with critical habitat. Federal
Register, 74: 21301-21310.
Gray, J.E. (1842). Descriptions of some new Genera
and fifty unrecorded species of Mammalia. Ann.
Mag. Nat. Hist., series, 1,10: 255-267.
11. Sahneh, Nouri, Shabani, Ahmadi andDargahi 108
Grzimek's Animal Life Encyclopedia, (2005). “Afghan
pika” (On-line). Answers.com. Accessed
Hoffman, R., A. Smith, D. Wilson, D. Reeder.
2005. Mammal Species of the World, third
edition. John Hopkins University Press: John
Hopkins University Press.
Guisan A., Graham C.H., Elith J., Huettmann F and the
NCEAS Species Distribution Modelling Group
(2007a). Sensitivity of predictive species
distribution models to change in grain size.
Divers. Distrib. 13: 332-340.
Guisan A., Thuiller W. (2005). Predicting species
distribution: offering more than simple habitat
models. Ecol. Lett. 8: 993-1009.
Guisan A., Thuiller, W. (2005). Predicting species
distribution: offering more than simple habitat
models. Ecol. Lett. 8: 993-1009.
Guisan A., Zimmermann N.E. (2000). Predictive habitat
distribution models in ecology. Ecol. Modell.
135: 147-186.
Guisan A., Zimmermann N.E., Elith J., Graham CH,
Phillips S, Peterson AT (2007b). What matters
for predicting the occurrences of trees:
techniques, data or species' characteristics? Ecol.
Monogr. 77: 615-630.
Hernandez, P.A., Graham, C.H., Master, L.L., Albert,
D.L., (2006). The effect of samle size and
species characteristics on performance of
different species distribution modelling methods.
Ecography, 29, 773-785.
Hijmans R J, Cameron SE, Parra JL, Jones PG, Jarvis
A. (2005). Very high resolution interpolated
climate surfaces for global land areas. Int. J.
Climatol. 25: 1965-1978.
Hoffman, R., A. Smith, D. Wilson, D. Reeder. 2005.
Mammal Species of the World, third edition.
John Hopkins University Press: John Hopkins
University Press.
Hughes, L. (2000). Biological consequences of global
warming: is the signal already apparent? Trends
in Ecology and Evolution, 15: 56-61.
Huntly, N.J. (1987). Influence of refuging consumers
(Pikas: Ochotona princeps) on subalpine
meadow vegetation. Ecology, 68: 274-283.
Ibrahimi, H., (2011). A study of the factors influencing
distribution and abunadnce of buck in Hirkani-
Khiroud Forests. MA Thesis, Univeristy of
Tehran, Environment Department.
Khaki Sahneh, S., Alizadeh Shaebani, A., Mirsanjari,
M., Kaboli, M., Nouri, Z., Fatahi, B., (2011). An
evaluation of Afghan Pika (Ochotona rufescens)
Habitats using pair-wise rational regression
methods and HEP (case study: Lashkar
Protetcted Area in Hamadan), Animal
Environemnt, 10-1(3) 3.
Kumar, S., Stohlgren, T.J., Chong G.W. (2006). Spatial
heterogeneity influences native and nonnative
plant species richness. Ecol. 87: 3186-3199.
Lay D.M., (1967). A study of the mammals of Iran
resulting from the Street Expedition of 1962-63.
Fieldiana Zool., 54: 1-282.
MacArthur, R.A., and L.C.H. Wang. (1974). Behavioral
thermoregulation in the pika, Ochotonaprinceps:
a field study using radio-telemetry. Canadian
Journal of Zoology, 52: 353-358.
MacDonald,K. and J. Brown. (1992). Using montane
mammals to model extinctions due to global
change. Conservation Biology, 6: 409-415.
Madani, N., (2008). The modelling of distribution of
Asian zebra in Touran Reservation, MA Thesis,
University of Tehran, P.82.
Misonne X., (1956). Notes sur les Ochotones de l'Iran.
Bull. Inst. Roy.Sci. Natur. Belg., 32(54): 1-7.
Murienne, J., Guilbert, E. and Grandcolas, P., (2009).
Species' diversity in the New Caledonian
endemic genera Cephalidiosus and Nobarnus
Insecta: Heteroptera: Tingidae, an approach
using phylogeny and species' distribution
modelling. Bot. J. Linn. Soc. 97: 177-184.
Murray J.A., (1884). Additions to the present
Knowledge of the Vertebrate Zoology of Persia.
Ann. Mag. Natur. Hist., ser. 5, 14: 97-106.
Nix, H.A. (1986). A biogeographic analysis of
Australian Elapid snakes. In: Longmore R
(Editor), Australian Flora and Fauna Series, 8: 4-
15.
Nouri, Z., (2010). Modelling of Pika habitat suitability
by ENFA method (case study: Lashkar Protected
Area in Hamadan), MA Thesis, Islamic Azad
University of Lahijan, P. 54.
Nowak, R. (1999). Walker's Mammals of the World,
Sixth Edition. Baltimore and London: The John
Hopkins University Press.
Obuch, J. and Krištín, A., (2004). Prey composition of
the little owl Athenenoctuain an arid zone
(Egypt, Syria, Iran). Folia Zool., 53: 65-79.
October 19, 2006 at
http://www.answers.com/topic/afghan-pika.
Parmesan, C. (2006). Ecological and evolutionary
responses to recent climate change. Annual
Review of Ecology, Evolution, and Systematics.
37: 637-669.
Pearson, R.G., Raxworthy, C.J., Nakamura, M.,
Townsend Peterson, A., (2007). Predicting
species distributions from small numbers of
occurrence records: a test case using cryptic
geckos in Madagascar. J. Biogeogr. 34, 102-117.
Phillips, S.J., R.P. Anderson, and R.E. Schapire. (2006).
Maximum entropy modelling of species
geographic distributions. Ecological Modelling
190: 231-259.
Root, T.L., J.T. Price, K.R. Hall, S.H. Schneider, C.
Rosenzweig, and J.A. Pounds. (2003).
Fingerprints of global warming on wild animals
and plants. Nature, 421: 57-60.
Schwartz, M.W., L.R. Iverson, A.M. Prasad, S.N.
Matthews, and R.J. O'Connor. (2006). Predicting
extinctions as a result of climate change.
Ecology 87: 1611-1615.
12. Sahneh, Nouri, Shabani, Ahmadi andDargahi 109
Smith, A.T., Formozov, N.A., Hoffmann, R.S.,
Changlin, Z. and Erbajeva, M.A. (1990). Chapter
3: The Pikas. In: J.A. Chapman and J.C. Flux
(eds), Rabbits, Hares and Pikas: Status Survey
and Conservation Action Plan, pp. 14-60. The
World Conservation Union, Gland, Switzerland.
Smith, A.T. (1974). The distribution and dispersal of
pikas: influences of behavior and climate.
Ecology, 55: 1368-1376.
Smith, A.T., and M.L. Weston. (1990). Ochotona
princeps. Mammalian Species 352:1-8.
Smith, A.T., L. Weidong, and D.S. Hik. (20040. Pikas
as harbingers of global warming. Species 41: 4-
5.
Taghizadeh F., (1964). The Harmful Rodents of Iran
and their Control. Ministry of Agriculture,
Tehran, 109 pp (in Farsi, with a summary in
English, paginated separately: 10 pp).
Tarh Abriz Counselling Engineers, (2009). Detailed
feasibility studies of Lashkar Prottected Area in
Hamadan (Physical Resources), Environemnt
Organization.
Verts, B.J. and Carraway, L.N. (1998). Land mammals
of Oregon. University of California Press,
Berkeley.
Wei-Dong, L. and A. Smith. (2005). Dramatic decline
of the threatened Ili pika(Ochotona Iliensis) in
Xinjiang, China. Oryx 39: 30-34. Western
Regional Climate Center.
Wei-Dong, L. and A. Smith. (2005). Dramatic decline
of the threatened Ili pika(Ochotona Iliensis) in
Xinjiang, China. Oryx 39: 30-34. Western
Regional Climate Center.
Wei-Dong, L. and A. Smith. (2005). Dramatic decline
of the threatened Ili pika(Ochotona Iliensis) in
Xinjiang, China. Oryx 39: 30-34. Western
Regional Climate Center.
Ziaei, H, (2008). A desert guide on Iran Mammals;
Environemnt Foudation; Tehran, P. 219.