
Empfohlen
Weitere ähnliche Inhalte
Andere mochten auch
Andere mochten auch (20)
Ähnlich wie Strategy Part 1,2 & 3
Ähnlich wie Strategy Part 1,2 & 3 (20)
Kürzlich hochgeladen
Kürzlich hochgeladen (20)
Strategy Part 1,2 & 3
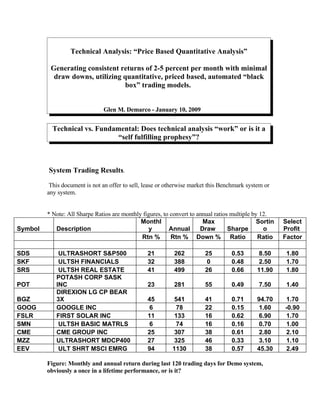
- 1. Technical Analysis: “Price Based Quantitative Analysis” Generating consistent returns of 2-5 percent per month with minimal draw downs, utilizing quantitative, priced based, automated “black box” trading models. Glen M. Demarco - January 10, 2009 Technical vs. Fundamental: Does technical analysis “work” or is it a “self fulfilling prophesy”? System Trading Results. This document is not an offer to sell, lease or otherwise market this Benchmark system or any system. * Note: All Sharpe Ratios are monthly figures, to convert to annual ratios multiple by 12. Monthl Max Sortin Select Symbol Description y Annual Draw Sharpe o Profit Rtn % Rtn % Down % Ratio Ratio Factor SDS ULTRASHORT S&P500 21 262 25 0.53 8.50 1.80 SKF ULTSH FINANCIALS 32 388 0 0.48 2.50 1.70 SRS ULTSH REAL ESTATE 41 499 26 0.66 11.90 1.80 POTASH CORP SASK POT INC 23 281 55 0.49 7.50 1.40 DIREXION LG CP BEAR BGZ 3X 45 541 41 0.71 94.70 1.70 GOOG GOOGLE INC 6 78 22 0.15 1.60 -0.90 FSLR FIRST SOLAR INC 11 133 16 0.62 6.90 1.70 SMN ULTSH BASIC MATRLS 6 74 16 0.16 0.70 1.00 CME CME GROUP INC 25 307 38 0.61 2.80 2.10 MZZ ULTRASHORT MDCP400 27 325 46 0.33 3.10 1.10 EEV ULT SHRT MSCI EMRG 94 1130 38 0.57 45.30 2.49 Figure: Monthly and annual return during last 120 trading days for Demo system, obviously a once in a lifetime performance, or is it?
- 2. Objective of it all – Profits, but with minimal draw downs. Primarily profits, as my focus is trading, fully automated trading of price based quantitative models comprised of commonly used and other customized “technical analysis indicators”. Superior returns with “Maximum Intraday Draw Down”. In the process answer the question: Fundamental vs. Technical - Does technical analysis work? However incomprehensive these results may look, they are 100 percent accurate and will be demonstrated. More important then the absolute return the results are the minimal draw downs. Most importantly results are achieved without any optimization at all, zero curve fitting. Curve fitting is based on altering system variables to “fit” the data. This system was not altered on any of the tested runs, as it’s impossible to curve fit a system to ten different instruments without changing the system in the process. 2
- 3. Introduction – “Technical Analysis” or price based quantitative analysis. Traditional Quantitative Analysis as applied to finance consists of two branches. The first, Mathematical typically develops models for pricing complex derivative products. The second, Statistical, or Statistical Arbitrage (StatArb), develops models to decide what stocks are relatively cheap or expensive based on book value to Price, Price Earnings, trailing earnings to price, or other individual equity or sector correlation analysis. Essentially StatArb is a mean reversion - law of large numbers, based strategy. Technical Analysis can be viewed as third distinct category of traditional quantitative analysis, Price Based Quantitative Analysis, perhaps we should call ourselves,” Price Analysts”. Price, in economic terms, along with supply and demand forms the basic “fundamental” foundation of all economic theory. Like any powerful tool, technical analysis is only as good as the person utilizing it. For example, a rifle in the wrong hands can and has caused many tragedies. The record for a sniper kill was recently made in Afghanistan by an American led sniper team. They killed a terrorist from a distance of 2,430 meters, over 1 ½ miles away. So like the combination of a skilled sniper and rifle, with the appropriate skill and knowledge, price based quantitative technical indicators are enormously profitable, as 3
- 4. measured by monthly and annual returns, maximum drawdown and Sharpe and Sortino Ratios. The main objective of trading is profits. I am told there are many successful very short term scalp/day traders who are consistently profitable. Because of the changing market characteristics, this method presents significant challenges. Even if successful, one is limited to the number of markets that can be traded on any given day and more importantly limited in the amount of capital that can be traded, i.e., few institutional managers are willing to commit capital to an individual traders “streak”, however hot. Given the fee management and incentive fee structure and the amount of capital raised by hedge funds, my objective is to duplicate the results of the most successful hedge funds. Results vary, but given today’s interest rates and recent 33% equity market decline, consistently returning on average 1-2 percent per month non-leveraged will match or outperform the vast majority of successful funds and is the minimum level of success. Is it possible? Any given day on average the S&P will be up or down 1%. There are 240 or so trading days a year that is a potential profit of over 200 percent. Of course it’s impossible to predict intra day tops and bottoms. To paraphrase something I heard George Soros say once in an interview, I’m not looking to catch the high and low, just take a little out of the middle. My goal is to capture at least 10 percent of that 240 percent middle. It has taken me 20 years to figure out, but as far as I’m concerned it’s a done deal. How? Well to use an oversimplified example, it could be as simple as: if the S&P during the first hour of trading is positive the probability that it will continue higher and close out the day up is greater then a reversal. My systems do not look to predict or project price at any time in the future. Rather if X (a bullish indication), Y (another bullish indication) and Z (a third bullish indication) occur, a long trade is taken. Hopefully looking to capture perhaps .5 to 1 percent profit. This indicator based trade taken 5 times a week and being correct 60 percent of the time yields the stated objective 2 plus percent a month. This is overall objective and given the favorable volatility these days it is achievable. We have all heard of the large number of hedge funds that have failed recently. Unless they were long only funds, one really has to wonder and it is most unfortunate they stayed long and watched stocks drop 40% and commodity related stocks, like Steel, Oil Services, etc loose 70+ percent of their value. I realize fundamentals determine price, but technical analysis also has value, simply consulting a daily chart would have provided warning something had changed, dramatically, regardless of one’s opinion. Frankly I gave up having any opinion regarding long and short bias, way to expensive for me. Frequently people ask which is superior: technical or fundamental analysis. It’s been a long time but my economics 101 professor at NYU taught that price in a free market is the direct result of supply and demand forces and therefore the most “fundamental” of principles. Price charts form the basis of any technical study, sounds fundamental to me. I also always wondered where a fundamental trader exits a loosing trade, at zero, after accumulating stock on the way down? I focus my effort on following what the market is doing rather then trying to predict what it may do in the future. 4
- 5. Simply taking an unbiased look at a daily chart to determine what side of these markets to be on would have not only have kept many in business, but they would have been able to capitalize on a one way move down. Potash, US Steel, OIH – Oil Services ETF, in a 6 month period lost 75% of their value. Having a fundamental “opinion” on the market that contradicts what the price is doing is simply ignoring facts. Underlying Trading System Principles Minimize Losses – All the systems are based on trend and volatility. They are designed to be on the right side of any major move. The worse case scenario is an unusually range bound or “sideways” market where small losses will occur. During periods of low market activity trading in that particular instrument, parameters can be adjusted, or trade size can be reduced until volatility returns to normal, or trading can be curtailed. There is no requirement for every system to be “always in”. The lower the Maximum Drawdown (amount of pain) the better, that is my primary selection criteria for “best system”. I prefer a system that makes less net profit but has a lower drawdown, it’s more reliable. Market neutrality – Given that nobody can predict future direction, having a market opinion is dangerous. There is no bullish or bearish bias in any of the systems I have developed. Volatility Based – Unlike price, volatility changes slowly over weeks to months. The Dow did not move from an average range of under 100 points in 2006 to 300 points today overnight and will not move back to 100 in one or two days. More recently the Dow volatility went from an average range of 155 points a day on May 30, 2008 and moved steadily higher to peak at 570 points a day on October 16, 2008, almost 5 months. Trading system parameters can be adjusted with changing market conditions. This does not involve “optimization” of system variables, which is prone to “curve fitting” but rather a minor adjustment of the time intervals used, i.e., the lower the volatility the longer the time frame used. For example a 5 minute interval on the SP500 ETF is less likely yield the same positive returns as a 5 minute interval on Google. 5
- 6. Trading System Background For twenty years part time and ten years full time I have been searching not for the “holy grail” of trading as this doesn’t exist but systems that simply make a consistent profit with minimal draw downs. Typically my sample market data model will be a broad based index. I first began using Computrac the first technical analysis software capable of “back testing” trading strategies. I then started using Tradestation and for the past several years eSignal. There are advantages and disadvantages to both. eSignal requires proficient programming skills but can interface with many brokers for automated execution. Trading system creation using various sources Trading publication – Technical Analysis of Stocks and Commodities, Trader Magazine, Futures Magazine, various books published, internet web sites. There are many thousands of available indicators out there. Converting this vast array of indicators into actual buy sell signals and back testing to determine the results was a multi-year undertaking and took thousands of hours. Trading System Development Methodology: System Creation begins with the Process of Elimination – THOUSANDS TO HUNDREDS TO A PRECIOUS FEW. My current “arsenal” of trading programs consists of over 200 directories and over 5,000 separate indicators and system. Each directory contains from a few to several hundred programs. Each directory represents an individual trading system project. I have researched over 200 over the past ten years. Unfortunately or fortunately, the final outcome of this extensive research was the vast majority of well known indicators/systems, do not generate profitable trade signals on any instrument in any time interval. Of the few useful indicators that I incorporate in system development in and of themselves are still not profitable. MACD, Stochastics, Moving Averages, Directional Movement, Commodity Channel Index, Price Oscillators, Elliott Wave, Fibonacci, Gann, Bollinger Bands, RSI, Donchian, and many more, even if used “properly” are not profitable. 6
- 7. However as “tools” to facilitate trading I have found Directional Movement, Stochastics and Fibonacci retrenchments useful and do incorporate them into several systems, although in unconventional ways. using them as divergence indicators, or as final trade triggers based other favorable custom and proprietary indicator trade setup. For example, one of the most popular indicators is stochastics, created by George Lane. Essentially stochastics is similar to other oscillators such as MACD and RSI, as it oscillates usually on a scale between 0 and 100. Stochastics measures the current close in relation to the high and low range for a given period, typically 10-20 days. Like all technical indicators much is open to interoperation, however most will agree the traditional signal is the crossing of the two stochastic lines; a buy occurs when fast K crosses from below the slower smoothed slow D. My research of stochastics clearly demonstrated that taking a trade signal for every cross over will insure massive losses, especially when used intraday. However, taking the trade on a cross over using a modified version of stochastics and incorporating other proprietary techniques yields a “system” much better then the standard stochastics oscillator. Here is a screen image of an automated trading strategy developed in eSignal’s JavaScript programming language. eSignals’s JavaScript is used to back test trading systems on historical data, build customized indicators, and interface with a brokerage firm for automated trading strategies. In this example the strategy is implemented on symbol SPY, the S&P 500 Equity ETF, hardly the most profitable instrument to trade but familiar to most and the benchmark symbol I use for strategy development. This and any JavaScript strategy can be extensively tested and customized. During development, and in this case for illustration purposes, this strategy “paints” the screen background to easily indicate the buy and sell signals. These signals can be just as easily modified to alert the trader to manually enter a trade; or if a brokerage account is active, automatically send the trade for immediate execution. The green back ground on the chart indicates a long signals and the red back ground indicates a short signal. 7
- 8. Figure: Basic Stochastics Cross Over Trading System: Red (darker shaded background) is Short, Green (lighter shaded background) is Long trade signal, and sounds good on CNBC or in a text book, but never worked for me. The system generated 771 trades and lost $2,228, or over 18% on the initial investment of $13,000 non-leveraged cost for trading 100 shares of ETF (Symbol SPY) for the last 120 days approximately 5 1/2 months ending January 10, 2009. Stochastics Formula A momentum or price velocity indicator that was developed by George C. Lane. It represents a fixed period-to-period moving calculation that is very susceptible to instability and false signals since it is possible for the indicator to fluctuate wildly by simply removing data from the oldest period. K = Lane's Stochastics C = the latest closing price of the stock or contract L = n-period low price of the stock or contract H = n-period high price of the stock or contract n = any number (Lane recommends a range of 5 to 21) SK or %K = three-period simple moving average of K SD or %D = three-period simple moving average of SK Source: The Encyclopedia of Technical Market Indicators, Colby and Meyers 8
- 9. Figure: Equity Curve of Standard Stochastics Crossover System including slippage of $5.00 a trade and $1.00 per trade on 100 shares. All trading results are based on a 100 share position non leveraged position. 9
- 10. Demo System, a modified version of the stochastics system using a custom formula and additional proprietary techniques uncovered during many years of testing. Figure: Screen image with trade signals of a Demo system based on a modified version of the stochastics formula and incorporating other techniques and indicators. 10
- 11. Figure: This is the equity curve of the same Demo trading system. This system is possibly worth trading after some additional enhancements. Right now it’s a rather “dumb” system, minus many of the features usually incorporated into a production system. What was meant as an illustrative example to explain the overall development surprisingly performed much better then I expected as it is less complex then most. The performance was the result of the recent historic level in volatility. The data is for the last 120 trading days, ending January 10, 2009. In 6 months it returned over 57 percent non leveraged trading 100 shares of the SPY ETF minus slippage of 5 cents a share and 1 cent a share commission. My guess is the volatility index will continue at relatively high levels but not at the historic level, so it will make money, but not nearly as much. However, the numbers, I have gone through a painstaking process of guaranteeing the results are real. I am absolutely confident that 2 percent per month is a very conservative estimate. Fortunately, trading volatility based, market neutral strategies allow adjustments to be made gradually to the system parameters, as the market volatility changes. What is the objective? Match or exceed the returns of the largest, most successful hedge funds, which is approximately 2 percent per month. 11
- 12. Figure: This is the graph of the monthly return and maximum draw down percentages for the Demo system. The total return for the 6 month period was over 57 percent, over 100 percent annualized. Obviously the market will not continue to yield such returns, i.e., 5+ percent per month, but 2 percent return per month, our stated objective is a “slam dunk. 12
- 13. Again, this example system was not meant to be pitch for this particular system but rather used for illustration purposes although I have verified that the results are 100 percent accurate. Based on extensive testing what is profitable and worth trading are customized indicators incorporating separate risk and money management algorithms in combination with proprietary indicators I have developed over the past 20 years of research. Figure: Total Trade Analysis illustrating that the Demo system generate a total of 80 trades, 55 percent profitable and the average trade of +$88 on a 100 share SPY position. Average winning trade of $291 and average loosing trade of ($160). 13
- 14. Figure: Strategy Performance Report, 6 month return of 57 % on $13,000 of capital, the cost of purchasing 100 shares of the SPY ETF at the maximum price of $130. 14
- 15. Choosing the “best” system to trade. What is the best system? The system that makes the most money? Being risk averse I favor systems with the lowest maximum intraday drawdown rather then those that net the largest profit. I addition, one has to be very careful to eliminate all “outlining” or exceptional trades. If most of the profit was made on a relatively few number of trades then it’s eliminated from consideration. There are many industry standard measures of “best” system, using Sharpe or Sortino Ratios calculations and several more. I look at the Sharpe and Sortino ratios but usually rely on up trending equity curve (with minimal draw downs) for possible system selection. This forms the basic foundation of a trading system or the “how” to trade. No system makes money on all instruments in all time periods. What other markets yield good results with this “system”? One measure of a system’s value or robustness is how it performs when applied to other instruments. This system, unchanged in any way run on the British Pound for the same period returned 35 percent generating 43 trades with an average trade on a $100K position of $4000 or 400 pips on average. Same Demo System Applied to British Pound Sterling, performs well on Cash FX, Equities, and Financial Commodity Futures. Figure: Trade signals when applied to the British Pound using current data (we’re short!). 15
- 16. Figure: Equity Curve of Demo system run on British Pound Sterling, cash FX 16
- 17. Figure: Strategy Performance Report showing return on capital of over 30% and Sharpe ratio of 1.02. 17
- 18. Figure: Trade Analysis report for Proprietary Trading System applied to the British Pound, average trade over 400 pips, 43 trades in the last 120 days. If I applied the same system to symbols like SKF, the symbol for the US Dow Jones Financial Index ETF or other volatile symbols the returns are significantly better. In general if a system makes money on the S&P Futures or SPY ETF it invariably will make much more on highly liquid, volatile names. What to trade….scanning the symbol universe? The next problem to solve once a possible viable trading system algorithm is identified is what to trade, in what interval, and what time of day to trade it. Equity instrument selection is done using scanners of the entire symbol universe to select possible candidates. The scanner allows filtering based on hundreds of different selection criteria. Ideally to minimize the risk of adverse “news” events the preferred instruments are: FX, Stock Index Futures, Broad Based ETF Indices, and individual equity symbols. Although at times small and mid cap names turn up in the final results of the scanner runs. Generally when individual equity names are chosen, only the most liquid are selected, the average daily volume for the prior ninety days should be at least 1-5 million shares a day, 18
- 19. and typically much higher. The objective is to eventually “size up” and not have our orders impacting price movement to any significant degree. For example a stock that trades 5 million shares a day, a 5,000 share trade represents one tenth of one percent of the average volume and will have no impact on the stock price and positions of 50,000-100,000 minimal impact during periods of high market activity. Curve fitting, curve fitting and more curve fitting, hypothetical results are bogus. Any teenager with a computer these days and Tradestation or eSignal using charting software can eventually come up with some combination of variables and indicators that were customized or curve fitted to the data and make a fortune on the past data. Tradestation has an “optimizer” that will actually do the work for you, i.e., go through millions of variables, i.e., all moving average crossovers, to find the winning combination and produce a wonderful report of all the money you will make. Just don’t order the BMW before the money hits your account as it will disappear fast when you start trading it real time. Will that teenager’s golden goose system make money unchanged, on even one symbol other then the one where all the winning number combinations were tested upon? Highly doubtful. Will the system, unmodified make money on the 10-15 of most highly liquid broad based stock index and sector ETFS’s with a few of the most active household NASDAQ names thrown in for good measure, using the same intraday time interval for each? If it does, offer him a job, better yet offer me one, because that’s exactly what this demo system does. The list of symbols I use in this demo was not filtered from a large list of varied symbols, selecting the most profitable for inclusion in this report. I scan the symbol universe using eSignal for intraday scans or Stockfetcher for evening preparation. The filters used took a year or so to come up with and proprietary but nothing overly sophisticated. I’ve learned some of the price characteristics that yield the most promising trading results and run this filter periodically. Here is a screen shot of the list from today and the trading results using the exact same demo system, unmodified, on exactly the same time interval for each of these symbols. Anyone who thinks that is an easy task to pull off, so did I, ten years ago when I left Goldman Sachs. As I was already “so close”, its taken ten years and a depleted saving’s account to pull off. Better late then never I always say. It’s infinitely more difficult then I ever imagined, or frankly I’d still be at Goldman. This system alone, unchanged will match or beat the vast majority of hedge funds out there today, as is and only gets better with further refining. Those results I will save for an in person demo. 19
- 20. Figure: Customized Stockfetcher execution report of all equity symbols, basically scanning for the most liquid, highest volume and most importantly highest volatile securities. The higher the volatility the better. The “optimization” process, there is none! Optimization, or searching for the best variables which is actually “or curve fitting” is absolutely out of the question. The Demo system used in this report is identical throughout. No variables have been changed for any of the historical tests. Once the system and the candidate list of symbols are determined the “optimization” process begins. In trading system development terminology optimization is synonymous with curve fitting, i.e., checking all the combinations of system variables with the actual price data until a profitable combination is found. Test enough combinations and eventually a profitable combination will be found to have been profitable on past historical data. Rarely if ever will this system show profits in the future. Some “optimization” makes sense. My optimization consists of choosing the best performing symbol/time period combination. There is no guarantee we will be here tomorrow let alone how a given stock will behave. But given the systems are market-neutral and volatility based, the probability that a stock with an average daily range of 5 points will suddenly range 1 point is less then continuing closed to the 90 day average of 5 points, and if that happens we make money. Higher volatility is even better. Because characteristics of markets change adjustments are made not to the underlying principles of the system once determined, but rather the money management component. For example, as volatility decreases, profit targets may be adjusted downward to close out a trade earlier or volatility based trailing stops tightened, etc. 20
- 21. So how did it do on the symbols produced by the Stockfetcher scan? Fortunately or unfortunately the results were stratospheric, off the charts, ridiculous. I considered putting in $1.00 in slippage to bring the results in line with historical values for the sake of credibility, but wanted to be accurate. Again my goal is 2-5% a month with minimal draw downs and cannot over emphasize that there is very little chance recent numbers will ever be reproduced. The markets volatility was “off the charts” literally, historic levels. Monthl Max Sortin Select Symbol Description y Annual Draw Sharpe o Profit Rtn % Rtn % Down % Ratio Ratio Factor SDS ULTRASHORT S&P500 21 262 25 0.53 8.50 1.80 SKF ULTSH FINANCIALS 32 388 0 0.48 2.50 1.70 SRS ULTSH REAL ESTATE 41 499 26 0.66 11.90 1.80 POTASH CORP SASK POT INC 23 281 55 0.49 7.50 1.40 DIREXION LG CP BEAR BGZ 3X 45 541 41 0.71 94.70 1.70 GOOG GOOGLE INC 6 78 22 0.15 1.60 -0.90 FSLR FIRST SOLAR INC 11 133 16 0.62 6.90 1.70 SMN ULTSH BASIC MATRLS 6 74 16 0.16 0.70 1.00 CME CME GROUP INC 25 307 38 0.61 2.80 2.10 MZZ ULTRASHORT MDCP400 27 325 46 0.33 3.10 1.10 EEV ULT SHRT MSCI EMRG 94 1130 38 0.57 45.30 2.49 Figure: Monthly and annual return during last 120 trading days for Demo system, obviously a once in a lifetime performance, or is it? Of course the system made money, the market is in a massive bear market and your system is trading the ultra shorts? The only reason I trade the ultra shorts is for the volatility. Using the SDS for example, the ultra short S&P 500 ETF, in mid July the start of the 120 day trading period, it was trading at $75, yesterday is was also trading at $75, the range during the time period was a low of $61 in September to a high of $133 in mid November. Here are the last 10 trades for the SDS: 21
- 22. Symbol # of % Avg Avg Avg Net Long Short Trades Profit Trade Win Loss Profit Profit Profit SDS 79 51 $125 $503 $262 $9,915 6,068.00 $4,825 SKF 75 52 $344 $1,271 $661 $25,772 14,127.00 $12,558 SRS 77 53 $368 $1,130 $499 $28,370 12,996.00 $15,768 POT 76 49 $120 $765 $491 $9,169 (1,497.00) $11,586 BGZ 29 55 $247 $754 $373 $7,188 3,736.00 $3,777 GOOG 95 40 $115 $1,320 $687 $10,991 (3,977.00) $14,090 FSLR 78 46 $238 $1,169 $559 $18,592 3,423.00 $15,942 SMN 77 45 $136 $763 $386 $10,522 6,062.00 $5,205 CME 78 42 $326 $1,949 $863 $25,468 2,397.00 $21,368 MZZ 83 43 $120 $669 $299 $10,024 5,551.00 $4,883 EEV 71 50 $452 $1,298 $417 $32,125 15,168.00 $17,437 Figure: Trade breakdown for all symbols Potash (POT) and Google (GOOG) shows a negative -$1497 and -$3997 trading from the long side during the time period what happened? The market happened, POT was cut 75 percent went from a high of $215 to a low of $47, and GOOG was cut in half from $500 to a low of $250, tough to make money on the long side so loosing $1497 on 37 long trades or 40 cents a trade in POT and 84 cents on 47 trades in GOOG is understandable. Most of the other symbols are fairly balanced with profit from the long and short side except for FSLR, which went from $300 to $85 and CME a high of $440 to a low of $155. 22
- 23. Figure: Last 10 trades for the SDS, during last 120 days SDS and most of the others symbols made about the same profit on both the long and short side. Except for POT and GOOG, given POT was down 75% and GOOG 50% loosing from the long side is t be expected. When to trade? Once we have the How (the system), the What (the symbol/time period combination) the next problem is the When? One valuable lesson that was derived by sitting in front of the screen for years trying to make money was the importance of time of day. For day trading, 2-3 trades a day, the most profitable time of day is the trade signal that occurs between 10:00 and 11:00am. If I only took one trade a day it would be at this time. The next most profitable time is 3:00-4:00pm. Trading between 12:00 and 1:30 is a lower probability trade and usually only yields positive results when the morning trading session was unusually narrow which does occur perhaps 20 percent of the time. 23
- 24. For longer term swing systems, one trade every few days, the time of day is less important although usually trades are generated during the high activity time periods describes above. After years of testing I have found the most profitable systems trade between 1-3 times per week. This seems to reflect the fact that markets have a tendency to trade in one direction for 2-3 days at a time before retracing a portion of the prior move, typically 25 to 68 percent of the prior move before continuing. Run Prototype and production tuning The final stop in the development process is to run the systems real time during market hours firing the automated trades to the simulated broker account. The purpose is to most importantly validate the profit results from the back test which is run after market hours on historical data. Frequently back testing results which yield excellent profit results are found to be far less profitable when run real time. This discrepancy can be caused by software flaws in the charting package, programmer error, underestimating slippage costs etc. Validating the back testing results is essential and can only be done in real time. In addition, watching a system trade real time often uncovers observations that were missed using historical data, resulting in some stop or profit management replacement. “Market Time Data”, tick charts, constant volume charts, range charts. I also research combining various time intervals, using several correlated symbols to increase the winning trade percentage and using customized time intervals, tick, range, volume etc. All of which can and frequently improve the systems performance and will be covered in another section. 24
- 25. Part 2. Out of sample testing and live trading January 29, 2009 Figure: Screen Image of Demo strategy modified to include a Risk Management algorithm run on out of sample data. Symbol SDS (SP&500 ultra short) trades during the three week time period after Part 1 of this paper was distributed. Today’s date is January 30th, 2009 part one was written on January 10th 2009, part two describes the process of adding risk management algorithms, testing on out of sample data, real time testing and actual trade execution. The purpose of part two is to examine how the systems performed during this 3 week time period. In this case the first “real trade” was profitable; it could have just easily resulted in a loss. The objective was describing the methodology, not touting this system. 25
- 26. However Costly, Risk Management is essential. Surprisingly adding money management algorithms such as stops will often result in a less profitable strategy. Apparently an “always in” strategy enables an earlier entry and this can out weight the advantage of limiting losses via stops placement. Stops in a sense are insurance. Insuring against a potential disaster is essential. Surprisingly stops frequently erode strategy performance but can be viewed as life insurance. Like any insurance policy there is a “premium” cost associated. In the case of this strategy, stops improve the strategy performance. There are a large number of stop algorithms to choose from: fixed percentage, moving average base, dynamic volatility stops, trailing, parabolic, etc. After extensive testing I rely on a method that serves two purposes: limiting risk and protecting profits. Screen image of strategy modified to incorporate money management algorithm, which encompasses the time period since Part 1 was written. On the following screen image for the S&P 500 Ultra short ETF the red labels were added indicating Long and Short signals, LX and SX, labels indicate exiting short and long positions, and the red dots represent a proprietary “trailing stop” algorithm. 26
- 27. Out of Sample Testing - Verify historical back testing results Every system needs to have the historical results verified. The first step is to insure the back testing trade signals and actual report results are the same as those occurring during real time market hours. One has to be completely certain the reported back testing profit and loss figures are accurate. Most trading strategy development programs are accurate if the strategy is coded correctly. However, in order to gauge accuracy and properly factor in slippage, the strategy is tested in real time on our of sample data. Once it is determined that the reports are accurate the out of sample results will determine if the overall strategy results are in line with the back test on historical data. As long as the strategy is not optimized, results should be similar. The more variable permutations, or optimization done the greater the chance that the strategy is “curve fitted”. Optimized strategies rarely if ever produce results on out of sample data. The exact same strategy is being run on each symbol, eliminating any possibility of “optimization”. Figure: Trades generated on out of sample symbol SDS (SP500 Ultra short) during three week period since Part 1 of this paper was distributed. The out of sample results validate the profitability of the strategy. 27
- 28. Figure: Strategy Performance Report for out of sample time period system returned 15 percent during the time period, very much in line with prior 6 months in sample performance results. 28
- 29. Figure: Total trade analysis report for out of sample time period validates in sample historical testing period. 29
- 30. Figure: Equity curve for out of sample time period 30
- 31. Live Trading Begins Initially minimally sized trades will be executed while continuing to further validate trading results prior to increasing position size. The symbols being traded should scale well as the objective is to maximize strategy profitability. The symbols being trades are highly liquid, broad based index and sector ETFs. Compare actual trade execution and eSignal reported execution. Figure: This was the eSignal trade report signaling a long trade at approximately 10:00am at a price of 75.93 am on 1/29/09 and closed at 1/30/09 for a profit of $350 or approximately 5 percent. The execution report produced by my firms front end execution program, HydraTrade, reports the trade, order # 402578 on the INET. INET is the ECN I routed the order to for symbol SDS and the other symbols mentioned in this report. The .02 difference is accounted for by slippage which I specify as .05 for each trade. 31
- 32. 1/29/2009 EEV Ultra Short MSCI Emerging Mrkts ProShares ETF Order Gross Ecn Net Time Id Exchg Liq B/S Qty Price Realized Comm Fee SEC TAF Realized -0.0 10:01:42 402527 INET A B 10 56.54 -565.4 1 2 0 0 -566.38 Overnight Adjustment 565.4 0 565.4 -0.0 Fills: 1 10 0 1 2 0 0 -0.98 MZZ Ultra Short MidCap400 ProShares ETF Order Gross Ecn Net Time Id Exchg Liq B/S Qty Price Realized Comm Fee SEC TAF Realized -0.1 10:01:58 402536 INET A B 10 59.61 -5961 1 9 0 0 -5961.8 Overnight Adjustment 596.1 0 596.1 -0.3 Fills: 2 190 -2.7 2 6 0.08 0.01 -4.43 SDS Ultra Short S&P500 ProShares ETF Order Gross Ecn Net Time Id Exchg Liq B/S Qty Price Realized Comm Fee SEC TAF Realized -0.0 10:04:18 402578 INET A B 10 75.91 -759.1 1 2 0 0 -760.08 Overnight Adjustment 759.1 0 759.1 -0.0 Fills: 1 10 0 1 2 0 0 -0.98 SRS Ultra Short Real Estate ProShares ETF Order Gross Ecn Net Time Id Exchg Liq B/S Qty Price Realized Comm Fee SEC TAF Realized -0.0 10:06:09 402635 INET A B 10 51.88 -518.8 1 2 0 0 -519.78 Overnight Adjustment 518.8 0 518.8 -0.0 Fills: 1 10 0 1 2 0 0 -0.98 TZA Direxion Small Cap Bear 3X Shares ETF Order Gross Ecn Net Time Id Exchg Liq B/S Qty Price Realized Comm Fee SEC TAF Realized -0.0 10:05:16 402600 INET A B 10 53.04 -530.4 1 2 0 0 -531.38 Overnight Adjustment 530.4 0 530.4 -0.0 Fills: 1 10 0 1 2 0 0 -0.98 Figure: Clearing broker execution report listing the prior days opening trades. 32
- 33. Figure: Because these trades were executed today, the clearing broker reports will not be available until tomorrow (actually Monday). This is the trade report produced by the HydaTrade front end trade execution. Initially only 10 shares are traded as the system is being validated, even 100 shares in these symbols could result in losses of thousands of dollars. The instruments traded are highly liquid and position sizes of many thousands of shares can be held. Net Net Symbol Open Close Points Pct EEV 56.54 58.24 1.7 3.01% MZZ 59.61 62.48 2.87 4.81% SDS 75.91 79.57 3.66 4.82% SRS 51.88 56.66 4.78 9.21% TZA 53.04 57.66 4.62 8.71% Figure: Actual Profit and Loss calculation taking data from the earlier execution report copied into an excel spreadsheet as reported by execution broker report. Combining Multiple Trading Models – Trend and Counter Trend 33
- 34. Markets typically go through cycles of trending and non-trending periods. Ideally at least two separate models traded simultaneously will smooth out the Equity Curve by limiting draw downs. During time periods of consolidation or “side ways” market movements, characterized by less directionality and volatility. A counter trend system will typically profit during the time period where the trend following system does not. Conversely the counter trending strategy will under perform the trend following system during higher directional and volatility time periods. In addition the counter trending model’s performance can be further enhanced by knowing when to “turn off” or ignore the counter trending time periods. There are a variety of very effective filters for markets that are strongly trending. One technique is through regression analysis using linear regression or least square analysis by calculating the Pearson product-moment correlation coefficient, or Pearson’s R. There are other more reliable techniques available that are incorporated within the quantitative trading models. Figure: Pearson’s R “Trend Strength” Calculation. Determining when a market is trending and when a market is consolidating. This determines the selection of available trading models. 34
- 35. Figure: JavaScript Implementation of Pearson’s R calculation 35
- 36. Figure: Screen Image with trading signals of “Trend Following” model. 36
- 37. Figure: Screen Image of trade signals of “Counter Trend” model. 37
- 38. Figure: Side by side comparison of Trend (left) and Counter Trend (right) daily P&L for last two week periods. 38
- 39. Notice the largest loosing days on the left trend following column dated 1/22/09 a loss of $ -1386 was offset by a gain of $ +2243 in the trend following system. Conversely the largest loosing day for the counter trend strategy was today, 2/04/09 for a loss of $ - 673 which was offset by a gain of $1181 in the trend following system. The over all effect is that the loosing day percentage goes from approximately 50 percent to under 25 percent. 39
- 40. Figure: February 4, 2009 live trading results combining trend and counter trend following systems. 40
- 41. Strategy Parallel Testing Phase Prior to Automating Trading. There is only one way to insure with absolute certainty that a trading model’s results are accurate. Equally important is insuring that there are not and error in sending orders to an automated brokerage account. Sending automated trades for immediate execution to any exchange can entail massive financial liability in the event of programming errors. The system must be traded in real time during market hours in an actual brokerage account. It is critical as an interim step to manually execute the trades before turning on automatic execution. Due to the time lag between recognizing a trade signal and manually entering the order, the execution prices reported in the back test reports will not completely synchronized. Once automated execution is implemented execution price should be 100% synchronized minus slippage and commission costs. The foundation of a trading systems implementation is the simulated back tested and forward tested results. These results must be meticulously verified. The main objective of this process is to manually insure when a trade signal occurs that the prices reported in the back tester are aligned, to insure no erroneous trade orders are generated and to insure that the rules designed into the model are being followed. Programming in any language requires absolute precision and care in the design and programming. Programming errors can occur this phase will eliminate the possibility that any errors are present. The actual results of today’s trading a profit of $527 matches the $515 reported by the back testing report ($1188 profit in the trend following system minus a loss of $673 in the counter trend trading system). Part of the trading model that is not yet implemented is a scaling in and out of a position, e.g. when a significant profit occurs in a position a portion of the position is closed. The back testing module is using a fixed share size of 100 shares, the actual trading size for this phase of testing is between 25 and 200 shares, with 100 being the average to synchronize actual with back testing results. 41
- 42. Glen M. Demarco – Professional Background I have worked for over 20 years in the industry starting with Merrill Lynch in the mid eighties, then Nikko Securities, Deutsche Bank, and finally Goldman Sachs where I left as a Vice President to pursue full time my interest in money management. While at Merrill Lynch IT’s department I became extremely interested in technical analysis and trading. There I began an extensive education process taking many courses at the NYIF and NYU relating to trading, technical analysis, options, futures, currencies, etc. During that time I received the Certified Market Technicians (CMT) designation by the Market Technicians Association. This required quite a few classes, passing a series of exams, being active in the MTA, and finally writing a thesis on an original technical analysis concept. Fred Schutzman and Ralph Acompora were my mentors in the program and Phil Roth reviewed and approved the final thesis requirement. Since leaving Goldman Sachs I have dedicated myself exclusively to researching, developing and trading systems. For several years full time I worked as a trader, and traded options, futures and FX with mixed results. Very short term trading was never my objective; rather I felt it important to immerse myself in trading as a way of enhancing my theoretical knowledge base. It was well worth the effort as there are things one learns glued to the screen for years watching markets that can never be learned any other way. Please feel free to contact me anytime as I am always available to discuss system trading or to discuss any mutual beneficial business arrangement. Thanks for listening. Glen Demarco 20 River Terrace #20A New York, NY 10282 demarcog@aol.com home phone 212 786-0909 cell phone 212 433-0872 . . 42
- 43. 43