Profiling of Alzheimer’s disease patients in Puerto Rico - 2016 - CLCM
•
1 gefällt mir•58 views


Empfohlen
Empfohlen
Weitere ähnliche Inhalte
Was ist angesagt?
Was ist angesagt? (20)
Andere mochten auch
Andere mochten auch (18)
Ähnlich wie Profiling of Alzheimer’s disease patients in Puerto Rico - 2016 - CLCM
Ähnlich wie Profiling of Alzheimer’s disease patients in Puerto Rico - 2016 - CLCM (20)
Profiling of Alzheimer’s disease patients in Puerto Rico - 2016 - CLCM
- 1. SAGE Open Medicine Creative Commons Non Commercial CC-BY-NC: This article is distributed under the terms of the Creative Commons Attribution-NonCommercial 3.0 License (http://www.creativecommons.org/licenses/by-nc/3.0/) which permits non-commercial use, reproduction and distribution of the work without further permission provided the original work is attributed as specified on the SAGE and Open Access pages (https://us.sagepub.com/en-us/nam/open-access-at-sage). SAGE Open Medicine Volume 4: 1–8 © The Author(s) 2016 Reprints and permissions: sagepub.co.uk/journalsPermissions.nav DOI: 10.1177/2050312115627826 smo.sagepub.com Introduction Alzheimer’s disease (AD) is the most prevalent dementia affecting individuals 65 years or older, especially within the Latino/Hispanic population.1,2 AD is characterized by the loss of memory and executive functions to the point of interfering with daily living tasks.3,4 The progressive cognitive impair- ment and the exclusion of other underline causes, such as vas- cular disease, stroke, vitamin B12 deficiency, and chronic depression, are the basis of a possible or probableAD diagno- sis.3,4 Due to the lack of accessibility of diagnostic biomark- ers, outside research centers, psychometric tests, and brain imaging analyses are the main tools that physicians have Profiling of Alzheimer’s disease patients in Puerto Rico: A comparison of two distinct socioeconomic areas Clara L Camacho-Mercado1, Raúl Figueroa2, Heriberto Acosta3, Steven E Arnold4 and Irving E Vega5 Abstract Objective: The Latino/Hispanic community in the United States is at higher risk of developing Alzheimer’s disease than other ethnic groups. Specifically, Caribbean Hispanics showed a more severe Alzheimer’s disease symptomatology than any other ethnic group. In a previous study, we demonstrated that the mortality rate associated with Alzheimer’s disease in Puerto Rico is higher than that reported in the United States. Moreover, the mortality rate associated with Alzheimer’s disease was higher among Puerto Rican living in Puerto Rico than those in the mainland United States. There is also a differential geographical distribution of mortality rate associated with Alzheimer’s disease in Puerto Rico, which may be associated with differential socioeconomic status and/or access to healthcare. However, there is no information regarding the clinical profile of Alzheimer’s disease patients in Puerto Rico. Methods: Here, we present the results of a retrospective study directed to profile Alzheimer’s disease patients clustered into two groups based on areas previously determined with low (Metro Region) and high (Northwest-Central Region) mortality rate associated with Alzheimer’s disease in Puerto Rico. Results: Significant difference in the age-at-diagnosis and years of education was found among patients within the two studied regions. Despite these differences, both regions showed comparable levels of initial and last Mini Mental State Examination scores and rate of cognitive decline. Significant difference was also observed in the occurance of co-morbidities associated with Alzheimer’s disease. Conclusions: The differential profile of Alzheimer’s disease patients correlated with differences in socioeconomic status between these two regions, suggesting that covariant associated with social status may contribute to increased risk of developing Alzheimer’s disease. Further studies should be conducted to determine the role of socioeconomic factors and healthy living practices as risk factors for Alzheimer’s disease. Keywords Hispanics, Alzheimer’s disease, ethnicity, aging, risk factors Date received: 7 September 2015; accepted: 29 December 2015 1Department of Biology, Rio Piedras Campus, University of Puerto Rico, San Juan, Puerto Rico 2Demographics Assistance Group, San Juan, Puerto Rico 3Caribbean Center for the Study of Memory and Cognition, San Juan, Puerto Rico 4Departments of Psychiatry and Neurology, Penn Memory Center, The University of Pennsylvania, Philadelphia, PA, USA 5Department of Translational Science Molecular Medicine, College of Human Medicine, Michigan State University, Grand Rapids, MI, USA Corresponding author: Irving E Vega, Department of Translational Science Molecular Medicine, College of Human Medicine, Michigan State University, 333 Bostwick Ave. NE, Grand Rapids, MI 49503, USA. Email: irving.vega@hc.msu.edu 627826SMO0010.1177/2050312115627826SAGE Open MedicineCamacho-Mercado et al. research-article2016 Original Article
- 2. 2 SAGE Open Medicine available for diagnosis purposes. Mini Mental State Examination (MMSE) or Folstein test is the most used psy- chometric test to evaluate memory, attention, language, and executive function in patients with complains or symptoms of cognitive impairment.5–7 Due to the simplicity of the ques- tions and tasks, the MMSE score needs to be adjusted to the patient’s level of education.6 However, despite adjusting for the level of education, Hispanics showed significantly lower MMSE in comparison to African-Americans and white Caucasians.1 These facts led the scientific community to con- clude that ethnicity is a risk factor for the development ofAD. Twelve percent of older adults in the Hispanic population are diagnosed with AD, the highest proportion among differ- ent ethnic groups in the United States.1 The Hispanic popula- tion living in the United States is very diverse and could be grouped into three major groups based on their origin of birth, namely, Central American, South American, and Caribbean. Geographically, the population of Hispanics from Caribbean Islands is concentrated in the northeast of United States. Romas et al.8 adopted the term Caribbean Hispanics to identify and differentiate AD patients in this group from Hispanics of other origins. The Caribbean Hispanic population in the northeast of United States is com- posed of people from Puerto Rico, Dominican Republic, and Cuba. Previous studies indicated that Caribbean Hispanics have fewer years of education, lower age-of-onset, and lower MMSE score in comparison to African-Americans and white Caucasians.9–12 Livney et al.11 showed that a Hispanic cohort in Philadelphia has a more severe symptomatology associ- ated with AD than any other ethnic group studied, with sig- nificant lower age-of-onset and MMSE score. This Hispanic cohort is primarily composed (85%) of Puerto Ricans.13 Further studies of Puerto Ricans within the Philadelphia cohort identified a dominant mutation in the amyloid-β pro- tein precursor (AβPP) gene associated with familial AD.13 The Gly206A mutation in AβPP was also identified, about 10 years earlier, in a cohort of families of Puerto Rico descent in the Washington Heights/Hamilton Heights Aging Project.14 Taken together, genetic and social factors may contribute to the distinct symptomatology of Caribbean Hispanics AD patients. Our previous studies of Puerto Ricans, living in the island of Puerto Rico, indicated that the mortality rate associated with AD is significantly higher than the one registered in the United States.15 Moreover, the mortality associated with AD of Puerto Ricans in Puerto Rico is higher than that for Puerto Ricans living in the United States.15 However, geographical analysis of mortality rate in Puerto Rico identified some regions with lower or comparable rate to the one reported in the United States, while other regions showed significantly higher mortality rate associated with AD.15 The underlying cause(s) of the differential mortality rate and the clinical pro- file of AD patients in Puerto Rico are still unknown. Here, we conducted a retrospective study to profile AD patients in two regions of Puerto Rico, based on their previously determined mortality associated with AD. We compared demographic variables, MMSE score, rate of change, and comorbidities among patients from both regions. The results are discussed and contrasted, taking into consideration the differences in socioeconomic status and healthcare facilities among the two studied regions. Methods Subjects and diagnostic criteria To develop a clinical profile of the progression of AD, we collected data related to AD patients from two private prac- tices, one in San Juan (Metro) and the other in Manati (Northwest-Central), that encompass areas of high and low mortality associated with AD, respectively.15 We identified one clinical practice at each area with similar diagnostic pro- tocols that included brain imaging, psychometric analyses, and serological tests (in some instances, patients were tested for sexually transmitted diseases). In addition, the selected clinical practices serve a broad and representative population within the regions of interest and are recognized in Puerto Rico due to their expertise in the diagnosis and treatment of AD patients. The physicians at these clinics are American Board of Neurology certified with over 20 years of experi- ence, dedicating most of their clinical practice to cognitive impaired patients. The municipalities represented in the Metro Region were Carolina, Guaynabo, Trujillo Alto, and San Juan. The municipalities represented in the Northwest- Central Region were Aguadilla, Aibonito, Arecibo, Barceloneta, Barranquitas, Bayamon, Caguas, Camuy, Ciales, Corozal, Hatillo, Isabela, Lares, Manati, Naranjito, Orocovis, Quebradillas, Toa Alta, Utuado, Vega Alta, and Vega Baja. The primary residence was determined from the clinical record. Even though other psychometric analyses were registered (e.g. clock drawing, Montreal Cognitive Assessment) in the patients’ record, MMSE score was selected because it was the common diagnostic psychomet- ric tool used for all patients at both clinical practices. Brain imaging results were not recorded and exclusively used as the criterion for diagnosis of possible or probable AD by the clinician. The inclusion criteria were as follows: patients diagnosed with probable or possible AD, serological tests, and cognitive impairment measured by MMSE.5–7 The cases included had at least one MMSE (first or last) with score of 26 or less, taking into consideration that a normal MMSE score is 27 or more. The exclusion criteria were as follows: MMSE score of 27 or more, diagnosis of mixed dementia, for example,AD, and vascular dementia. The total amount of records included in this study was 485. The absence of infor- mation about specific parameters in some of the records con- tributed to the variability of the reported N value per analyzed parameter. The record review was conducted in accordance with the University of Puerto Rico Institutional Review Board–approved protocol (#1011–208).
- 3. Camacho-Mercado et al. 3 Record review The information from the medical record was collected on a profile template using Epi Info™ (version 3.5.3), a program developed by the Centers for Disease Control and Prevention (CDC) as a data collection and analysis instrument.16 The parameters evaluated were demographic information (age, gender, education, and primary residency), metabolic profile (levels of B12, glucose, cholesterol, and triglycerides), comorbidities (diabetes, hyperlipidemia, hypertension, hypothyroidism, and depression), and general information about caregivers. The age at initial evaluation and years of education were collected from the medical record, as reported by the patient or a family member. The score of the initial MMSE was the score obtained in the first cognitive test per- formed on the patient. The last MMSE was the last score recorded in the clinical record. Only those cases with two MMSE scores and the date when the test was performed (more than 3 months apart) were used to estimate the rate of change in cognitive function. In terms of comorbidities, it is important to mention that we included only those conditions recognized as risk factors of AD.15 Socioeconomic and healthcare facilities The Controller’s Office is the governmental agency respon- sible for collecting and reporting socioeconomic data in Puerto Rico. Thus, the socioeconomic data from represented municipalities in the records reviewed were extracted from the Puerto Rico Controller’s Report, based on the 2010 cen- sus. The reported income per capita, percentage of popula- tion under poverty level, unemployment rate, and percentage of 25 years or older with high school education or more, for each municipality, were averaged within a specific region. The inclusion of municipalities within a region was based on the Department of Health of Puerto Rico established distri- bution of Health Regions in Puerto Rico, as previously used to assess the geographical distribution of mortality rate asso- ciated with AD.15 The number of healthcare facilities within a specific Region was extracted from the 2014 Health Report of Puerto Rico (http://www.salud.gov.pr/Estadisticas- Registros-y-Publicaciones/EstadisticasVitales/Informe de la Salud en Puerto Rico 2014.pdf). Data analysis The data were recorded using the Epi Info software and downloaded to Microsoft Excel program. Data analysis was carried out using JMP 9.0 (SAS, Cary, NC, USA) and GraphPad Prism (version 6.05) statistical software. The study used descriptive statistics, focusing on the measures of central tendency. For each quantitative parameter, we cal- culated the mean and the standard deviation (SD), followed by non-parametric two-tailed Mann–Whitney test of unpaired t-test data to determine statistical difference at p-value lower than 0.05 at 95% confidence interval. The rate of change in the MMSE score was calculated by sub- tracting the last MMSE score with the first MMSE score and dividing by the number of years between these two tests. A Z-test for two population proportions (two-tailed; p 0.05) was performed to determine significance of the percentage of AD patients’ caregivers and comorbidities between the two populations studied. Pearson’s correlation coefficient was determined for age-at-diagnosis and income per capita for each municipality in both regions studied (p-value: two-tailed, 95% confidence interval). Results Demographic profile Previous studies indicated that age-of-onset and age-at- diagnosis of AD are earlier among Caribbean Hispanics than other ethnic groups living in the mainland United States.9–12 However, there is no information about those liv- ing in Puerto Rico. The Metro Region includes municipali- ties within the San Juan metropolitan area that have shown lower mortality rate associated with AD in comparison to Northwest-Central Region in Puerto Rico.15 Thus, we recorded the age-at-diagnosis using the information reported in the clinical records of patients within these two regions. The average age-at-diagnosis for all cases evaluated was 77.9 years (Table 1). However, the age-at-diagnosis of AD cases in the Metro Region was 79.3 years of age, signifi- cantly higher (p 0.0001) than the 75.8 years of age regis- tered in a representative cohort from the Northwest-Central Region in Puerto Rico (Table 1). Since we noticed that in most cases evaluated patients were diagnosed as probable or possible AD within the first visits, it is very likely that the age-of-onset was earlier than the age registered at diagnosis. Nevertheless, this result indicates that AD patients in the Northwest-Central region are diagnosed at a younger age than those in the Metro Region in Puerto Rico. Next, we determine the sex ratio and level of education of the cohort of AD patients in Puerto Rico. In the cohort stud- ied, 65% of the AD patients were female, which is consistent with the higher reported proportion of females with AD in the general population.13,15 The data also indicate that there are significantly more female diagnosed with AD in the Metro Region than Northwest-Central Region of Puerto Rico. However, it is important to mention that, based on the 2010 census, the percentage of females 65 years of age or older is higher in the Metro Region (58.7%) than in the Northwest-Central Region (54.9%). In terms of education, the average year of education was significantly higher (13.0; p 0.01) in the Metro Region than that registered from AD patients in the Northwest-Central Region (12.0) of Puerto Rico (Table 1). Consistently, the percentage of the popula- tion 25 years of age or older with high school or more is higher in the Metro Region (76%) than in the
- 4. 4 SAGE Open Medicine Northwest-Central Region (63%; Table 5). Taken together, the results suggest that the significant differences in the per- centage of females and years of education among the cohort of AD patients may be influenced by sociodemographic dif- ferences between the Metro and Northwest-Central Regions. Cognitive profile The MMSE score was used to determine cognitive function at the time of initial evaluation (first MMSE) and to assess the progression or rate of cognitive change. The average score of the first MMSE was 19.9 for all AD patients regis- tered in this study (Table 1). The average of the first MMSE in the Metro Region (20.1) was slightly higher than the one from Northwest-Central Region (19.5) in Puerto Rico, but not significantly different (Table 1). No all recorded AD cases included in the study had more than one MMSE regis- tered in the clinical record, but for those cases that had two or more, the average of the last MMSE registered was 18.4. Even though the average MMSE score from the region with high mortality rate associated with AD (Northwest-Central) was slightly lower (17.8), no significant difference was detected between the Metro Region (18.4) and Northwest- Central Region in Puerto Rico (Table 1). To determine the rate of change per year, we only used those cases that had two or more MMSE scores and the date when the score was recorded. Consistently, no significant difference was detected in the rate of change per year of MMSE score, which was calculated to be a decline of 1.4 points per year (Table 1). The effect that the level of education has on MMSE scores has been previously documented.6 Consistently, an analysis of the MMSE score taking into consideration the years of education revealed a significant difference between AD patients when grouped based on their years of education and their respective MMSE scores (data not shown). These results suggest that the small, but significant, difference in years of education of AD cases reported in the Metro versus Northwest-Central Regions may account for the slightly higher MMSE score in the Metro Region but did not have an effect on the rate of cognitive decline. Comorbidities and metabolites’ level AD has been associated with metabolic disorders such as dia- betes and hyperlipidemia.17 These two metabolic disorders are prevalent among Hispanics, especially in the Caribbean Hispanic population.11,13,14 In the cohort studied here, we found that 48% of the AD patients were hyperlipidemic and 69% were hypertensive (Table 2). The Metro Region had a slight but significant higher percentage (p 0.0151, Z-score −2.427) of hypertensive AD patients than the Northwest-Central Region in Puerto Rico (Table 2). In contrast, the percentage of diabetic AD patients was significantly higher (p 0.000072, Z-score −3.383) in the Northwest-Central Region than in the Metro Region (Table 2). Interestingly, glucose was the only metabo- lite in which the average level was higher than normal in both regions (Table 3). All other metabolites recorded were within the normal range (Table 3). Depression is another comorbidity associated with AD, especially among Caribbean Hispanics.11 We found that almost one in every two AD patients in the cohort studied in Puerto Rico was diagnosed with depression. When comparing both regions, the percentage of AD patients diagnosed with depression was significantly (p 0.00386, Z-score −2.893) higher in the Metro Region than in the Northwest-Central Region of Puerto Rico. The results indicate that there are significant differences in the occurrence of comorbidities, which suggests a distinct profile of AD patients between these two regions studied. Primary caregiver of AD patients per region We also determined the primary caregiver of AD patients from both regions in this study (Table 4). The primary caregiver for most AD patients was the husband or wife followed by other Table 1. Demographic and cognitive profile of Puerto Rican AD patients in Metro versus Northwest-Central regions. Variables All regions Metro Region Northwest- Central Region Difference between regions, p-valuea Age at diagnosis, in years (SD, N) 77.9 (7.2, 468) 79.3 (6.9, 287) 75.8 (7.16, 181) p 0.0001 Sex, % female 65% (314/484) 66% (195/295) 63% (119/189) p 0.0078 Z-score −2.6606 Education in mean years (SD, N) 12.7 (3.4, 406) 13.0 (3.4, 279) 12.0 (2.8, 127) p 0.01 Initial MMSE (SD, N) 19.9 (5.4, 485) 20.1 (5.3, 295) 19.5 (5.2, 190) p 0.4396 Last MMSE (SD, N) 18.4 5.4,354) 18.6 (5.2, 244) 17.8 (5.8,110) p 0.2868 Initial MMSE (SD, N) 21.8 (4.48, 198) 21.8 (4.2, 139) 21.8 (5.15, 59) p 0.6756 Last MMSE (STD, N) 18.24 (5.38, 198) 18.4 (5.2, 139) 17.83 (6.09, 59) p 0.5827 Rate of change (first MMSE − last MMSE/year), mean (SD, N) 1.4 (2.0, 198) 1.4 (2.0, 139) 1.4 (2.0, 59) p 0.8228 AD: Alzheimer’s disease; SD: standard deviation; MMSE: Mini Mental State Examination. A total of 485 clinical records were reviewed. The N value per parameter is based on the total amount of records that contained the reported informa- tion. The rate of change was used only for those records that have two or more MMSE scores and specific date. aNon-parametric two-tailed Mann–Whitney test of unpaired t-test data, except for gender that used Z-test for two population proportions.
- 5. Camacho-Mercado et al. 5 family members. Interestingly, the percentage of husband or wife caregivers was significantly higher (p 0.00001, Z-score −7.530) in the Northwest-Central Region than in the Metro Region (Table 4). In contrast, the category of other family mem- ber (siblings) was significantly higher (p 0.0041, Z-score −2.873) in the Metro Region than in the Northwest-Central Region (Table 4). AD patients who reported living alone were significantly higher (p 0.0214, Z-score −2.299) in the Metro Region than in Northwest-Central Region; close to one in every fourAD patients in the Metro Region are living alone (Table 4). There was no significant difference in the amount of institutionalized (non-family caregivers; p 0.5222) AD patients among the two Regions (Table 4). Sociodemographic characteristics that differentiate the two studied Regions in Puerto Rico may explain the identified differences in caregiver. Socioeconomic and healthcare facilities per region In order to define the sociodemographic differences between the Metro and Northwest-Central Region, we extracted public data from two governmental offices in Table 2. Comparison of comorbidities of Puerto Rican AD patients in Metro and other health regions. Comorbidities All regions, % (N = 485) Percent of AD patients in Metro Region (N = 295) Percent of AD patients in Northwest-Central-Region (N = 190) Difference between regions, p-valuea Diabetes mellitus 29 24 35 p 0.000072 Z-score −3.383 Hypertension 69 71 65 p 0.0151 Z-score −2.427 Hyperlipidemia 48 57 46 p 0.19914 Z-score −1.284 Hypothyroidism 15 15 15 p 0.20982 Z-score −1.254 Depression 48 46 50 p 0.00386 Z-score −2.893 AD: Alzheimer’s disease. aZ-test for two population proportions. Table 3. Blood metabolite values in AD Puerto Rican patients in Metro versus other health regions. Metabolite levels (normal value) All regions—mean of metabolite levels (SD, N) Metro Region— mean of metabolite levels (SD, N) Northwest-Central Region—mean of metabolite levels (SD, N) Difference between regions, p-valuea B12 (110–1500 pg/mL) 611.28 (480.00, 281) 602.38 (445.35, 195) 631.44 (552.89, 86) p 0.6680 Glucose (70–99 mg/dL) 106.44 (33.55, 246) 105.16 (34.39, 166) 109.09 (31.77, 80) p 0.3777 Total cholesterol (less than 200 mg/dL) 185.17 (41.10, 321) 179.37 (39.49, 214) 196.76 (42.08, 107) p 0.0005 Triglycerides (less than 150 mg/dL) 131.48 (72.42, 303) 129.15 (69.28, 213) 137.01 (78.48, 90) p 0.4112 AD: Alzheimer’s disease; SD: standard deviation. The N value per parameter is based on the total amount of records that contained the reported information. aNon-parametric two-tailed Mann–Whitney test of unpaired t-test data. Table 4. AD patients’ caregivers in Puerto Rico. Caregiver All regions, % (N = 362) Metro Region, % (N = 261) Northwest-Central Region, % (N = 101) Difference between regions, p-valuea Husband/wife or partner 48 44 57 p 0.00001 Z-score −7.530 Other family members 23 25 21 p 0.0041 Z-score −2.873 Non-family caregiver 6 7 4 p 0.5222 Z-score −0.6356 Alone 22 24 18 p 0.0214 Z-score −2.299 AD: Alzheimer’s disease. aZ-test for two population proportions.
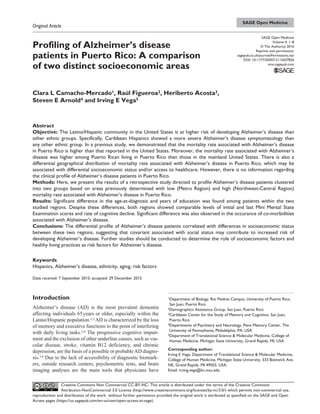
- 6. 6 SAGE Open Medicine PuertoRico,namely,theController’sOfficeandDepartment of Health. In terms of population density, the Metro Region is five times more populated than the Northwest-Central Region (Table 5). This high population density is also reflected in the quantity of healthcare facilities and hos- pices. For example, the distribution of hospitals and hos- pices per square mile in the Metro Region is about five times that of the Northwest-Central Region (Table 5). The two regions are also markedly different in terms of income per capita and population under the poverty level (Table 5). The average income per capita of the municipalities included in the Metro Region (US$16,192) is more than double of the one reported for the municipalities in the Northwest-Central Region (US$7991). This socioeconomic difference is reflected in the fact that almost half (48%) of the population in the Northwest-Central Region lives under the poverty level, in contrast to 29% in the Metro Region. Thus, in comparison to the income per capita (US$10,355) and the percentage of the population living under the pov- erty level (34.7%) in Puerto Rico, the Metro Region repre- sents an area of high socioeconomic status where the Northwest-Central Region is one of lower socioeconomic status (Table 5). Consistently, the unemployment rate in the Metro Region (8%) is half of that reported last year (2014) for the Northwest-Central Region (16.1%) and considera- bly lower than that for the entire island of Puerto Rico (14%). Pearson’s correlation of income per capita versus age-at-diagnosis of AD indicated a positive correlation (r = 0.6496; R2 = 0.4420; degree of freedom (df) = 12; p 0.0119), suggesting that earlier age-at-diagnosis corre- lates with lower socioeconomic status (Figure 1). Taken together, these data indicate that the region with higher mortality rate associated with AD, earlier age-at-diagnosis, and less years of formal education in Puerto Rico has lower socioeconomic status and less healthcare facilities per square mile than the region with significantly lower mortal- ity associated with AD.15 Discussion The high prevalence of AD among Hispanics and African- Americans suggests that these two ethnic groups are at higher risk of developing this devastating disease than white Caucasian.1 Among Hispanics, Caribbean Hispanics showed a more severe presentation and progression of AD. For Caribbean Hispanics, the MMSE scores are significantly lower (even after correcting for their level of education), the rate of change in cognition is more accelerated, and the age- of-onset is significantly earlier than any other ethnic group.9–11 However, socioeconomic status and healthcare access as covariant in relation to the ethnic background are rarely taken into consideration. Here, we showed the clinical profile of AD patients in a Caribbean Hispanic population (Puerto Ricans) from two distinct socioeconomic areas with previously reported differential mortality rate associated with AD.15 The Northwest-Central Region encompasses a low socioeconomic level and high mortality rate associated with AD in Puerto Rico whereas the Metro Region represents a high socioeco- nomic status and low mortality rate associated with AD. Even though a significant difference in the age-at-diagno- sis between the two regions studied was detected, no differ- ence was detected in MMSE score and rate of cognitive decline in AD patients living in Puerto Rico. In contrast, the initial MMSE score average in Puerto Rico was 19.9, which is significantly higher than those previously reported for Puerto Ricans living in the United States.9–14 Furthermore, the average year of education (12.7) of AD patients from both regions in Puerto Rico was also higher than the one reported for Puerto Ricans living in the mainland United States.9–14 Although education had an effect on the MMSE score, the first MMSE score (17.6), for those living in Puerto Rico with 0–9 years of education was higher than the one reported for Caribbean Hispanic in the mainland United States.9–13 Thus, in this case, education level may not be the main factor contributing to the difference in MMSE score Table 5. Socioeconomic and healthcare facilities in municipalities that comprise the Metro versus Northwest-Central regions. Puerto Rico Metro Region Northwest-Central Region Total surface area of the region (sq. mile) 3421 141 1043 Total population in the regiona 3,725,789 744,854 1,129,537 Population density (people/sq. mile) 1089 5283 1083 Income per capita in the region (SD)a US$10,355 US$16,192 (2966) US$7,991 (1813) % Population under poverty level in the regiona 34.7 29 48 % Population 25 years or older with high school or more in the regiona 67.6 76 63 % Unemployment rate in the region (2014) 14 8.1 16.1 Total number of hospital and healthcare facilities in the region (as of 2013) (per sq. mile) 250 (0.073) 59 (0.418) 79 (0.076) Total hospice facilities in the region (per sq. mile) 43 (0.013) 13 (0.071) 15 (0.016) SD: standard deviation. The reported values are based on the municipalities represented in each region. aBased on the 2010 Census.
- 7. Camacho-Mercado et al. 7 between Caribbean Hispanics in Puerto Rico versus the United States. Interestingly, however, the Caribbean Hispanics studied in North Philadelphia live in a socioeco- nomic area similar to the Northwest-Central Region in Puerto Rico. These results further support the hypothesis that factors associated with low socioeconomic status may con- tribute to increase the risk of developing AD. Socioeconomic status and education level have been shown to effect cognitive function.17 In addition, inherent cultural characteristics and healthy lifestyle differences among ethnic groups may contribute to differences in the prevalence of AD.17,18 Thus, the access to or social influ- ences to maintain a healthy diet could be different in every ethnic group due to socioeconomic differences or traditional customs. Coincidentally, the blood glucose level was higher than normal among AD patients from both regions studied in Puerto Rico, suggesting a high degree of insulin resistance within the cohort studied that may be related to the diet or genetic risk factors.19 Additionally, a diagnosis of depression was found in almost one of two AD patients in Puerto Rico. Interestingly, while diabetes and depression were found largely in a region of low socioeconomic status, hyperten- sion was prominent in the region of high socioeconomic sta- tus in Puerto Rico. These results suggest that socioeconomic status of a distinct population may influence the detection of specific risk factors or comorbidities associated with AD. Taken together, the profile of AD patients living in Puerto Rico differed based on the socioeconomic status of the stud- ied region. Thus, this study brings forward an alternative hypothesis to explain the higher prevalence of AD among Caribbean Hispanics in the United States and Puerto Rico. We hypothesize that socioeconomic status and healthcare access should be taken into consideration as covariant to determine factors that increase the risk of AD among a specific ethnic group. Prevention strategies leading to halt the high AD prevalence among ethnic minorities should be based on cultural sensitive education programs and reduc- tion in healthcare disparities to facilitate the early detection of abnormal memory problems in the elder population within the Caribbean Hispanic population.17,18 Thus, further studies are needed to determine those socioeconomic factors that contribute to health disparities and differences in prevalence of AD among different ethnic groups.18 Acknowledgements The authors are grateful to the staff at Caribbean Center for the Study of Memory and Cognition and the Institute of Neuroscience at the Manati Medical Center for their contribution to this study. The authors also thank Dr. María-Egleé Perez for her assistance with biostatistics and Dr. Roberto Marrero for his contribution as medical liaison. Declaration of conflicting interests The author(s) declared no potential conflicts of interest with respect to the research, authorship, and/or publication of this article. Ethical approval Ethical approval for this study was obtained from University of Puerto Rico Institutional Review Board–approved protocol (#1011-208). Funding The author(s) disclosed receipt of the following financial support for the research, authorship, and/or publication of this article: This research is financially supported by the College of Human Medicine, Michigan State University. Informed consent Informed consent was not sought for this study because this is a retrospective study that does not include information that can serve as identifier, as approved by the UPR-IACUC. References 1. Alzheimer’s Association. 2014 Alzheimer’s disease facts and figures. Alzheimers Dement 2014; 10: e47–e92. 2. Prince M, Bryce R, Albanese E, et al. The global prevalence of dementia: a systematic review and metaanalysis. Alzheimers Dement 2013; 9: 63–75. 3. Serrano-Pozo A, Frosch MP, Masliah E, et al. Neuropathological alterations in Alzheimer disease. Cold Spring Harb Perspect Med 2011; 1: a006189. 4. Bane TJ and Cole C. Prevention of Alzheimer disease: the roles of nutrition and primary care. Nurse Pract 2015; 40: 30–35. 5. Folstein MF, Folstein SE and McHugh PR. Mini Mental State: a practical method for grading the cognitive state of patients for the clinician. J Psychiatr Res 1975; 12: 189–198. 6. Roselli F, Tartaglione B, Federico F, et al. Rate of MMSE score change in Alzheimer’s disease: influence of education and vascular risk factors. Clin Neurol Neurosurg 2009; 111: 327–330. Figure 1. Pearson’s correlation of age at diagnosis and income per capita. The average age at diagnosis of each municipality in the Metro Region (triangle) and Northwest-Central Region (circle) was plotted against the respective income per capita (r = 0.6496; p 0.0119). A line that illustrates the best fit was determined using linear regression (R2 = 0.4220).
- 8. 8 SAGE Open Medicine 7. Doody RS, Pavlik V, Massman P, et al. Predicting progression of Alzheimer’s disease. Alzheimers Res Ther 2010; 2: 2. 8. Romas SN, Tang MX, Berglund L, et al. APOE genotype, plasma lipids, lipoproteins, and AD in community elderly. Neurology 1999; 53: 517–521. 9. Tang MX, Cross P, Andrews H, et al. Incidence of AD in African-Americans, Caribbean Hispanics, and Caucasians in northern Manhattan. Neurology 2001; 56: 49–56. 10. Olarte L, Schupf N, Lee JH, et al. Apolipoprotein E epsilon4 and age at onset of sporadic and familial Alzheimer disease in Caribbean Hispanics. Arch Neurol 2006; 63: 1586–1590. 11. Livney MG, Clark CM, Karlawish JH, et al. Ethnoracial dif- ferences in the clinical characteristics of Alzheimer disease at initial presentation at an urban Alzheimer’s disease center. Am J Geriatr Psychiatry 2011; 19: 430–439. 12. Reitz C and Mayeux R. Genetics of Alzheimer’s disease in Caribbean Hispanic and African American populations. Biol Psychiatry 2014; 75: 534–541. 13. Arnold SE, Vega IE, Karlawish JH, et al. Frequency and clinicopathological characteristics of presenilin 1 Gly206Ala mutation in Puerto Rican Hispanics with demen- tia. J Alzheimers Dis 2013; 33: 1089–1095. 14. Athan ES, Williamson J, Ciappa A, et al. A founder muta- tion in presenilin 1 causing early-onset Alzheimer disease in unrelated Caribbean Hispanic families. JAMA 2008; 286: 2257–2263. 15. Figueroa R, Steenland K, MacNeil JR, et al. Geographical dif- ferences in the occurrence of Alzheimer’s disease mortality: United States versus Puerto Rico. Am J Alzheimers Dis Other Demen 2008; 23: 462–469. 16. Centers for Disease Control and Prevention (CDC) and Division of Public Health Surveillance and Informatics (DPHSI). What is Epi Info™? CDC Web site, 2005, http:// www.cdc.gov/epiinfo 17. Sattler C, Toro P, Schönknecht P, et al. Cognitive activity, education and socioeconomic status as preventive factors for mild cognitive impairment and Alzheimer’s diseases. Psychiatry Res 2012; 196: 90–95. 18. Napoles AM, Chadiha L, Eversley R, et al. Developing cultur- ally sensitive dementia caregiver interventions: are we there yet? Am J Alzheimers Dis Other Demen 2010; 25: 389–406. 19. Reitz C and Mayeux R. Alzheimer disease: epidemiology, diagnostic criteria, risk factors and biomarkers. Biochem Pharmacol 2014; 88: 640–651.