Stock Research Report for Yamana Gold Inc ETR as of 11/17/11 - Chaikin Power Tools
•
1 gefällt mir•210 views

To order a Chaikin Power Gauge stock research report for ETR go to http://www.chaikinpowertools.com/reports

Empfohlen
Empfohlen
Weitere ähnliche Inhalte
Mehr von Dan Oconnor
Mehr von Dan Oconnor (10)
Kürzlich hochgeladen
Kürzlich hochgeladen (20)
Stock Research Report for Yamana Gold Inc ETR as of 11/17/11 - Chaikin Power Tools
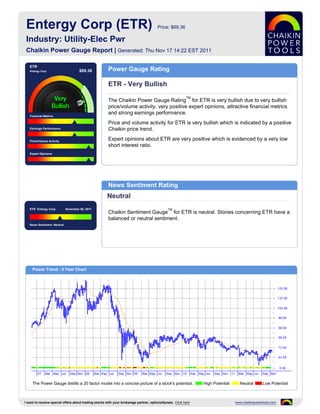
- 1. Entergy Corp (ETR) Price: $69.36 Industry: Utility-Elec Pwr Chaikin Power Gauge Report | Generated: Thu Nov 17 14:22 EST 2011 ETR Entergy Corp $69.36 Power Gauge Rating ETR - Very Bullish TM The Chaikin Power Gauge Rating for ETR is very bullish due to very bullish price/volume activity, very positive expert opinions, attractive financial metrics and strong earnings performance. Financial Metrics Price and volume activity for ETR is very bullish which is indicated by a positive Earnings Performance Chaikin price trend. Price/Volume Activity Expert opinions about ETR are very positive which is evidenced by a very low short interest ratio. Expert Opinions News Sentiment Rating Neutral ETR Entergy Corp November 06, 2011 TM Chaikin Sentiment Gauge for ETR is neutral. Stories concerning ETR have a balanced or neutral sentiment. News Sentiment :Neutral Power Trend - 5 Year Chart The Power Gauge distills a 20 factor model into a concise picture of a stock's potential. High Potential Neutral Low Potential I want to receive special offers about trading stocks with your brokerage partner, optionsXpress. Click here www.chaikinpowertools.com
- 2. Financials & Earnings Financial Metrics Financial Metrics Rating LT Debt/Equity Ratio Bullish Price to Book Value ETR's financial metrics are very good. The company may be undervalued and yields a high return on shareholder's equity. Return on Equity The rank is based on a low price to book value, high return on equity and low price to sales ratio. Price to Sales Ratio Business Value Assets and Liabilities Valuation Returns Ratio TTM Ratio TTM Ratio TTM Current Ratio 1.00 Price/Book 1.37 Return on Invest 7.2% LT Debt/Equity 1.34 Price/Sales 1.07 Return on Equity 16.7% Earnings Performance Earnings Performance Rating Earnings Growth Bullish Earnings Surprise ETR's earnings performance has been strong. The company is priced relatively low compared to next year's projected EPS and has a stable 5 year earnings trend. Earnings Trend The rank is based on worse than expected earnings in recent quarters, a Projected P/E Ratio relatively low projected P/E ratio and consistent earnings over the past 5 years. Earnings Consistency 5 Year Revenue and Earnings Growth EPS Estimates 12/06 12/07 12/08 12/09 12/10 Factor Actual EPS Prev EST EPS Current Change Revenue(M) 10,932.16 11,484.40 13,093.76 10,745.65 11,487.58 Quarterly EPS $1.27 $0.92 -0.35 Rev % Growth 8.17% 5.05% 14.01% -17.93% 6.90% Yearly EPS $6.72 $7.44 +0.72 EPS $5.46 $5.77 $6.39 $6.39 $6.72 Factor Actual EPS Growth Est EPS Growth Change EPS % Growth 27.87% 5.68% 10.75% 0.00% 5.16% 3-5 year EPS 3.24% -0.65% -3.89 EPS Surprise EPS Quarterly Results Estimate Actual Difference % Difference FY Qtr 1 Qtr 2 Qtr 3 Qtr 4 Total Latest Qtr $3.36 $3.53 $0.17 5.06 12/09 $1.22 $1.16 $2.35 $1.66 $6.39 1 Qtr Ago $1.75 $1.76 $0.01 0.57 12/10 $1.13 $1.67 $2.65 $1.27 $6.72 2 Qtr Ago $1.37 $1.38 $0.01 0.73 12/11 $1.39 $1.77 $3.55 - - 3 Qtr Ago $1.29 $1.30 $0.01 0.78 Fiscal Year End Month is December. I want to receive special offers about trading stocks with your brokerage partner, optionsXpress. Click here www.chaikinpowertools.com
- 3. Price Trend & Expert Opinions Price/Volume Activity Price/Volume Activity Rating Relative Strength vs Market Very Bullish Chaikin Money Flow Price and volume activity for ETR is very bullish. ETR has a rising price trend and has outperformed the S&P 500 over 26 weeks. Price Trend The rank for ETR is based on its price strength versus the market, a positive Price Trend ROC Chaikin price trend, a negative Chaikin price trend ROC and an increasing volume trend. Volume Trend Relative Strength vs S&P500 Index Chaikin Money Flow Chart shows whether ETR is performing better or worse than the market. Chaikin Money Flow analyzes supply and demand for a company's stock. Price Activity Price Activity Volume Activity Factor Value Factor Value Factor Value 52 Week High 74.18 % Change Price - 4 Weeks 3.55% Average Volume 20 Days 2,020,975 52 Week Low 59.57 % Change Price - 24 Weeks 2.95% Average Volume 90 Days 1,782,761 % Change YTD Rel S&P 500 -1.73% % Change Price - 4 Wks Rel to S&P 1.29% Chaikin Money Flow Persistency 48% % Change Price - 24 Wks Rel to S&P 9.42% Expert Opinions Expert Opinions Earnings Estimate Revisions Very Bullish Short Interest Expert opinions about ETR are very positive. Shorting of ETR is low and analysts's opinions on ETR have been more positive recently. Insider Activity The rank for ETR is based on analysts revising earnings estimates downward, a low short interest ratio, insiders purchasing stock, optimistic analyst opinions and Analyst Opinions price strength of the stock versus the Utility-Elec Pwr industry group. Relative Strength vs Industry Earnings Estimate Revisions Analyst Recommendations EPS Estimates Revision Summary Current 7 Days Ago % Change Factor Value Last Week Last 4 Weeks Current Qtr 0.92 0.93 -1.08% Mean this Week Hold Up Down Up Down Next Qtr 1.24 1.24 0.00% Mean Last Week Hold Curr Qtr 0 1 1 4 Curr Yr 0 0 11 1 Current 30 Days Ago % Change Change 0.00 Next Qtr 0 0 1 1 Current FY 7.44 6.69 0.75 Mean 5 Weeks Ago Hold Next Yr 0 1 2 8 I want to receive special offers about trading stocks with your brokerage partner, optionsXpress. Click here www.chaikinpowertools.com
- 4. The Company & Its Competitors ETR's Competitors in Utility-Elec Pwr News Headlines for ETR Company Power Historic EPS Projected EPS Profit Margin PEG PE Revenue(M) Documents show heavy Entergy lobbying on Vt. Gauge growth growth nuke - Nov 6, 2011 ETR 3.24% -0.65% 12.78% -14.34 8.70 11,488 Entergy files request to join MISO - Nov 1, 2011 EXC 4.39% 0.00% 12.42% - 10.16 18,644 Entergy Mississippi sees savings with power grid - Oct 31, 2011 KEP 9.63% - - - - 34,872 BRIEF: Louisiana company buys Johnston NGG 8.44% 4.37% - 2.83 - 23,242 power plant - Oct 24, 2011 Entergy to Acquire Rhode Island State Energy Center - Oct 24, 2011 Company Details Company Profile ENTERGY CORP Entergy Corporation engages principally in the following businesses: domestic utility 639 LOYOLA AVE operations, power marketing and trading, global power development, and domestic non- NEW ORLEANS, LA 70113 utility nuclear operations. They are a major integrated energy company engaged in power USA production, distribution operations, and related diversified services. They are also a Phone: 5045764000 leading provider of wholesale energy marketing and trading services, as well as an Fax: 504-576-4428 operator of natural gas pipeline and storage facilities. Website: http://http://www.entergy.com Full Time Employees: 14,958 Sector: Utilities Power Gauge Ratings are created using a relative ranking system that assigns a rank of 0 to 100 (100 being the highest) to each stock in the universe. Rank is calculated by evaluating each of the stocks factors and combining them into a single number using a weighting formula. A stock's rank ranges from 100-0, where 100 is the strongest, and a rank of 95 indicates the stock is better than 95% of the stocks in the universe. Chaikin Stock Research(CSR) is not registered as a securities broker dealer or investment advisor with either the U.S. Securities and Exchange Commission or with any state securities regulatory authority. CSR is not responsible for trades executed by users of this research report, our web site or mobile app based on the information included herein. The information presented in this report does not represent a recommendation to buy or sell stocks or any financial instrument nor is it intended as an endorsement of any security or investment. The information in this report is generic by nature and is not personalized to the specific financial situation of any individual. The user bears complete responsibility for their own investment research and should seek the advice of a qualified investment professional before making any investment decisions. Copyright (c) 1978-(Present) by ZACKS Investment Research, Inc ("ZACKS"). The information, data, analyses and opinions contained herein (1) includes the confidential and proprietary information of ZACKS, (2) may not be copied or redistributed, for any purpose, (3) does not constitute investment advice offered by ZACKS, (4) are provided solely for informational purposes, and (5) are not warranted or represented to be correct, complete, accurate or timely. ZACKS shall not be responsible for investment decisions, damages or other losses resulting from, or related to, use of this information, data, analyses or opinions. Past performance is no guarantee of future performance. ZACKS is not affiliated with Chaikin Power Tools. This report from Chaikin Power Tools is for informational purposes only and is not a recommendation to buy or sell securities. LM 2.3 DS 3.0 LS 2.1 Data Provided by ZACKS Investment Research, Inc., www.zacks.com Special offers to trade stocks from optionsXpress: www.chaikinpowertools.com