Weitere ähnliche Inhalte
Ähnlich wie World comms awards - arieso award entry
Ähnlich wie World comms awards - arieso award entry (20)
Kürzlich hochgeladen (20)
World comms awards - arieso award entry
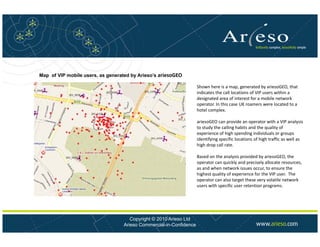
- 1. Map of VIP mobile users, as generated by Arieso s ariesoGEO
Arieso’s
Shown here is a map, generated by ariesoGEO, that
indicates the call locations of VIP users within a
designated area of interest for a mobile network
operator.
ariesoGEO can provide an operator with a VIP analysis
to study the calling habits and the quality of
experience of high spending individuals or groups
identifying specific locations of high traffic as well as
high drop call rate.
high drop call rate
Based on the analysis provided by ariesoGEO, the
operator can quickly and precisely allocate resources,
as and when network issues occur, to ensure the
highest quality of experience for the VIP user. The
g q y p
operator can also target these very volatile network
users with specific user retention programs.
Copyright © 2010 Arieso Ltd
Arieso Commercial-in-Confidence
- 2. Street level view of real‐time network performance ‐ according to the end‐user
The above figure depicts the ability of ariesoGEO to drill down to street level, and evaluate the network performance as
The above figure depicts the ability of ariesoGEO to drill down to street level, and evaluate the network performance as
subscribers experience it at the time this occurs.
ariesoGEO enables operators to continuously monitor and manage network performance issues in real‐time by focusing on
the actual subscriber experience as when and where it occurs.
Using ariesoGEO, the network performance as experienced by each subscriber can be known, in different environments
(indoors or outdoors, for business or residential areas), at different times during the day, and for any day.
ariesoGEO allows operators to visualize key performance indicators in the form of hi‐res maps and charts to precisely
understand the end‐user experience. The performance indicators that ariesoGEO monitors include voice and data traffic/data
throughput, call drops, call blocks, signal strength and quality and handover.
throughput call drops call blocks signal strength and quality and handover
Copyright © 2010 Arieso Ltd
Arieso Commercial-in-Confidence
- 3. Mapping voice and data traffic density, produced by ariesoGEO
pp g y, p y
The graph here shows the voice traffic density (Left)
and data traffic density (Right) within an area of
interest for the network operator.
Network performance issues are typically measured
by operators using outdated, approximate and
inaccurate traffic estimates and sector‐based traffic
counters.
ariesoGEO allows the operator to go to the next level
allows the operator to go to the next level
of accuracy. It enables the operator to visually
identify traffic hot spots and coverage black spots
Voice traffic density Data traffic density
wherever they occur, across the network.
ariesoGEO’s subscriber‐based analysis provides
y p
information on VIP subscribers, roamers, high data
users and many other segments . This allows the
mobile operator to allocate network resources to
exactly where they are needed, efficiently and
precisely.
Copyright © 2010 Arieso Ltd
Arieso Commercial-in-Confidence