(PRIYANKA) Katraj Call Girls Just Call 7001035870 [ Cash on Delivery ] Pune E...
Vnm 20121219-buy
1. www.vcsc.com.vn | VCSC<GO> Viet Capital Securities | 1
See important disclosure at the end of this document
Vinamilk (VNM)
18 March 2011
VND84,500 – BUY
19 December 2012
Growth and valuation
11A 12E 13E 14E 15E
Revenues (VND bn) 21,627 26,441 32,101 39,166 47,433
Operating profit (VND bn) 4,317 5,818 6,870 8,718 11,025
OP margin (%) 20.0% 22.0% 21.4% 22.3% 23.2%
Net profit (VND m) 4,218 5,202 6,047 7,409 8,877
EPS (VND) 5,288 6,236 7,249 8,882 10,641
EPS growth (%) 16% 18% 16% 23% 20%
DPS (VND) 2,000 3,000 3,000 3,000 3,000
BPS (VND) 15,641 19,193 26,776 31,658 38,299
PER (x) 24.6 20.8 17.9 14.6 12.2
PBR (x) 8.3 6.8 4.9 4.1 3.4
Dividend yield (%) 2.3% 2.3% 3.5% 3.5% 3.5%
ROE (%) 33.8% 32.5% 27.1% 28.1% 27.8%
Debt/(D+E) (%) 0.0% 0.0% 0.0% 0.0% 0.0%
A safe haven
Investors appear to recognize the competitive advantages and growth
opportunities of Vinamilk. The company has a good brandname, economy
of scales, an extensive distribution network, and expanding production
capacity to meet growing demand. Given the lack of viable alternatives in
the Vietnamese stock market, we believe it will remain a safe haven for
investors despite its relatively high PER. We initiate with a Buy
recommendation and a target price of VND106,000.
Double digit growth potential
Vietnam still has one of the lowest levels of dairy consumption in the world, and
so Vinamilk can still maintain double-digit growth in revenue and net profit.
Growth in demand is being supported by the growing middle class and education
on dairy nutrition. Vinamilk can catch the opportunity with its nationwide
distribution network and expanding capacity.
Stable profit margin
Vinamilk’s profit margin will remain stable. VNM can pass most of its higher raw
material costs to its consumers. Economies of scale and effective inventory and
expense management will reduce its unit cost. Hence, Vinamilk’s profit margins,
ROE and ROA will remain high.
Plenty of cash to pay dividends
Vinamilk will make most of its capacity expansion in FY12, and vertical
expansion in coming years will cost less. The company has no outstanding debt
and strong operating cash flow, so financing future investments and dividends is
not an issue. Vinamilk will pay a dividend of VND 3,000 per share in FY12.
Target price offers some upside
Our target price of VND106,000 per share is based on its historic average PER
and PBR as well as our DCF method. Compared with its region peers, we note
that VNM tends to trade at a lower PER, though a direct comparison is difficult
given Vietnam’s high inflation rate. The foreign price of VNM is now at our target
price, and VNM represents 12% of the Ho Chi Minh Index.
Anh Nguyen
Senior Analyst
anh.nguyen@vcsc.com.vn
+84 8 3 914 3588 ext. 194
Initiation
Target price VND106,000
Upside 25%
Consumer Goods
Market cap US$3,439m
Shares outstanding 834m
12M High VND92,700
12M Low VND52,000
Foreign ownership 49%
Foreign limit 49%
Ownership
Shareholder (state) 45.0%
F&N Dairy Investment 9.5%
Dragon Capital 7.4%
Deutsch Bank AG 5.4%
Others 32.6%
Company Description
Vinamilk is the largest dairy company with
39% market share. With more than 30
years in the market, Vinamilk has
established an excellent brand name for its
product portfolio that includes powdered
milk, liquid milk, yogurt, condensed milk
and fruit juices. The products are produced
and distributed nationwide.
0
100
200
300
400
500
600
700
800
0
20
40
60
80
100
Dec-11 Mar-12 Jun-12 Sep-12
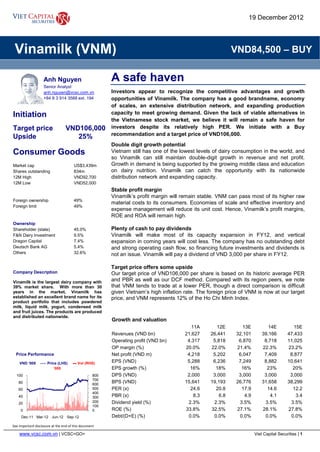
Price Performance
VND ‘000 ----- Price (LHS) ▬ Vol (RHS)
‘000
2. www.vcsc.com.vn | VCSC<GO> Viet Capital Securities | 2
See important disclosure at the end of this document
All Report Types
Investment thesis
Strengths
The dairy industry has grown at a CAGR of 17% for the period from FY06 to FY11 in
revenue and 8.1% in volume from FY03 to FY11. However, dairy consumption is still low
compare to the region and to world standards, implying strong long-term growth potential.
With 30 years of history, diversified products, a trusted brandname, Vinamilk holds a
leading industry position with a 39% market share in FY10. Continued aggressive brand
building, educating customer and pioneer products will assure Vinamilk hangs onto this
position. Overall growth will be supported by low dairy consumption, large population and
increasing income by the middle class.
Our forecast sees potential growth of 6.5% in volume for the next 5 years for the industry.
We estimate that VNM will continue to achieve growth rate of 21% and 16% in revenue
and net profit respectively in FY13. Onward, revenue and profit will both sustain at 22% for
the next 5 years. In addition, its cash position allows VNM to continue paying dividend of
VND 3,000 per share in FY13 and potentially increasing it in later years.
The risks
There is increasing competition from local and foreign players. A local player, TH Milk, had
started to invest US$400mn for its factory and cow farm, expected to invest total of
US$1.2bn in the dairy industry. Increasing investment in cow farm, factory and strong
advertisement from Friesland Campina to expand production and increase its market
share. Number of smaller players (Long Thanh Milk, Moc Chau, Ba Vi milk) entered liquid
and yogurt market segment, which provide more substitute products, create more
competitive market. With lower import-tax for dairy products (3%-5%) encouraging the
flow of brandname dairy products to Vietnam. It could affect Vinamilk revenue and lower
profit margin.
Raw material accounts for more than 60% of COGs, in which high percentage is imported,
and so any change in raw material price could put a huge affect to Vinamilk’s profit
margin.
VNM cannot immediately transfer all the volatile of raw material to its customer via selling
price adjustment. In FY09, Whole milk powder (WMP) price decreased from US$4/kg to
2.8/kg, which is 41% decline, but the gross margin increased from 32% to 37%. However,
VNM gradually increase its selling price and cleverly manage its inventory to partially
hedging this risk. For FY09/11, WMP increased 53.6%, from US$ 2.8/kg to 4.3/kg, still
gross margin reduced from 37% to 31% due to these matters.
3. www.vcsc.com.vn | VCSC<GO> Viet Capital Securities | 3
See important disclosure at the end of this document
All Report Types
Figure 1: International whole milk powder (WMP) and skim milk price
Source: www.wisc.edu
Figure 2: Vinamilk price and historical P/E,P/B
Source: Bloomberg
0
1,000
2,000
3,000
4,000
5,000
6,000
Jan-08
Apr-08
Jul-08
Oct-08
Jan-09
Apr-09
Jul-09
Oct-09
Jan-10
Apr-10
Jul-10
Oct-10
Jan-11
Apr-11
Jul-11
Oct-11
Jan-12
Apr-12
Jul-12
Oct-12
US$ tonne
WMP Skim Milk
0
20
40
60
80
100
120
140
160
0
2
4
6
8
10
12
14
16
Dec-09
Feb-10
Apr-10
Jun-10
Aug-10
Oct-10
Dec-10
Feb-11
Apr-11
Jun-11
Aug-11
Oct-11
Dec-11
Feb-12
Apr-12
Jun-12
Aug-12
Oct-12
Dec-12
VND '000x
P/E P/B Market price
4. www.vcsc.com.vn | VCSC<GO> Viet Capital Securities | 4
See important disclosure at the end of this document
All Report Types
Industry Overview
No history of dairy consumption
Dairy consumption per capital has increased strongly from 9kg in FY03 to 15.7kg in FY11.
The CAGR for this period is 8.1%, but compared with average consumption in Asia Pacific
and the world, Vietnam falls into lowest range. Vietnam is only 16% of average Pacific
Asia milk consumption and 7% of daily-recommended nutrition.
Figure 3: Dairy consumption per capital
Source: Food and Agriculture Policy Research Institute (FARPI)
Figure 4: US Dairy recommendation (2,000 cal)
Min Max
Milk Intake/day per adult (250 ml) 2 3
Daily intake in litres 0.47 0.7
Yearly intake in litres 172 256
Yearly intake in kg. 176 264
Average daily intake in litres 214
Average daily intake in kg. 220
Source: United States Department of Agriculture (USDA)
Reliance on imported dairy products
Local dairy production satisfies only 21% of current demand. Vietnam has to import 79%
of its dairy consumption. The government encourages expansion of cow farms and dairy
production capacity. Vietnam targets to have 400,000 dairy cows and a self-sufficiency
rate of 39% in FY20. Even if Vietnam can achieve this ambitious plan, the dairy industry
still has to rely on imported dairy. Because of the gap between demand and supply, the
market can absorb continuously increasing selling prices and still grow at double-digit
rates.
16
40
17
28
15
97
125
292
146
319
80
169
121
300
0
50
100
150
200
250
300
350
Vietnam
Thailand
Indonesia
China
Philippine
AsiaPacific
India
EU
Mexico
Australia
Japan
Ukraine
Latin
America
USA
kg
5. www.vcsc.com.vn | VCSC<GO> Viet Capital Securities | 5
See important disclosure at the end of this document
All Report Types
Figure 5: Vietnam milk production
Source: FAPRI
Figure 6: Vietnam imported dairy product value
Source: GSO, FAPRI
Highly concentrated market
Vinamilk and Friesland account for 64% of total market share. The remainder is shared by
a number of small players. Vinamilk dominates most markets such as yogurt, condensed
milk and liquid milk. Imported/foreigner brands are leading the powdered milk market
segment.
262
278 278
292 299
310
0
50
100
150
200
250
300
350
2008 2009 2010 2011 2012 2013
Milk Cow Numbers ('000 head) Cow Milk Production ('000 metric ton)
0
100
200
300
400
500
600
700
800
900
2006 2007 2008 2009 2010 2011 10M2012
US$ mn
6. www.vcsc.com.vn | VCSC<GO> Viet Capital Securities | 6
See important disclosure at the end of this document
All Report Types
Both Vinamilk and Friesland have products in all of product lines from UHT milk to
powdered milk. Others try to penetrate drinking milk segment, but still their market share is
less than 5% each.
Dairy companies locate their factories mostly to supply for their big northern and southern
market. Vinamilk is the only one that has factories located in central part of Vietnam.
Figure 7: Vietnam dairy market share FY10
Source: EMI & VCSC collected
Figure 8: Dairy companies and their product lines
UHT Pasteurize Yogurt Condensed
Powdered
Milk
Vinamilk X X X X X
Friesland X X X X X
Abbott X
Nestle X
Mead Johnson X
Dumex X
Hanoi Milk X X X
IDP X X X X
Moc Chau X X X
Long Thanh X X X
TH Milk X X X
Source: EMI & VCSC collected
Market Outlook
With strong historical growth rate and still an imbalance between supply and demand, the
market is expected to show a high growth ratio (revenue’s CAGR of 17% for FY06-FY11).
According to EMI forecast, dairy consumption could achieve a CAGR of 6.5% in term of
volume for the period from FY11-FY16.
VNM
39%
Friesland
25%
Others
36%
7. www.vcsc.com.vn | VCSC<GO> Viet Capital Securities | 7
See important disclosure at the end of this document
All Report Types
Figure 9: Vietnam dairy market size
Source: EMI & VCSC estimated
According to the most recent population survey, more than one-fifth of the population of
87mn is living in cities like Hanoi, Ho Chi Minh, Da Nang. The fact is one in seven is now
middle class while one in five living in the cities. This is boosting the demand for dairy
products, which is perceived as a healthy and nutritious choice.
Figure 10: Vietnam GDP per capital & Income growth rate
Source: BMI, GSO
As the living standard is increasing since “Doi Moi”, the economy has significant changed.
GDP per capital is more than triple from US$ 351 in FY00 to US$1,156 in FY10
16
18
21
25
29
35
37
40
42
44
0
5
10
15
20
25
30
35
40
45
50
2006 2007 2008 2009 2010 2011F 2012F 2013F 2014F 2015F
VND tn
8.20%
8.40%
6.20%
5.20%
6.80%
6.30%
6.80%
7.20%
0%
1%
2%
3%
4%
5%
6%
7%
8%
9%
0
500
1,000
1,500
2,000
2,500
2006 2007 2008 2009 2010 2011F 2012F 2013F
US$ GDP/ Cap (USD) Real GPD growth
8. www.vcsc.com.vn | VCSC<GO> Viet Capital Securities | 8
See important disclosure at the end of this document
All Report Types
Vietnam’s two children policy, which led to more spending on kids, also affects the
consumption of dairy product. All of these factors will keep the industry on its strong
growth path.
Market share Outlook
Vinamilk dominates the yogurt and condensed milk market, with a market share in FY11 of
71% and 88% respectively. We do not expect this will change in the medium future.
Condensed milk has a low margin (est. gross margin of 13%), low growth rate (volume
growth rate from 2-3%) and requires significant capital to manufacture. Friesland seems to
have given up on this product line and small players find it not attractive enough to enter.
Vinamilk with its 88% market has been the leader for this market.
Yogurt involves heavy investment in coolers and chilled transportation vehicles, which will
create a barrier for new entry. With 178,000 sales points and yogurt factories in the north,
south and central of Vietnam, Vinamilk has an advantage for this product, and guarantees
its dominant market share.
The most profitable product line, powdered milk, is lead by Abbot Vietnam with the market
share of 23.8% in FY10, followed by Vinamilk with 18.5%. Foreign companies still
dominate the market, accounting for a 61.4% market share. Vietnamese perception on
imported/foreigner brand is the key reason for the popularity of foreign brands. Vinamilk
targets to increase market share by significantly lower price (lower by 10-30% compare to
international brands) and gradually education of customers’ view by advertisement,
conventions and events. Vinamilk is expecting to gain its target of 35% market share, but
its appears it will takes much longer or a different strategy to change customers’ view.
Figure 11: FY10 Liquid milk market share
Source: EMI
Figure 12: FY10 Powdered milk market share
Source: EMI
Vinamilk
41%
Freisland
25%Nestle Vietnam
7%
Hanoi Milk
5%
Mead Johnson
3%
Fonterra
3%
F&N Vietnam
2%
Others
16%
Abbott
24%
VNM
19%
Mead
Johnson
14%
Freisland
14%
Nestle
9%
Others
20%
9. www.vcsc.com.vn | VCSC<GO> Viet Capital Securities | 9
See important disclosure at the end of this document
All Report Types
Operations
Vinamilk achieved strong revenue growth rate for the past period, CAGR for FY05-FY11 is
25%. Total revenues for FY11 reached US$1 bn. Despite the slow-down, melamine crisis,
and economic downturn, Vinamilk still achieved impressive business results.
Gross and net margin have remained at double-digits since listing in FY06. The gross
margin had been improving from an average of 24.5% for FY05-FY07 to 32.9% for the
period FY08-FY11. Good management and effective inventory policy have kept VNM’s
price very competitive.
Over 200 products to satisfy difference classes of income
Vinamilk possess extensive products under 5 brand names: Vinamilk (liquid milk, yogurt,
ice cream), Vfresh (fruit juice and soy milk), Dielac (powdered milk), Ridielac (nutrition
powdered) and condensed milk and aiming for higher margin value-added products.
Due to health concern, we notice Vinamilk is shifting to more value added products. For
yogurt, Vinamilk came up with Collagen added product, Liquid milk with ADM and
powdered milk with product with adding more nutrition ingredient. VNM has the products
for all income levels with broad packaging products size and flavours.
Figure 13: Vinamilk revenue by segments
Source: Vinamilk
85%
89% 89%
87%
15%
11% 11%
13%
2008 2009 2010 2011
Domestic Sale Export
10. www.vcsc.com.vn | VCSC<GO> Viet Capital Securities | 10
See important disclosure at the end of this document
All Report Types
Figure 14: Vinamilk revenue by products
Source: Vinamilk
Production capacity
Capacity increased steadily with a CAGR of 19.5% for FY07-FY12, total capacity of 1.1mn
tons in FY12 and expect to increase to 1.6mn tons by FY13. In FY11, capacity grew by
38.5% with the operation of its Tien Son factory (with condensed milk, yogurt and liquid
milk). The capacity increased to 1.1mn tons when the Danang factory start to operate in
FY12, adding to the supply of liquid milk and yogurt into Vietnam central market. With
Danang factory, Vinamilk is the first one to have a factory in this part. With a factory in this
area, Vinamilk will make distribution more efficient and strengthen Vinamilk position in
raising cities in central region.
Historically, Vinamilk utilisation rate remained at an average of 70%. With significant
growth of capacity recently, we expect the utilisation rate will be below 60% level and
slowly increase. At the capacity of 1.6mn tons, it will be good enough for Vinamilk in 5
years term.
Figure 15: Vinamilk production capacity
Source: VCSC estimates
29%
24% 21% 18%
27%
31%
32% 35%
29% 27% 29% 28%
13% 15% 16% 16%
2% 3% 2% 3%
2008 2009 2010 2011
Beverage & others
Yoghurt
Powder milk
Liquid milk
Condensed milk
0.52 0.57 0.67
0.93
1.11
1.66
0.0
0.2
0.4
0.6
0.8
1.0
1.2
1.4
1.6
1.8
2008 2009 2010 2011 2012 2013
mn tonnes
11. www.vcsc.com.vn | VCSC<GO> Viet Capital Securities | 11
See important disclosure at the end of this document
All Report Types
Expense analysis
Branding expense reached VND1,232bn in FY11, CAGR is 18.6% for the period FY09-
FY11. In term percentage of net revenue, in FY09, branding expense was 8.2%, dropped
to 6.3% in FY10, and remained stable of 5.7% for FY11 and 9MFY12. Compared with the
growth rate of net revenue for the same period, Vinamilk expenses has been effective
when it brought the CAGR for this period to 42.7%. Without any significant change in
advertisement program, we believe this ratio will remain stable.
Direct cost for selling expenses (advertisement, promotion and commission) accounts
70.3% of the total selling expense in FY09 and remain stable at 68% in FY11 and FY12.
Figure 16: Vinamilk branding expenses
Source: VCSC Vinamilk
Figure 17: Vinamilk selling expenses by category
Source: VCSC Vinamilk
875
990
1,232
1,120
8.2%
6.3%
5.7%
5.7%
0%
1%
2%
3%
4%
5%
6%
7%
8%
9%
0
200
400
600
800
1,000
1,200
1,400
2009 2010 2011 9M2012
VND bn
0%
5%
10%
15%
20%
25%
30%
35%
Labor Material Tools Depr. Logistic Advertise Promotion Comm.
FY09 FY10 FY11
12. www.vcsc.com.vn | VCSC<GO> Viet Capital Securities | 12
See important disclosure at the end of this document
All Report Types
Distribution networks
Vinamilk has the most extensive nationwide distribution network, which cover all 64
provinces. In FY11, the distribution network includes 232 distributors and 178,000 sale
outlets throughout the country (growth of 27% compare to FY10). Vinamilk continue to
expand and strengthen this network to be able to distribute directly to customer especially
in rural area where more than 70% of the population is. Rural area played a key role for
the sharp sale increase in recent years. Vinamilk will make the network more efficient by
building a factory in Danang and Thanh Hoa to strengthen its position in the central part of
Vietnam (none of the competitors have factory in this area).
Vinamilk use both modern and traditional distribution channel. Modern channel is to take
advantage of the increasing urbanization. However, traditional distribution (mom & pop
shops) channel is vital as it accounts for 80% of Vinamilk total sales.
Figure 18: Vinamilk revenue break down by distribution channels
Source: Vinamilk
Figure 19: Vinamilk sale points
Source: Vinamilk
Tradition
channel
80%
Modern
channel
20%
125
135 140
178
0
20
40
60
80
100
120
140
160
180
200
2008 2009 2010 2011
Thousand
13. www.vcsc.com.vn | VCSC<GO> Viet Capital Securities | 13
See important disclosure at the end of this document
All Report Types
Cost driven by imported powdered milk and local milk purchase price
Raw material (powdered milk, local milk price, sugar and so on) fluctuates from 62% to
73% of the COGs, followed by the packaging cost, which account around for 20% and the
rest is production cost and depreciation cost.
Vinamilk is buying 60% of the total fresh milk produced by local farmers. Vinamilk bought
118 mn litres in FY08 and increased to 144 mn litres in FY11. Due to inflation and
increasing production cost from local farm, Vinamilk increased it purchase price each year,
purchase milk price grow at CAGR of 9.4% for FY08-FY12.
Figure 20: Local fresh milk purchase & value
Source: Vinamilk Annual Report
Figure 21: Local fresh milk purchase price
Source: USDA
840
901
1,010
1,454
1,273
118
125 127
144
134
0
20
40
60
80
100
120
140
160
0
200
400
600
800
1,000
1,200
1,400
1,600
2008 2009 2010 2011 10M2012
Mn LitresVND bn
0.2
0.3
0.35 0.35 0.35 0.36
0.51 0.51
0
0.1
0.2
0.3
0.4
0.5
0.6
FY03 FY04 FY06 FY07 FY08 FY09 FY10 FY11
US$/litres
14. www.vcsc.com.vn | VCSC<GO> Viet Capital Securities | 14
See important disclosure at the end of this document
All Report Types
Revenue & Profit Drivers
VNM achieved revenue growth rate at CAGR of 25% for the period from FY05-FY11. Of
this, powdered milk, liquid milk and yogurt had the strongest growth rate, achieving a
CAGR of 42%, 37% and 38% over the same period respectively. VNM has been focusing
more on premium products with better growth rate and better margin. Contribution of
liquid, powdered and yogurt become more important for Vinamilk to sustain growth in
revenue and profit.
Figure 22: Vinamilk revenue forecast by products
Sales (VND bn) FY10 FY11 FY12E FY13E FY14E FY15E FY16E
Condensed milk 3,243 3,945 4,433 4,980 5,595 6,286 7,062
Liquid milk 5,049 7,463 9,183 11,496 14,515 18,481 23,730
Powdered milk 4,526 6,160 7,700 9,625 12,032 14,438 17,326
Yogurt 2,591 3,517 4,516 5,315 6,256 7,364 8,667
Others 343 542 609 684 769 864 970
Total 15,753 21,627 26,441 32,101 39,166 47,433 57,756
Source: VCSC forecast
Condensed milk has the lowest profit margin. We estimate the gross margin is 13%, in
which more than 80% of the COGs is raw materials. Volatility in raw material prices will
affect this product line the most. Liquid milk and yogurt have the gross margin of 35% and
44% respectively. The premium powdered segment has the highest margin of 61%;
however, foreigners dominate this segment. Vinamilk products are in the low-end to
middle-end. We estimate the gross margin for powdered milk is 38%. Those are the three
product lines that Vinamilk focuses on to grow revenues and profits.
Figure 23: Vinamilk gross margin by products
Source: VCSC estimate FY12
13%
35%
44%
28%
61%
0%
10%
20%
30%
40%
50%
60%
70%
Condensed Milk Liquid Milk Yogurt Low-end powder
milk
Premium powder
milk
15. www.vcsc.com.vn | VCSC<GO> Viet Capital Securities | 15
See important disclosure at the end of this document
All Report Types
Liquid milk
On average, liquid milk accounted for 31% of revenue for the past 4 years, reaching 35%
in FY11. Vinamilk is the market leader in this segment with a 40.9% of market share. For
the near term, liquid milk is still the most important driver for revenues and profits.
With the base of UHT milk, in FY11, Vinamilk introduced pasteurized milk and ADM added
milk to penetrate increasing demand for more nutrition & fresh milk. The ADM, which
come in 110 & 180 ml, targets children of hectic families. Demanding for convenience is
the key reasons for recent trend of switching from powdered GUM to read-to-drink white
and flavoured milk. With a historical CAGR for FY06-FY10 of 15.8% and expected CAGR
for FY11-FY15 of 13.1%, liquid milk remains a key growth and profit contributor. With rich
and pioneering products, Vinamilk will grow strong in this segment.
Plain white milk and flavoured milk still dominate the market. However, we do not see
much choice for customers in term of vitamin added products and low fat milk yet. Big
cities account for more than 70% of milk consumption. We had seen Vinamilk launched
ADM added liquid milk; this could be the beginning for a new trend of product series. We
believe VNM could still grow more than 15% in term of volume within this segment.
Figure 24: Vietnam liquid milk market size
Source: EMI
Powdered milk
This is the most attractive segment with high profit margin and strong near-term growth.
Vinamilk has 18.5% of market share in FY10 and contributed an average of 28% of total
revenue in FY08-FY11. Vinamilk targeted a 35% market share in FY11, but failed. The
significant high birth rate in FY12 (golden dragon year) will boost the growth rate in the
near future. CAGR for FY06-FY10 was 18.5%. According to EMI forecast, volume CAGR
for FY11-FY16 is 6.5%, however we expect growth rate will be higher compare to EMI
forecast from the current baby boom.
Parent wants the best products for their newborn child. Vietnamese’s perspective of
imported/ foreigner brand is superior and they are willing to pay higher price for it.
Vinamilk’s strategy of keeping a competitive price (average 10-30% lower compare to
international brand) and promoting the creditability of local brand with the campaign
“Vietnamese use Vietnamese good”, we expect Vinamilk will slowly increase its market
6
7
8
9
11
13
15
17
19
21
0
5
10
15
20
25
2006 2007 2008 2009 2010 2011F 2012F 2013F 2014F 2015F
VND tn
16. www.vcsc.com.vn | VCSC<GO> Viet Capital Securities | 16
See important disclosure at the end of this document
All Report Types
share by 1% each year. Most of the market share will come from the low-end to middle-
end range of products.
Figure 25: Vietnam powdered milk market size
Source: EMI
Yogurt milk
The market grew at CAGR of 7% for FY06-FY11, market size reached VND4tn in FY11.
Vinamilk dominates the market with 71% market share (92% market share of spoonable
yogurt). With more value added products (pre/pro-biotic, collagen product), good brand
name, and actively marketing strategy, segment’s sale achieved average growth rate of
53% for FY09-FY11.
We believe Vinamilk will stay dominant in this market with its current strategy. We expect
revenue growth will remain at 18% for medium term.
Condensed Milk
Vinamilk’s first product line, condensed milk had been the most contributor for VNM in
term of revenue and profit in the past. With long shelf-life and ease to use with boiling
water, it had been widely used as a nutrition food in the past and is now used in coffee/
juice sweetener in the local market. Those are the catalyst for condensed milk to grow
(CAGR for FY05-FY11 is 18%). VNM has 88% of this market, and we expect the growth
rate will be lower due to switching to liquid milk usage. Condensed milk’s revenue
contribution dropped from 28% in FY05 to 18% in FY11, and we expect this trend to
continue in VNM revenue proportion.
Other F&B
The segment is driven by fruit juice and soya milk. Currently, this segment is less
important in terms of revenue and profit; it contributes 1.6% in FY11 revenue. With 22%
market share in the beverage industry, we expect stronger growth rate for the coming
years. However due to the competitive landscape, the margin is low and the market size is
small (Market size is VND950 bn for FY11). To be conservative, we assume the volume
growth rate is 12% for next 5 years.
6
8
9
11
13
14
15
16
17
18
0
2
4
6
8
10
12
14
16
18
20
2006 2007 2008 2009 2010 2011F 2012F 2013F 2014F 2015F
VND tn
17. www.vcsc.com.vn | VCSC<GO> Viet Capital Securities | 17
See important disclosure at the end of this document
All Report Types
Dividend outlook
Historically, VNM has maintained a dividend payout ratio from 30-40%. With current and
future strong cash flow, we believe VNM could remain the dividend per share as VND
3,000 or even increase it in the future.
Figure 26: Dividend forecast
Unit: VND FY08 FY09 FY10 FY11 FY12E FY13E FY14E FY15E
EPS (Basic) 1,585 3,010 4,564 5,288 6,236 7,249 8,882 10,641
Dividend 650 993 1,780 1,692 1,995 3,000 3,000 3,000
Payout ratio 41% 33% 39% 32% 32% 41% 34% 28%
Source: VCSC forecast
With the current price, the dividend yield is 3.5%, but with rich operation cash flow,
Vinamilk could increase future dividend if the management see fit.
Capital spending
Expected capital spending for FY12 is VND4.5tn, of which 65% is to expand production
capacity especially in drinking milk, yogurt and powdered milk. In August FY12, the
Danang factory was put in operation, bring an addition 77,000 tons of liquid milk and
26,000 tons of yogurt. We expect all of its under-construction factory to be operated in
FY13, bringing the total production capacity to 1.67mn tons.
Figure 27: Vinamilk CAPEX plan
CAPEX
Total
Cost
Disburse
FY11
Disburse
FY12
Disburse
FY13-16
Complete
date
Capacity
(tonnes)
Description
(VND bn) (VND bn) (VND bn) (VND bn)
Vietnam Milk Factory 2,349 415 1,651 283 2013
444K-
800K Liquid milk
Dielac 2 Factory 1,906 569 958 379 2013 54K
Powdered milk,
nutrition cereal
Danang Milk 421 204 176 41 2012 104K Liquid milk, Yogurt
Lam Son Dairy 253 47 181 25 2013 83.9K Liquid milk, Yogurt
Vietnam Dairy Cow 2,006 36 646 1,324 2016 - Up to 28K cows
Supply chain upgrade 2,642 1,225 689 728 2016 - Logistics, vehicles
Branch Office,
Warehouse 598 75 233 290 2016 -
Warehouses,
office building
Total 10,175 2,571 4,534 3,070
Source: Vinamilk, VCSC
Capex for the period from FY13-FY16 is VND3tn, so VNM will spend VND871bn annually
for the next 5 years. Most of the capital will be used for vertical investment, which improve
the self-sufficient rate of raw material.
Vinamilk focuses on improving efficiency and minimizing risks in long-run. Vietnam Dairy
cow will help Vinamilk to be proactive for liquid milk requirement. Its investment in New
Zealand based powdered milk producer (VNM bought 19.3% Miraka stake) will help on
stabilizing the import material and improve its brand name in powdered milk (Vietnamese
foreign brand name perspective). If Vinamilk could fulfil its target of having 28,000
(currently Vinamilk has 9,500 cow heads) cows by FY16, it could produce up to 80,000
tonnes of fresh milk and help Vinamilk to self-efficient 25% of fresh milk demand.
18. www.vcsc.com.vn | VCSC<GO> Viet Capital Securities | 18
See important disclosure at the end of this document
All Report Types
Investment on supply chain and warehouse also help Vinamilk’s distribution network,
which is its advantage, to improving information and product flow from Vinamilk to its sale
points. In order to maintain its leading position and manage increasing distribution
network, Vinamilk recognizes its role and continues its investment.
Valuation
We use a combination of P/E, P/B and Discounted Cash Flow methods to come up with
the target price. With stable cash flow and transparent CAPEX, we strongly rely on DCF.
We use the proportion of 15%, 15% and 70% respectively from above three methods. Our
12 months target price is VND106,000 per share.
DCF valuation
Our fair valuation for VNM by using DCF method is VND102,970 for FY12E per share for
core business based on WACC of 15.5% for FY12. We use a terminal growth rate of 3%
and 25% tax rate. Rolling our valuation forward to FY14E, per share value rise to
VND116,298, which implies a rise in valuation of 37.6% over a two year time horizon.
Figure 28: DCF Assumption
DCF Assumption FY12 FY13 FY14
Risk Free Rate 10% 10% 9.8%
Risk Premium 8% 8% 7.8%
Cost of Equity 20% 18% 16.0%
Cost of Debt 20% 18% 16%
FCFF 82,142 84,763 97,013
Per share value 102,970 101,613 116,298
Source: VCSC forecast
P/E and P/B
At the current price of VND 84,500, VNM is trading at PER of 16x and P/B of 5.4x.
Forward PER and PBR for FY12 are 14x and 4.4x respectively. We use target PER and
PBR for Vinamilk at 16x and 4.5x accordingly.
Figure 29: Target price
Multiple
Target
Multiple(x)
FY12E FY13E FY14E
EPS - Adjusted P/E @ 16x 99,769 115,991 142,118
Book value P/B @ 4.5x 86,369 120,492 142,462
DCF target price 102,970 101,613 116,298
Target price 100,000 106,000 124,000
Upside 130,000 18% 25% 47%
Source: VCSC forecast
Since listing in FY06, VNM traded in a PER range of 8x-30x. In term of PBR the lowest is
2.9x and the highest of 8.8x. We believe it is reasonable for VNM to trade on a PER of 16x
and PBR of 4.5x, which is the long-term average. The target price makes sense to
recognize VNM forward growth potential.
Figure 30: EPS Growth
CAGR EPS Growth FY14E/11 FY15E/12 FY15E/13 Average
EPS reported (1.4%) 4.4% 21.7% 8.2%
EPS - Adjusted 19% 20% 22% 20%
Source: VCSC forecast
19. www.vcsc.com.vn | VCSC<GO> Viet Capital Securities | 19
See important disclosure at the end of this document
All Report Types
Comparison with peers
Due to the size and the uniqueness of Vinamilk, we choose its peers as in the F& B sector
within Asia Pacific region. Vinamilk is currently trading at PER of 13.8x, which is lower
compare with the average of 17.2x of its peers, P/B is higher compare to average of 2.8x.
However, in term of ROE of 40.8%, ROA of 33.2% and current dividend yield 3.1%,
Vinamilk is almost twice of the peers average. Strong growth potential, high profit margin
and low relative comparison makes VNM look attractive within the group.
Figure 31: Peer comparables
Index Short Name
Market Cap
(USD mn)
Div.
Yield
(%)
P/E P/B
ROE
(%)
ROA
(%)
1 UNI-PRESIDENT 8,411 1.8 21.2 3.2 15.4 3.5
2 CHAROEN POK FOOD 8,323 3.6 11.0 2.6 26.2 9.6
3 THAI BEVERAGE 8,214 3.6 15.9 3.9 26.3 10.8
4 LUZHOU LAOJIAO-A 7,455 4.2 12.0 5.6 53.1 34.1
5 KUALA LUMPUR KEP 7,240 3.1 19.9 3.1 17.1 10.8
6 CHAROEN POK INDO 5,445 1.3 18.3 6.7 42.3 29.5
7 SHANXI XINGHUA-A 5,147 0.7 24.3 9.2 44.7 27.0
8 INNER MONG YIL-A 5,131 1.2 18.1 4.6 27.8 8.9
9 INDOFOOD SUKSES 5,103 3.1 14.9 2.4 16.9 6.0
10 CHINA MENGNIU DA 4,997 1.1 21.5 2.6 12.9 7.2
11 PPB GROUP BERHAD 4,646 1.7 19.0 1.0 5.3 4.9
12 NISSIN FOODS HOL 4,585 2.4 24.8 1.2 5.0 3.5
13 INDOFOOD CBP SUK 4,417 2.3 20.4 3.9 20.4 13.5
14 UNIVERSAL ROBINA 4,198 1.9 20.3 3.4 12.7 7.8
15 YANTAI CHANGYU-B 4,188 3.6 12.0 4.0 37.1 25.9
16 CJ CHEIL 3,967 0.5 15.1 1.5 11.1 3.5
17 VIET NAM DAIRY P 3,438 3.1 13.8 5.1 40.8 33.2
18 NIPPON MEAT PACK 3,313 1.4 23.6 0.9 3.8 1.8
19 NISSHIN SEIFUN 3,211 1.9 19.2 0.9 4.7 3.3
20 ASTRA AGRO LEST 3,089 4.9 13.4 3.6 27.9 19.6
21 OLAM INTERNATION 3,049 2.6 10.2 1.1 11.7 2.8
22 TOYO SUISAN KAI 2,998 1.8 13.1 1.3 10.0 7.1
23 KIKKOMAN CORP 2,979 1.3 25.0 1.5 6.0 3.1
24 CHINA AGRI-INDUS 2,852 1.5 14.1 0.8 5.9 1.7
25 FIRST RESOURCES 2,656 1.8 10.5 2.5 25.7 15.1
26 THAI UNION FROZE 2,626 2.4 13.1 2.2 18.8 6.5
27 YAMAZAKI BAKING 2,581 1.7 17.4 0.9 5.2 1.9
28 BEIJING DABEIN-A 2,446 0.8 23.8 3.9 17.5 12.9
29 KEWPIE 2,262 1.6 14.3 1.1 7.8 4.4
30 FRASER & NEAVE 2,191 3.6 24.2 4.3 17.6 10.8
31 GRAINCORP LTD-A 2,111 3.9 11.6 1.6 14.1 7.5
32 GENTING PLANTATI 2,089 1.2 18.0 1.9 11.2 8.7
33 BEIJING YAN-A 2,050 2.1 15.1 1.3 9.0 4.8
34 ANHUI GUJINGD-B 2,028 1.4 10.8 2.5 26.1 17.4
35 SMART TBK 2,027 2.9 10.4 2.3 24.4 12.5
36 CP POKPHAND CO L 2,017 4.1 13.6 2.5 26.5 13.2
37 KAGOME 2,007 1.1 23.8 1.7 7.5 4.1
38 HITE JINRO CO 1,929 4.3 21.1 1.4 6.8 2.8
39 LOTTE CONFECTION 1,918 0.3 21.1 0.8 3.8 2.5
40 BIOSTIME INTERNA 1,896 2.0 19.4 6.1 32.9 25.6
41 GUANGDONG HAID-A 1,842 0.8 25.5 4.0 16.6 8.8
Average 3,733 2.2 17.4 2.8 18.5 10.7
Source: Bloomberg
20. www.vcsc.com.vn | VCSC<GO> Viet Capital Securities | 20
See important disclosure at the end of this document
All Report Types
Quarterly Results Summary
Profit & Loss by Quarter
VND billion
2012 1Q12 2Q12 3Q12 4Q12 YTD
Revenues 5,876 7,011 6,6199 6,935 26,441
Gross profit 1,800 2,422 2,342 2,024 8,587
GP margin (%) 31% 35% 35% 29% 32%
Operating profit 1,268 1,662 1,600 1,289 5,818
OP margin (%) 22% 24% 24% 19% 22%
Net profit 1,270 1,506 1,395 1,030 5,202
Net profit margin (%) 22% 21% 21% 15% 20%
2011 1Q11 2Q11 3Q11 4Q11 YTD
Revenues 4,535 5,420 5,697 5,975 21,627
Gross profit 1,509 1,702 1,673 1,704 6,588
GP margin (%) 33% 31% 29% 29% 30%
Operating profit 1,078 1,169 1,049 1,021 4,317
OP margin (%) 24% 22% 18% 17% 20%
Net profit 1,006 1,107 1,062 1,042 4,218
Net profit margin (%) 22% 20% 19% 17% 20%
2012 vs. 2011 1Q YoY % 2Q YoY % 3Q YoY % 4Q YoY % YoY %
Revenues 30% 29% 16% 16% 22%
Gross profit 19% 42% 40% 19% 30%
Operating profit 18% 42% 53% 26% 35%
Net profit 26% 36% 31% -1% 23%
Source: Vinamilk financial statements
22. www.vcsc.com.vn | VCSC<GO> Viet Capital Securities | 22
See important disclosure at the end of this document
All Report Types
Analyst Certification
I, Anh Nguyen, hereby certify that the views expressed in this report accurately reflect my personal views about
the subject securities or issuers. I also certify that no part of my compensation was, is, or will be, directly or
indirectly, related to the specific recommendations or views expressed in this report. The equity research
analysts responsible for the preparation of this report receive compensation based upon various factors,
including the quality and accuracy of research, client feedback, competitive factors, and overall firm revenues,
which include revenues from, among other business units, Institutional Equities and Investment Banking.
VCSC Rating System and Valuation Methodology
Absolute performance, long term (fundamental) rating key: The recommendation is based on implied
absolute upside/downside for the stock from the target price, defined as (target price – current price)/current
price, and is not related to market performance. This structure applies from 1 November 2010.
Equity rating key Definition
BUY If the target price is 20% higher than the market price
ADD If the target price is 10-20% higher than the market price
HOLD If the target price is 10% below or 10% above the market price
REDUCE If the target price is 10-20% lower than the market price
SELL If the target price is 20% lower than the market price
NOT RATED The company is or may be covered by the Research Department but no rating or
target price is assigned either voluntarily or to comply with applicable regulation
and/or firm policies in certain circumstances, including when VCSC is acting in an
advisory capacity in a merger or strategic transaction involving the company.
RATING SUSPENDED The investment rating and target price for this stock have been suspended as there is
not a sufficient fundamental basis for determining an investment rating or target. The
previous investment rating and target price, if any, are no longer in effect for this
stock.
Unless otherwise specified, these performance parameters only reflect capital appreciation and are set with a 12-
month horizon. Future price volatility may cause temporary mismatch between upside/downside for a stock
based on market price and the formal recommendation, thus these performance parameters should be
interpreted flexibly.
Small Cap Research: VCSC Research covers companies with a market capitalisation of up to USD50mn,
inclusively. Clients should note that coverage may not be consistent and that VCSC may drop coverage of small
caps at any time without notice.
Target price: In most cases, the target price will equal the analyst's assessment of the current fair value of the
stock. The target price is the level the stock should currently trade at if the market were to accept the analyst's
view of the stock, provided the necessary catalysts were in place to effect this change in perception within the
performance horizon. However, if the analyst doesn't think the market will reassess the stock over the specified
time horizon due to a lack of events or catalysts, then the target price may differ from fair value. In most cases,
therefore, our recommendation is an assessment of the mismatch between current market price and our
assessment of current fair value.
Valuation Methodology: To derive the target price, the analyst may use different valuation methods, including,
but not limited to, discounted free cash-flow and comparative analysis. The selection of methods depends on the
industry, the company, the nature of the stock and other circumstances. Company valuations are based on a
single or a combination of one of the following valuation methods: 1) Multiple-based models (P/E, P/cash flow,
EV/sales, EV/EBIT, EV/EBITA, EV/EBITDA), peer-group comparisons, and historical valuation approaches; 2)
Discount models (DCF, DVMA, DDM); 3) Break-up value approaches or asset-based evaluation methods;
and 4) Economic profit approaches (Residual Income, EVA). Valuation models are dependent on
macroeconomic factors, such as GDP growth, interest rates, exchange rates, raw materials, on other
assumptions about the economy, as well as risks inherent to the company under review. Furthermore, market
sentiment may affect the valuation of companies. Valuations are also based on expectations that might change
rapidly and without notice, depending on developments specific to individual industries.
Risks: Past performance is not necessarily indicative of future results. Foreign currency rates of exchange may
adversely affect the value, price or income of any security or related instrument mentioned in this report. For
investment advice, trade execution or other enquiries, clients should contact their local sales representative.
23. www.vcsc.com.vn | VCSC<GO> Viet Capital Securities | 23
See important disclosure at the end of this document
All Report Types
Contacts
Head office
Bitexco 15
th
Floor, 2 Hai Trieu, District 1, HCMC
+84 8 3914 3588
Transaction office
136 Ham Nghi, District 1, HCMC
+84 8 3914 3588
Hanoi branch
109 Tran Hung Dao, Hoan Kiem District, Hanoi
+84 4 6262 6999
Transaction office
236 - 238 Nguyen Cong Tru, District 1, HCMC
+84 8 3914 3588
Research
Head of Research
Robert Zielinski, ext 145
robert.zielinski@vcsc.com.vn
Senior Manager, Mr. Tu Vu, ext 105
Manager, Ms. Phuong Ton, ext 146
Senior Analyst, Ms. Hoa Dinh, ext 140
Senior Analyst, Mr. Huy Nguyen, ext 139
Senior Analyst, Mr. The Anh Nguyen, ext 194
Research Team
+84 8 3914 3588
research@vcsc.com.vn
Analyst, Ms. Ly Vu, ext 147
Analyst, Mr. Viet Vu, ext 143
Analyst, Ms. Duong Pham, ext 130
Analyst, Ms. Trang Nguyen, ext 116
Macro Analyst, Mr. Phong Nguyen, ext 120
Technical Analyst, Mr. Minh Nguyen, ext 142
Institutional Sales & Brokerage
& Foreign Individuals
Head of Institutional Sales
Michel Tosto, M.Sc.
+84 8 3914 3588, ext 102
michel.tosto@vcsc.com.vn
Vietnamese Sales
Nguyen Quoc Dung
+84 8 3914 3588, ext 136
dung.nguyen@vcsc.com.vn
Retail & Corporate Sales & Brokerage
Ho Chi Minh City
Quynh Chau
+84 8 3914 3588, ext 222
quynh.chau@vcsc.com.vn
Hanoi
Quang Nguyen
+84 4 6262 6999, ext 312
quang.nguyen@vcsc.com.vn
Disclaimer
Copyright 2012 Viet Capital Securities Company. All rights reserved. This report has been prepared on the basis
of information believed to be reliable at the time of publication. VCSC makes no representation or warranty
regarding the completeness and accuracy of such information. Opinions, estimates and projection expressed in
this report represent the current views of the author at the date of publication only. They do not necessarily
reflect the opinions of VCSC and are subject to change without notice. This report is provided, for information
purposes only, to institutional investor and retail clients of VCSC, and does not constitute an offer or solicitation
to buy or sell any securities discussed herein in any jurisdiction. Investors must make their investment decisions
based upon independent advice subject to their particular financial situation and investment objectives. This
report may not be copied, reproduced, published or redistributed by any person for any purpose without the
written permission of an authorized representative of VCSC. Please cite sources when quoting.
History of Recommendation
Date Recommendation Closing price Target price
19 Dec 2012 Buy 84,500 106,000