Vegetable Market Performance in Smallholders Production System: The Case of Lake Tana Basin, Ethiopia

Lake Tana basin is one of the most potential vegetable production areas in Ethiopia. However, production in this region has been carried out at smallholders’ level with poor marketing infrastructure. Hence, this study was aimed to examine the structure and performance of vegetable marketing in the Lake Tana basin. Multistage random sampling mixed with non probability sampling techniques were employed to collect data from 385 smallholder vegetable producing farmers and 107 vegetable traders from three districts and two major town markets. Data were analyzed using market structure and performance indicators. The result of the analysis showed that market structure in the study area could be characterized by weak oligopolistic market with little chance of market participants to influence market price. Storage loss and transport cost were found the two largest cost components of vegetable marketing in the study area. Net marketing margin and producers’ share of the consumers’ price could be improved by shortening the distance between the producer and urban consumer or reducing the intermediaries involved. Establishing farmers’ group marketing with communication access together with least cost storage and transport technologies should be encouraged to improve vegetable marketing performance.

Empfohlen
Empfohlen
Weitere ähnliche Inhalte
Was ist angesagt?
Was ist angesagt? (19)
Ähnlich wie Vegetable Market Performance in Smallholders Production System: The Case of Lake Tana Basin, Ethiopia
Ähnlich wie Vegetable Market Performance in Smallholders Production System: The Case of Lake Tana Basin, Ethiopia (20)
Mehr von Business, Management and Economics Research
Mehr von Business, Management and Economics Research (20)
Kürzlich hochgeladen
Kürzlich hochgeladen (20)
Vegetable Market Performance in Smallholders Production System: The Case of Lake Tana Basin, Ethiopia
- 1. Business, Management and Economics Research ISSN(e): 2412-1770, ISSN(p): 2413-855X Vol. 5, Issue. 3, pp: 40-48, 2019 URL: https://arpgweb.com/journal/journal/8 DOI: https://doi.org/10.32861/bmer.53.40.48 Academic Research Publishing Group *Corresponding Author 40 Original Research Open Access Vegetable Market Performance in Smallholders Production System: The Case of Lake Tana Basin, Ethiopia Marelign Adugna* School of Agricultural Economics and Agribusiness Management, Haramaya University, Ethiopia Mengistu Ketema School of Agricultural Economics and Agribusiness Management, Haramaya University, Ethiopia Degye Goshu Department of Economics, Kotebe Metropolitan University, Addis Ababa, Ethiopia Sisay Debebe Kaba Department of Rural Development and Agricultural Extension, Arba Minch University, Ethiopia Abstract Lake Tana basin is one of the most potential vegetable production areas in Ethiopia. However, production in this region has been carried out at smallholders’ level with poor marketing infrastructure. Hence, this study was aimed to examine the structure and performance of vegetable marketing in the Lake Tana basin. Multistage random sampling mixed with non probability sampling techniques were employed to collect data from 385 smallholder vegetable producing farmers and 107 vegetable traders from three districts and two major town markets. Data were analyzed using market structure and performance indicators. The result of the analysis showed that market structure in the study area could be characterized by weak oligopolistic market with little chance of market participants to influence market price. Storage loss and transport cost were found the two largest cost components of vegetable marketing in the study area. Net marketing margin and producers’ share of the consumers’ price could be improved by shortening the distance between the producer and urban consumer or reducing the intermediaries involved. Establishing farmers’ group marketing with communication access together with least cost storage and transport technologies should be encouraged to improve vegetable marketing performance. Keywords: Market structure; Performance; Vegetable; Lake Tana basin. CC BY: Creative Commons Attribution License 4.0 1. Background Fruits and vegetables play vital roles in human health. The production of fruits and vegetables also give an opportunity for intensive production. It allows intensive use of land, utilizes more labour resources, increases smallholder farmers' market participation and reduces risk of crop failure (Bezabih and Hadera, 2007; Joosten et al., 2015). In addition, small-scale fruit and vegetable production also plays an important role in employment and income generation, poverty alleviation and livelihood security of the rural population thereby reinforcing the overall development and poverty reduction goals (Heinemann, 2002; Joosten et al., 2015; Musasa et al., 2013). Ethiopia has favorable agro-climatic conditions for the production of a number of vegetable crops. However, the sub-sector is dominated by subsistence oriented, low input/low output, and rain-fed farming (Ethiopian Agricultural Transformation Agency, 2015). In addition, most small scale vegetable growers are constrained with marketing problems such as low bargaining power, low price, imperfect pricing system, poor infrastructure, poor product handling and storage facilities, and lack of market information (Bezabih and Hadera, 2007; Moti, 2007; Nigatu et al., 2010). Hence, production and consumption of vegetables in Ethiopia in general and the study area in particular have been very low. For example, the food consumption survey done by EPHI (Ethiopian Public Health Institute) (2013) pointed out that Amhara region, where Lake Taba basin is found, was the least in Vitamin A intake compared to other regions of the country. Lake Tana basin is situated far from the central market, Addis Ababa, and there exists poor market infrastructure in terms of road and communication services. These features of the study area may exacerbate marketing problems of smallholder vegetable producers. Hence, this study attempt to address problems associated with vegetable marketing through examining the structure and performance of vegetable market in the study area. The result of the study can provide policy options, which would change structural variables that lead to improvement in market performance which in turn facilitate innovations for further improvement in production and consumption growth in the vegetable subsector. 2. Literature Review 2.1. Theory of Market Structure, Conduct and Performance (SCP) The SCP paradigm is based on neoclassical microeconomic theory, in particular the comparison of perfect competition and monopoly. According to the original SCP paradigm, a market structure characterized by low seller
- 2. Business, Management and Economics Research 41 concentration, a homogeneous product and free entry to and exit from the market (approaching the neoclassical model of perfect competition) leave firms little choice of market conduct. They are price takers, determine their output quantities by setting marginal cost equal to price, must produce efficiently and make only normal profits in the long run. By contrast, a market structure typified by high seller concentration, products that differ appreciably from those of competitors and limited entry to the market (approaching the monopoly model) leave the firm or firms in the market a greater choice of market conduct. Such a firm is regarded as a price maker who chooses the quantity supplied by equating marginal cost with marginal revenue and sets the corresponding market price. The price exceeds marginal cost and the firm may make abnormal profits in the long run, need not maximize profit and can choose not to produce efficiently (within limits) (Pisanie, 2013). Hence, competitive markets facilitate allocative efficiency and provide incentives for efficient production and exhibit downward pressure on prices and costs. If not competitive, industries do not exhibit these benefits on society (Hanekom et al., 2011). The SCP approach postulates that as market structure deviates away from the paradigm of perfect competition as characterized above, the extent of competitiveness of the market will decrease; and consequently a decline in market efficiency will take place (Scarborough and Kydd, 1992; Scott, 1995). As a method for analysis, the SCP paradigm postulates there exists a relationship between market structure, conduct and performance. One can imagine a causal relations starting from the structure, which determine the conduct, which together determine the performance of agricultural marketing system in developing countries (Meijer, 1994). In the views of some analyst, the chain relationship is not necessary unidirectional. It may also be bi- directional in the sense of reverse causation. That is, the performance of the industry may influence the structure of the industry (performance-conduct- structure approach) (Nyong, 1990; Pickering, 1974). According to the SCP model, the way in which firms are organized in the market structure tells a great deal about how they make decisions about conduct, this, in turn changes the level of efficiency and fairness in the market performance (Seperich et al., 1994). Market conduct refers to the behavior of firms or the strategy they use with respect to, for example, pricing, buying, selling, etc., which may take the form of informal cooperation or collusion. Market conduct mainly focuses on firms’ policies towards its market and towards the moves made by its rivals in that market. Under market conduct the main areas of interest are on setting quality, prices, discouraging new entrants or coercing rivals using predatory pricing, mergers and acquisitions, collusion (both explicit or tacit), legal tactics and pricing strategies or other means of entry deterrence (Ferguson and Ferguson, 1994). As it is indicated above, the causality between structure and conduct can run the other way round i.e. firm’s conduct (e.g. predatory behavior or entry deterrence) can shape the market structure within which the firm operates in (Lee, 2007). Ferguson and Ferguson (1994), also indicated that the traditional premise that market structure is exogenously determined by demand and supply factors is unsound. Performance and more particularly conduct affects structure. For instance, mergers directly affect the number and size distribution of firms in a market, innovation and advertising may raise entry barriers, predatory pricing could force competitors out of the market. If market structure gives rise to conduct which raises prices and enhances profits, then this may attract entry, modifying the structure of the market. Market performance is the results of market conduct which include prices, profits and losses, product and service volumes and qualities, product innovation, technical and economic progress, diffusion of benefits of progress, and other events (Pritchard, 1969). Market performance is also taken a result of pricing and operational efficiency. Markets are efficient when the ratio of the value of output to the value of input throughout the marketing system is maximized (Abbot and Makeham, 1981). 2.2. Measures of Market Structure, Conduct and Performance Market structure can be identified by considering the number and size distribution of buyers and sellers (market concentration), the extent to which products are differentiated, the conditions of entry and exit and the extent to which firms are integrated or diversified (Ferguson and Ferguson, 1994). Market concentration is one of the most commonly used measures of market structure. It is calculated by determining the number of buyers and sellers in the industry, as well as how the market power is shared among them. Possibly the best known measures of seller or buyer concentration are the X-firm concentration ratio and the Herfindahl-Hirschman index (Pisanie, 2013). The X-firm concentration ratio measures the market share of the largest X sellers or buyers in a market and is abbreviated CRX, where X can be 3, 4, 5 or another number. Kohls and Uhl (1985) suggested that a four-firm concentration ratio (CR4), that is, the market share of the largest four firms, of less than or equal to 33% is generally indicative of a competitive market structure, while a concentration ratio of 33% to 50% and above 50% may indicate a weak and strongly oligopolistic market structures, respectively. The disadvantage of this measure of market structure is that when there are small numbers of firms, it might be difficult to determine (Marfels, 1975). In addition, the concentration ratio presents an incomplete picture of the concentration of firms in an industry because by definition it does not use the market shares of all the firms in the industry. It also does not provide information about the distribution of firm size (Barthwal, 2000). Gini coefficient (GC) is another concentration measure which indicates the inequality of firm sizes in a particular market. It is an aggregate numerical representation of degree of inequality ranging from 0 (perfect equality) to 1 (perfect inequality) in the distribution that is derived directly from Lorenz curve. The higher the value of the coefficient is, the higher the inequality of distribution and vice versa. The main limitation of the coefficient, however, is that it is possibly for two or more entirely different Lorenz Curve to generate quantitatively equal Gini coefficients (Pisanie, 2013). Other concentration measures includes the Horvath index (HI), Rosenbluth index (RI), the occupancy count, the entropy coefficient and the relative entropy coefficient. Debates on the choice of which concentration measures to be
- 3. Business, Management and Economics Research 42 used have revolved around correlation between the different measures and the sensitivity of these measures to changes in the number of firms and market shares (Lee, 2007). The performance of a marketing system could be evaluated in terms of how well the agricultural and food marketing system performs what society and the market participants expect of it. Several contrasting measures which are commonly used in assessing the performance of a marketing system are trends in retail food prices, the farmer's/grower's share of the consumer’s food dollar, the gross marketing margin or farm-retail price spread, and the proportion of a consumer's income which must be spent on food (FAO Food and Agriculture Organization, 2006; Kohls and Uhl, 2002; Rhodes, 1983). 3. Research Methodology 3.1. Description of the Study Area The geographical location of the Lake Tana basin extends from 10.950 N to 12.780 N latitudes and from 36.980 E to 38.250 E longitudes. It is found in North-west part of Ethiopia, Blue Nile Basin having a drainage area of around 15,000 km2 among which around 20% is covered by the Lake Tana (Steenhuis et al., 2009), the largest lake in Ethiopia and the third largest in the Nile Basin. Lake Cultivation practices are primitive, and crop production and livestock rearing are closely integrated. This basin is of critical national significance as it has great potentials for irrigation; hydroelectric power; high value crops and livestock production; ecotourism and others. The Basin is one the major horticulture development corridors in Ethiopia with 25,000 hectare of land suitable for horticulture (fruits, vegetables and flowers) production EHDA (Ethiopian Horticulture Development Agency) (2012). 3.2. Sampling Techniques and Sample Size Multi-stage sampling that involves a combination of probability and non-probability sampling techniques were employed to select respondents from vegetables producing farmers, and traders. At the first stage, among fourteen districts, located in the basin, three districts namely Takusa, Libo Kemkem and South Achefer were selected randomly to undertake formal survey on vegetable farming households. At the second stage, four peasant administrations reside in the basin from each of the three districts were selected randomly. Lastly, depending on the number of vegetable producing households in selected peasant administrations, about 385 vegetable producing households were randomly drawn. In addition to vegetable producer households, 107 vegetable traders were chosen from selected district towns and Bahir Dar and Gondar urban centers using non probability convenient sampling method. Sample size for producer farmers was determined following (Cochran, 1963) assuming a large population and maximum variability in the proportion of the attributes, and with a desired 95% confidence level and ±5% precision, the resulting sample size was: 2 2 e pqZ N = 385 05. 5.5.96.1 2 2 Vegetables producer farmers (1) 3.3. Data Sources and Method of Data Collection Combinations of quantitative and qualitative data from both secondary and primary sources were used for this study. Primary data were collected through in-depth interview of farmers, assemblers, wholesalers, retailers, and key informants. Pretested semi-structured face-to-face interview, rapid market appraisal methods and observational surveys were employed. 3.4. Methods of Data analysis The study demand both descriptive and inferential statistics. The cross-sectional data collected from sample respondents were analyzed with descriptive and inferential statistics such as mean, percent, standard deviation, t-test, F-test and Chi-square test followed by market concentration ratios and marketing margin analysis. The most popular and simplest index for measurement of market concentration is the use of concentration ratio i.e. the share of the market held by a small number of largest firms. It is calculated as r i iSC 1 (2) Where, C= Concentration ratio r = the number of largest firms for which the ratio is calculated. Si= the percentage market shares of th i firm. The market shares were calculated based on quantities of vegetables handled by each wholesaler as follows: n i i i i V V S 1 (3) Where, iV is the quantity of vegetables handled by firm i (in quintal),
- 4. Business, Management and Economics Research 43 n i iV 1 is the total quantity of vegetables handled by firms in the market (in quintal) and n is the number of firms in the market. The higher the concentration ratio means the greater the monopoly power or market concentration existing in the industry. Gini coefficient is another market concentration measure used in this study. Gini coefficients were computed by using the following formula according to Okereke and Anthonio (1988). XYG 1 (4) Where: G = value of Gini coefficient. X = percentage of market participants (wholesalers) Y = cumulative of purchase Marketing margins were also calculated using the following formula: 100) Pr (arg priceConsumer priceoducerpriceConsumer inMMarketingGrossTotal (5) Producers’ share is the portion of the price paid by the consumer that goes to the producer. It was calculated as: 100) arg ('Pr priceConsumer inMMarketingGrosspriceConsumer shareoducers (6) Gross margin for each category of participants other than the producer in the marketing channel was also calculated using the formula: 100)(arg priceconsumer pricePurchasepriceSelling inMGross (7) Net margins/earnings of various market agencies involved in the marketing of vegetables was computed with the following formula. tMarketinginMGrossinMNet cosargarg (8) 4. Results and Discussion 4.1. Market Structure Vegetable supplier farmers were found large in number and individually small in size in terms of volume of supply. Thus, the individual producers have no power to influence the market. The retailers were also characterized by large numbers of almost comparable volume of trade. Assemblers were also relatively large in number in the market with lower purchase capacity compared to wholesalers. Wholesalers on the other hand were found few in number. Only 7, 10 and 8 vegetable wholesalers were found in sample district towns; Deligi, Addis Zemen and Durbete, respectively. Hence, vegetable market concentration could exist in the wholesalers market. Using concentration ratio method, the market share of the largest four wholesale firms (CR4) of the district markets was estimated and found to be 0.40 which is an indication of a weak oligopoly market structure. Concentration ratios of vegetable wholesale market at each district market were also estimated. It was found to be 0.81, 0.66 and 0.68 in Delgi, Adis Zemen and Durbete town markets, respectively (Table 1).This result shows high level of market concentration, but it could be due to small number of wholesalers in each market. When the numbers of firms are small in an industry, it is difficult to determine market structure using concentration ratio (Marfels, 1975). Given the smaller number of wholesalers in the vegetable market at district level, results of CR4 could be weak as a measure of market concentration. To check the robustness of these results, inequality of wholesalers’ volume of business, considering the market shares of all wholesalers were estimated using Gini coefficient. Gini coefficient of the wholesalers of the district markets were found to be 0.39 which is an indicator of weak inequality among vegetable wholesalers. Inequality among vegetable wholesalers’ volume of weekly purchases at each district town markets were also calculated. The result as shown in Table 1 is 0.36, 0.32 and 0.22 at Delgi, Addis Zemen and Durbete market, respectively. These figure show that there is no indication of monopoly vegetable market structure at each market. Considering the results in both concentration ratio and Gini coefficient methods it could be possible to conclude that there is a weak oligopoly vegetable market structure in the study area. Table-1. CR4 and Gini coefficient results of specific markets Market place No of wholesalers CR4 Gini coefficient Delgi 7 0.81 0.36 Adiss Zemen 10 0.66 0.32 Durebete 8 0.68 0.22 Total 25 0.40 0.39 Source: Computed from survey data
- 5. Business, Management and Economics Research 44 The findings also showed that there were no statutory barriers to enter in to or exit from vegetable business. About 84 percent of traders responded that the procedure to obtain trade license is too easy. No any quota levied on traders of this business. However, there are barriers related to the nature of the crops. Most traders (88.5%) responded that risk of loss due to the perishable nature of the crop were refrained them from entry into this industry. Lack of sufficient capital was considered by large percentage of traders (78%) followed by poor information access (56%). Tough competition from established firms was also considered by 51percent of the respondent traders, and 43.8 percent believed lack of suitable site for vegetable trade as problem of entry (Table 2). Table-2.Traders’ responses on market entry barriers Entry barriers Proportion of respondents Risk of loss 88.5 Capital shortage 78.1 Lack of access to information 56.3 Fear of competition 51.0 Lack of suitable place 43.8 Long license procedure 15.6 Unlawful payment for officials 13.5 Source: Computed from survey data 4.2. Market Conduct Under market conduct analysis price setting, group formation, buying and selling behaviors of traders are discussed. 4.2.1. Price Setting and Buying Behavior In the study area, bargaining is the most common method of setting price of vegetable transaction as mentioned by 51.4 percent of traders. About 13 percent of respondent traders replied that price of vegetable is set by sellers while 12 percent of them responded buyers set final price of vegetables. No predetermined price exercised in the study market. Brokers also negotiate producer farmers with wholesalers and assemblers. However, information on group discussion with farmers and key informants indicated that wholesalers could easily get up-to-date price information from their distant partners in Addis Ababa or Mekelle market while farmers could not. Because of this price information asymmetry, wholesalers are able negotiate better and could set lower price in the production area while it was not in other markets. Although there is no any formal marketing group or price collusion and discrimination at all level of the marketing channel, at Addis Zemen specific market, wholesalers and assemblers together with brokers were found to make instant informal grouping at a specific market day during peak production season. In this specific market, it is this group (brokers together with the town traders) who exclusively determine a specific market day vegetable (onion, tomato and garlic) price. Farmers could not act together may be because they are large in number with variety of interest, the risk of quality loss if vegetable remain unsold for some days even hours, and high cost of group formation. These actions may weaken the bargaining power of farmers and forced to sell at lower price in their localities. Encouraging farmers to form group marketing would reduce traders and brokers misconduct on pricing in the market. 4.2.2. Buying and Selling Strategy Traders may have different buying and selling strategy to expel the existing firms or protect new entrants through influencing on pricing or seizing large market share. In this study, traders prefer to transact with long-term customers, relatives and friendship, and use brokers or contracts to increase volume of transaction. For example as shown in Table 3, about 41 percent of traders preferred to purchase vegetables from their long-term customers, and 8.3 percent chose to frequently contact with friends and relatives as a strategy to increase volume of purchase. Contractual purchase was considered as a buying strategy by few traders perhaps due to the existence of poor contract enforcement mechanisms. Only 4.2 percent of traders preferred to purchase vegetables through contractual arrangement. About 26 percent of traders preferred to use brokers from which 80 percent of them were wholesaler and the rest were assemblers. In addition, buyers, specifically wholesalers and assemblers, used to visit the farmers village to assess the availability of produces and the possible sellers. Table-3. Proportion of traders with different buying and selling strategy Buying strategy Percent (n=96) Selling strategy Percent (n=96) Contract 4.2 Transact with same religion 5.2 Through brokers 26.0 Transact with same origin 1.0 Attached with long-term customers 40.6 Attached with long-term customers 43.8 Use friends and relatives 8.3 Use friends and relatives 43.8 No specific strategy 28.1 No specific strategy 15.6 Source: Computed from survey data
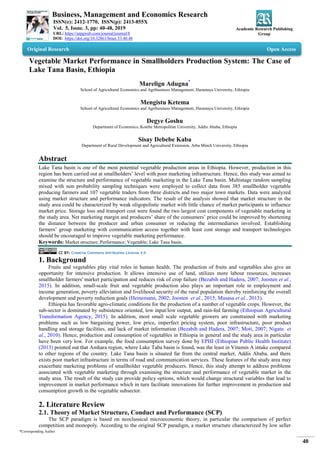
- 6. Business, Management and Economics Research 45 From the above buying and selling practices of traders, it is difficult to conclude that there is coercive attempt to expel the existing traders or halt the new entrants. No one was found to influence over pricing. Hence, it is possible to conclude that buying and selling strategies of traders in the study area resemble the behavior of the competitive market among traders. 4.3. Market Performance Some of the vegetable crops such as cabbage, potato and pepper marketing channels in the study area are direct; from farmers to consumers and farmers --retailers--consumers channel. Onion, garlic and tomato vegetable crops, however, show relatively complex marketing system, involving a number of actors as the crops move from producer to final consumer. Despite the involvement of various actors, the marketing channels indicated very limited value addition along the channel. The sampled farmers produced 1468.4tons of vegetables in the survey production year. They sold 88 percent of the produce to different market participants indicating that vegetable crops are highly marketable crops. The discussion below focused on onion vegetable crops marketing channel performance. The total volume of onion supplied to the market by sample producers was 2377.35 quintals in the study period production season. Of this, 41 percent sold outside the study area (Addis Ababa, Dessie, Woldiya, Tigray, and Oromiya) indicating the presence of significant demand outside the study area and 59 percent consumed within the study area including Gondar and Bahirdar urban markets. Although marketing channel of onion were found complex, about 10 alternative marketing channels ending inside the study area, and four marketing channels ending outside the study area were identified (Figure 1).The shortest channel is the channel where farmers directly sell to consumers. The longest channel starts from collection of the produce by assemblers from farmers at different market points, and passed it through district wholesalers, regional wholesalers, retailers and finally to consumers. Wholesalers from GB (Bahirdar and Gondar) as well as outside the study area are also important participants in onion marketing for which significant proportion (60%) of the produce passed through them. About 66.9 percent of onion handled by district wholesalers was channeled to outside the study area followed by 17.3 percent handled by assemblers. A small proportion of onion (7.2%) handled by farmers are directly sold to outside the region indicating that farmers do not have easy access of the outside the study area markets such as Addis Ababa, Desie, Mekele and Oromiya region where better price of the produce are expected. Figure-1. Onion marketing channels Source: Computed from survey data The largest marketing cost component identified was loss during storage or cost due to perishability (36.2%) followed by transport cost which accounts up to 21.5 percent of the total marketing cost. The relative importance of these costs also depends on the type of channels or the type of participants of the marketing chain. As depicted in Table 4, cost of transport for GB wholesalers was the highest relative to cost of perishability. This is because GB wholesalers need to collect the produce from relatively distant district market participants perhaps with rough road like Takusa district where no asphalted road is available. Miscellaneous costs such as water and electricity, guard and telephone per quintal bases for retailers are relatively larger than miscellaneous costs for assemblers and wholesalers. This is because the volumes of sale of retailers are relatively small indicating that bulk purchase could reduce marketing cost per unit. On aggregate, onion marketing costs for GB wholesalers are the largest followed by
- 7. Business, Management and Economics Research 46 district wholesalers which were 133.2 and 115.8 Birr per quintal indicating that as the distance between the producer and market participants get apart, cost of marketing tends to increase. Table-4. Onion marketing cost components (Birr/Qt) of traders Cost items Types of traders Total Assemblers District wholesaler GB wholesaler Retailer GB-retailer Transport 21.9 (28) 32.60(28.2) 42 (31.5) 4.7 (8.3) 4.4 (5.8) 19.5(21.5) Container 12.5(16) 12.6 (10.9) 19.5 (14.6) 10 (17.6) 10 (13.4) 12.2 (13.5) Loading 3(3.8) 4.7 (4.1) 5.5 (4.1) 0 0 4.3 (4.7) Unloading 4.8(6.1) 4.5 (3.9) 5.5 (4.1) 0 0 4.8(5.3) Storage loss 25.8 (32.9) 43.8 (37.8) 25.9 (19.4) 27 (46.7) 43.9(58.9) 32.8 (36.2) Store rent 3 (3.8) 5.9(5.1) 20.7(15.5) 8.1 (14.2) 6.52 (8.8) 7.5(8.3) Broker fee 2.9 (3.7) 5.5 (4.7) 8.4(6.3) 0 0 2.9(3.2) Phone cost 3.02 (3.9) 3.70 (3.2) 3.20 (2.4) 3.71 (6.5) 3.61 (4.8) 3.5(3.9) Guard fee 1.02 (1.3) 1.78 (1.5) 1.36 (1.0) 2.48 (4.4) 3.40 (4.6) 2.0(2.2) Water & electricity 0.47 (0.6) 0.66 (0.6) 1.25 (0.9) 1.34 (2.4) 2.69 (3.6) 1.1(1.2) Total MC 78.35 115.75 133.20 56.93 74.47 90.6 Note: Figures in parenthesis are percent Source: Computed from the survey Looking in to the total marketing costs of each channel, the largest marketing cost, 401.80 Birr per quintal, is shown in channel 6 where all of the intermediaries are involved in the channel (Table 5). The lowest marketing costs are found in the shortest channel (channel 2 and 3) ending in district markets where transport and handling costs are minimal. The size of the marketing costs therefore, depends on the number of links in the chain and the costs incurred in handling, and transporting the produce. Gross marketing margins are directly related to the size of the marketing costs in each channel. As indicated in Table 5, channel 6, 7 and 8 have highest marketing costs and at the same time these channels have highest gross margins, and channel 2 and 3 have lowest marketing costs with lowest gross marketing margins. These direct relationships indicated that prices are directly related to the costs incurred through the channel. However, the net margins in the channel do not necessarily seem to be directly related to the total marketing costs. The highest net margin (342.30 Birr/quintal) is observed in channel 10 where GB wholesalers directly link with farmers and urban retailers indicating that GB market prices are more than repay marketing costs. Hence, net marketing margin could be improved by shortening the linkage between producers and urban consumers. Table-5. Marketing costs, margins and producers shares of each marketing channels for onion crop Note: SP = selling price, MC = marketing cost, NM = net margin, MM = marketing margin Figures in parenthesis are percent Source: Computed from survey data 5. Conclusion and Recommendations The results from concentration ratio and Gini coefficient calculations as well as from the evaluation of barriers to entry or exit in vegetable business showed that vegetable market in the study area has weak oligopoly market structure. Buying and selling behaviors of traders are found to be more competitive in nature. However, wholesalers and assemblers together with brokers were found to make instant informal grouping at specific market days to determine vegetable price which is an indication of market misconduct that requires attention of concerned bodies. The result of margin analysis indicated that the net marketing margins and the producers’ share could be improved by shortening the distance between the producer and consumer or reducing the intermediaries involved. The channel, where all the intermediaries are involved brought about highest marketing cost with very small proportion of the produce pass through it, and hence it is the least preferred channel. Hence, linking farmers with urban wholesalers through establishing farmers’ group marketing with communication access together with least cost storage and
- 8. Business, Management and Economics Research 47 transport technologies should be the focus of concerned actors to improve farmers earnings and reduce consumers’ price which together could bring about higher production, consumption and society welfare. Acknowledgements The authors would like to thank Ministry of Education for financial support for this research. Moreover, we thank the sample respondents, enumerators and district experts for their valuable response during data collection process. References: Abbot, J. and Makeham, P. (1981). Agricultural economics and marketing in the tropics. Wing Tai Cheung Printing Co. Ltd: Rome. 58. Barthwal, R. R. (2000). Industrial economics, an introductory text book. New Age International Publisher Delhi. Bezabih, E. and Hadera, G. (2007). Constraints and opportunities of horticultural production and marketing in eastern Ethiopia. Drylands Coordination Group, report, 46. Grensen 9b. Norway. Cochran, W. G. (1963). Sampling techniques. 2nd edn: John Wiley and Sons, Inc: New York. EHDA (Ethiopian Horticulture Development Agency) (2012). Exporting fruit and vegetable from Ethiopia. Assessment of development potentials and investment options in the export-oriented fruit and vegetable sector. Addis Ababa, Ethiopia. EPHI (Ethiopian Public Health Institute) (2013). Ethiopia national food consumption survey. Addis Ababa, Ethiopia. Ethiopian Agricultural Transformation Agency (2015). Agricultural transformation agenda: Progress report covering 2011-15 in the gtp i period. FAO Food and Agriculture Organization (2006). Agricultural and food marketing management. FAO corporate document repository. Available: http://www.fao.org/DOCREP/004/W3240E/W3240E00.HTM Ferguson, P. R. and Ferguson, G. J. (1994). Industrial economics: Issues and perspectives. New York University Press. Hanekom, J. W., Willemse, B. J. and Strydom, D. B., 2011. "Structure, conduct and performance in the South African potato processing industry." In Contributed Paper presented at the Joint 3rd African Association of Agricultural Economists (AAAE) and 48th Agricultural Economists Association of South Africa (AEASA) Conference.Cape Town, South Africa. Heinemann, E. (2002). The role and limitations of producer associations. European Forum for Rural Development Cooperation: Montpellier. Joosten, F., Dijkxhoorn, Y., Sertse, Y. and Ruben, R. (2015). How does the Fruit and Vegetable Sector contribute to Food and Nutrition Security? : University and Researchcentre: Wageningen, LEI Wageningen UR. Kohls, R. L. and Uhl, J. N. (1985). Marketing of agricultural product. Fifth edn: McMillian Publishing Company: NewYork, USA. Kohls, R. L. and Uhl, J. L. (2002). Marketing of agricultural products. 9th edition edn: Prentice-Hall of India Private Limited: New Delhi. Lee, C. (2007). SCP, NEIO and Beyond. Nottingham University Business School. University of Nottingham Malaysia Campus. Working Paper Series 05. Marfels, C. (1975). A bird’s eye view to measures of concentration. The Antitrust Bulletin, 2(3): 485-503. Meijer, P. W. M. (1994). The function of maize market in Benin. Bert Broundjin: Benin. 11-32. Moti, J. (2007). Econometric analysis of horticultural production and marketing in central and eastern ethiopia. Phd dissertation. Wageningen University: The Netherlands. Musasa, S. T., Brighton, M. M., Manditsera, F. A., Chinhanga, J., Musiyandaka, S. and Chigwedere, C. (2013). Postharvest orange losses and small-scale farmers’ perceptions on the loss causes in the fruit value chain: a case study of Rusitu Valley, Zimbabwe. Food Science and Quality Management: Nigatu , A., Hoekstra, D., Kahsay, B. and Moti, J. (2010). Irrigated vegetable promotion and expansion: the case of Ada’a woreda, Oromiya Region. Ethiopia: IPMS Ethiopia. Nyong, M. (1990). Market structure, Risk and profitability in Banking. The Quiet Life Hypothesis and The Relative Economic Efficiency Development Policy Review, 8: 179-201. Okereke, O. and Anthonio, Q. B. O. (1988). The structural characteristics of market for grains in eastern nigeria; in adekanye, t.O. Readings in agricultural marketing. Longman, Ibadan: Nigeria. Pickering, I. F. (1974). Industrial structure and market conduct. Martin Robertson and Co. Ltd.: London. 15. Pisanie, J. D. (2013). Concentration measures as an element in testing the structure-conduct performance paradigm. Economic Research Southern Africa ERSA working paper. 345. Pritchard, N. T. (1969). A framework for analysis of agricultural marketing systems in developing countries. Agric. Economics Res, 21(3): 78-88. Rhodes, V. J. (1983). The agricultural marketing system. 2nd ed edn: John Wiley & sons, Inc.: USA. Scarborough, V. and Kydd, J. (1992). Economic analysis of agricultural markets: A manual. Marketing Series No 5. Natural Resources Institute. University of Greenwich: Chatham, U.K.: 166. Scott, G. J. (1995). Prices, products and people: Analysing agricultural markets in developing countries. Boulder. Lynne Reinner Publishers: London.
- 9. Business, Management and Economics Research 48 Seperich, J., Woolverton, W. and Beierlein, G. (1994). Introduction to agribusiness marketing. Prentice Hall Career & Technology: New Jersey. Steenhuis, T. S., Collick, A. S., Easton, Z. M., Leggesse, E. S., Bayabil, H. K., White, E. D., Awulachew, S. B., Adgo, E. and Ahmed, A. A. (2009). Predicting discharge and sediment for the abay (blue nile) with a simple model. Hydrological Processes, 23(26): 3728-37.