SlideShare ist ein Scribd-Unternehmen logo
1 von 4
Downloaden Sie, um offline zu lesen
1033 Skokie Blvd Suite 470
                                                                                                            Northbrook, IL 60062
                                                                                                                   847-513-6300


                                                           Stare at the Belt
                                                               April 2011

“Stare at the belt” is how every peewee football coach teaches his players how to tackle. As our clients
that played high school and college football can attest, this remains a fundamental lesson even as players
get older, stronger and faster. A defensive player is taught not to focus on a ball carrier’s shoulders,
arms, or feet, but rather the middle of his waist. Despite possibly having an arsenal of moves to fool a
defender, a player can only go in the direction of their belt buckle. Similarly, as investment managers, it
is our job to not get faked out. The financial media will flail their arms and the markets will stutter step,
but we take great pride in our efforts to stare at the belt and not be fooled.
For the first quarter of 2011, the markets brought some fancy footwork. In late January, the Middle East
erupted in protest and violence, oil was surely going back to $200 a barrel, and consumer spending
would subsequently slow. The markets, however, cut left and instead focused on the improving domestic
economy. The 10-year Treasury yield backed up 40 bps and the S&P 500 rallied 7% before the end of
February. Headlines claimed a renewal of a global bull market and quantitative easing was obsolete. All
of a sudden, the market cut to the right. A horrific earthquake sent a wall of water at the world’s 3rd
largest economy, causing tremendous death, destruction and a nuclear disaster. Furthermore, Europe’s
fiscal problems showed little progress. Nonetheless, the market turned in the best first quarter since the
late 90’s and the S&P 500 ended higher at quarter end than when the tsunami struck.


                                            RVP 1st Quarter Returns Net of Fees

Product                                       YTD (12/31/10 – 03/31/11)                       TTM (03/31/10 – 03/31/11 )
RVP Balanced                                          4.89%                                           14.11%
60/40 Benchmark*                                       3.71%                                          11.79%
RVP Absolute Return                                   2.67%                                            8.35%
3-Month T-Bill                                         0.03%                                           0.12%
* 60/40 Benchmark is 60% S&P 500 and 40% Barclays Aggregate Bond Index re-weighted monthly.


Our Balanced Strategy maintained its investment discipline for the quarter, returning 4.89% net versus
its benchmark of 3.72%, a net outperformance of 1.17%. For our long only accounts, we used the March
volatility to slightly increase our equity exposure though we remained defensive overall relative to our
benchmark. In fixed income, we continue to maintain our short duration and high credit quality. Our
credit quality improved after we opportunistically sold closed-end bond funds and replaced it with
MuniFund Term Preferred (MTP) and the new preferred security issued by the GDL Fund.
Our Absolute Return Strategy returned 2.67% net for the quarter, in-line with our goal of 8-12%
annually. The performance was primarily a result of three key themes: activist plays, Auction Rate
Preferred (ARP) redemptions and dividend reinstatements. Our activist holdings were well bid with a
tender offer announced and other future actions expected. The sweeping ARP redemptions led by
Nuveen again provided additional return to the composite. Finally, two of our largest equity holdings
reinstated dividends to attractive levels providing strong discount support.
In the face of geopolitical risk, natural disasters and market volatility, the Sector SPDR Energy Select
Fund (XLE) was a strong contributor of year-to-date performance in our long only accounts. One of our
few sector overweights, we originally purchased shares due to attractive sector valuations and as a
natural hedge against inflation and a weaker dollar. This position complements our traditionally
conservative equity allocations as a way to increase our market exposure with some protection against
rising commodity prices.
On March 9, 2011, the LMP Capital & Income Fund (SCD), one of our largest and most widely held
positions announced a tender offer for 30% of the fund. We welcomed this news as we originally
purchased a majority of the shares at discounts greater than 15% and a significant amount in excess of
20%. We were originally attracted to the fund’s historically wide discount, conservative strategy and its
bias towards high quality companies. As its discount contracted, however, it became clear SCD was
facing significant activist pressure. We paired back our overweight position and raised our sell target
based on the new developments and historic patterns of similar situations. We expect to tender a
significant amount of our holdings by the end of July.
The first quarter of 2011 was an important one for ARP redemptions. Of the ARP positions we held at
the end of 2010, over 40% were redeemed by the end of the first quarter of 2011. Most redemptions
were announced by Nuveen, but we also saw a sweeping redemption notice of Blackrock ARPs. Nuveen
announced the approval of Variable Rate MuniFund Term Preferred Shares (VMTP), another weapon in
their ARP redemption arsenal. In our view, it is clear that the market continues to make progress in ARP
redemptions, both in the form of new structures and management’s commitment to refinancing.
One of our largest and oldest holdings, the GDL Preferred Series A, also known as GDLPRA,
announced it was going to refinance with GDL Preferred Series B, GDLPRB. The preferred was offered
via a rights offering for existing shareholders of the series A preferred. In addition to the rights we
received from GDLPRA, we purchased rights in the secondary market because we believe the new
security represents value in today’s market. We view the new issue as attractively priced and it fits well
with our views on the current interest rate and credit environment. The new preferred will pay 7% for
the first year and resets at a floating rate of at least 3% every year thereafter. While the issue has a
mandatory redemption in 2018, it is puttable, or can be sold back to the fund, at any point after the
second year at par and is callable after the third year. This is a rare situation where the option, or put, is
in the buyer’s favor. Regardless of the way this plays out, we equate it to a minimum of a 2 year, 5%
bond with AAA credit quality characteristics. The preferred is secured 3:1 by the underlying assets in
the fund.

While we continue to find interesting opportunities in the closed-end fund market, our current portfolio
has a larger percentage of activist holdings than it has historically. This reflects our view that activist
positions maintain lower discount volatility. We continue to believe that too many directors are failing
in their fiduciary duty to their shareholders. As such, we believe these situations offer significant alpha-
generating potential given a closed-end fund market that is fairly valued overall.
It seems as though numerous investors find themselves in the uncomfortable position of having an
excess amount of cash paying literally 0% as the market grinds higher. We have coincidentally
experienced increased inquiries into some of our balanced strategies with a lower equity weighting. A
look at the data would probably help a person’s perspective. The worst calendar year return for a
portfolio with a 30% allocation to the S&P 500 and a 70% allocation to the Barclays Aggregate Bond
Index since 1976 was in 2008 at -7.46% and the second worst was in 1994 at -1.65%. In fact, there were
only 2 down years in the last 34 on the 30/70 blend. While RVP has the most assets in our 60/40
Balanced Composite, we have always offered customized asset class blends to meet client needs. For
those investors with a time horizon beyond the next few quarters, it may make sense to keep their eye on
the belt buckle and not the noise on CNBC.
As always, thank you for your trust in us.


                        Maury Fertig                             Bob Huffman


                            Relative Value Partners, LLC Absolute Return Composite

                                            1 Year         3 Years Annualized   Inception to 03/31/11
                                       (ending 03/31/11)    (ending 03/31/11)       Annualized*
             RVP Absolute Return             8.35%                8.72%                10.02%
             3 Month T-Bill                  0.12%                0.46%                 2.00%
               *Composite started on 6/1/2006

                                Relative Value Partners, LLC Balanced Composite

                                           1 Year          3 Years Annualized    5 Years Annualized
                                      (ending 03/31/11)     (ending 03/31/11)     (ending 03/31/11)
           RVP Balanced                    14.11%                 6.48%                 5.82%
           60/40 Benchmark*                11.79%                 4.09%                 4.37%


                                 Relative Value Partners, LLC Equity Composite

                                           1 Year          3 Years Annualized    5 Years Annualized
                                      (ending 03/31/11)     (ending 03/31/11)     (ending 03/31/11)
           RVP Equity                      17.73%                 5.91%                 5.10%
           S&P 500                         15.64%                 2.37%                 2.63%


                              Relative Value Partners, LLC Fixed Income Composite

                                           1 Year          3 Years Annualized    5 Years Annualized
                                      (ending 03/31/11)     (ending 03/31/11)     (ending 03/31/11)
           RVP Fixed Income                 6.17%                 7.07%                 6.67%
           Barclays Aggregate               5.13%                 5.27%                 6.01%
Relative Value Partners, LLC (RVP) is an independent registered investment advisor. The Balanced Account composite
contains fully discretionary balanced accounts and for comparison purposes is measured against the 60/40 Benchmark. The
60/40 Benchmark is comprised of 60% S&P 500 and 40% Barclays Aggregate Bond Index, reweighted monthly. The
Absolute Return Composite contains fully discretionary absolute return accounts and for comparison purposes is measured
against the 3 Month Treasury bill. The Equity Account Composite contains fully discretionary equity accounts and for
comparison purposes is measured against the S&P 500. The Fixed Income composite contains fully discretionary fixed
income accounts and for comparison purposes is measured against the Barclays Aggregate Bond Index.

All returns are shown in US dollars and are net of actual fees. The returns shown include the reinvestment of dividends and
other earnings. Accounts may own levered closed-end funds or ETFs and may short ETFs. Past performance may not be
indicative of future results. Different types of investments involve varying degrees of risk and there can be no assurances
that any specific investment will be profitable. Investors may experience a loss.

RVP claims compliance with the Global Investment Performance Standards (GIPS®).

To receive a complete list and description of RVP’s composites and/or a presentation that adheres to the GIPS standards,
contact Catherine Goel at (847) 513-6300, or write RVP, 1033 Skokie Blvd, Ste 470 Northbrook, IL 60062, or
cgoel@rvpllc.com.

Weitere ähnliche Inhalte

Was ist angesagt?

SBI Magnum Equity Fund: An Equity Mutual Fund - Apr 2016
SBI Magnum Equity Fund: An Equity Mutual Fund - Apr 2016SBI Magnum Equity Fund: An Equity Mutual Fund - Apr 2016
SBI Magnum Equity Fund: An Equity Mutual Fund - Apr 2016SBI Mutual Fund
 
Saff Spring 2010 Newsletter
Saff Spring 2010 NewsletterSaff Spring 2010 Newsletter
Saff Spring 2010 Newsletterdonaldgreen5280
 
SBI Magnum Monthly Income Plan: A Hybrid Mutual Fund Scheme - Aug 2016
SBI Magnum Monthly Income Plan: A Hybrid Mutual Fund Scheme - Aug 2016SBI Magnum Monthly Income Plan: A Hybrid Mutual Fund Scheme - Aug 2016
SBI Magnum Monthly Income Plan: A Hybrid Mutual Fund Scheme - Aug 2016SBI Mutual Fund
 
SBI Magnum Income Fund (MIF): An Income Mutual Fund Scheme - Aug 16
SBI Magnum Income Fund (MIF): An Income Mutual Fund Scheme - Aug 16SBI Magnum Income Fund (MIF): An Income Mutual Fund Scheme - Aug 16
SBI Magnum Income Fund (MIF): An Income Mutual Fund Scheme - Aug 16SBI Mutual Fund
 
SBI Short Term Debt Fund : An Open Ended Debt Fund - Aug 2016
SBI Short Term Debt Fund : An Open Ended Debt Fund - Aug 2016SBI Short Term Debt Fund : An Open Ended Debt Fund - Aug 2016
SBI Short Term Debt Fund : An Open Ended Debt Fund - Aug 2016SBI Mutual Fund
 
SBI Dynamic Asset Allocation Fund: A Hybrid Mutual Fund Scheme - Aug 16
SBI Dynamic Asset Allocation Fund: A Hybrid Mutual Fund Scheme - Aug 16SBI Dynamic Asset Allocation Fund: A Hybrid Mutual Fund Scheme - Aug 16
SBI Dynamic Asset Allocation Fund: A Hybrid Mutual Fund Scheme - Aug 16SBI Mutual Fund
 
KB Star Funds - Presentation Material (201606)
KB Star Funds - Presentation Material (201606)KB Star Funds - Presentation Material (201606)
KB Star Funds - Presentation Material (201606)kbasset
 
Due diligence document
Due diligence documentDue diligence document
Due diligence documentkbasset
 
SBI Money Market Funds : Investment in Debt & Money Market Securities - Aug 2016
SBI Money Market Funds : Investment in Debt & Money Market Securities - Aug 2016SBI Money Market Funds : Investment in Debt & Money Market Securities - Aug 2016
SBI Money Market Funds : Investment in Debt & Money Market Securities - Aug 2016SBI Mutual Fund
 
Capital structure analysis for nrb bearings
Capital structure analysis for nrb bearingsCapital structure analysis for nrb bearings
Capital structure analysis for nrb bearingsSumit Kr Singh
 
Putnam Absolute Return Funds Q&A Q2 2013
Putnam Absolute Return Funds Q&A Q2 2013Putnam Absolute Return Funds Q&A Q2 2013
Putnam Absolute Return Funds Q&A Q2 2013Putnam Investments
 
SBI Magnum Equity Fund: An Equity Mutual Fund - Jul 2016
SBI Magnum Equity Fund: An Equity Mutual Fund - Jul 2016SBI Magnum Equity Fund: An Equity Mutual Fund - Jul 2016
SBI Magnum Equity Fund: An Equity Mutual Fund - Jul 2016SBI Mutual Fund
 
Portfolio Management Project
Portfolio Management ProjectPortfolio Management Project
Portfolio Management ProjectLAI Wei
 
KB Star Funds - Factsheet (20160630)
KB Star Funds - Factsheet (20160630)KB Star Funds - Factsheet (20160630)
KB Star Funds - Factsheet (20160630)kbasset
 
SBI Magnum Equity Fund: An Open-ended Equity Scheme - March 17
SBI Magnum Equity Fund: An Open-ended Equity Scheme  - March 17SBI Magnum Equity Fund: An Open-ended Equity Scheme  - March 17
SBI Magnum Equity Fund: An Open-ended Equity Scheme - March 17SBI Mutual Fund
 
Expectations For Capital Market Returns
Expectations For Capital Market ReturnsExpectations For Capital Market Returns
Expectations For Capital Market Returnsfootball11
 
SBI Emerging Businesses Fund: An Open-ended Equity Fund - Jan 17
SBI Emerging Businesses Fund: An Open-ended Equity Fund - Jan 17SBI Emerging Businesses Fund: An Open-ended Equity Fund - Jan 17
SBI Emerging Businesses Fund: An Open-ended Equity Fund - Jan 17SBI Mutual Fund
 
Marketing materials factsheet
Marketing materials factsheetMarketing materials factsheet
Marketing materials factsheetkbasset
 

Was ist angesagt? (20)

SBI Magnum Equity Fund: An Equity Mutual Fund - Apr 2016
SBI Magnum Equity Fund: An Equity Mutual Fund - Apr 2016SBI Magnum Equity Fund: An Equity Mutual Fund - Apr 2016
SBI Magnum Equity Fund: An Equity Mutual Fund - Apr 2016
 
Coronation p kempen - november 2012
Coronation   p kempen - november 2012Coronation   p kempen - november 2012
Coronation p kempen - november 2012
 
Saff Spring 2010 Newsletter
Saff Spring 2010 NewsletterSaff Spring 2010 Newsletter
Saff Spring 2010 Newsletter
 
SBI Magnum Monthly Income Plan: A Hybrid Mutual Fund Scheme - Aug 2016
SBI Magnum Monthly Income Plan: A Hybrid Mutual Fund Scheme - Aug 2016SBI Magnum Monthly Income Plan: A Hybrid Mutual Fund Scheme - Aug 2016
SBI Magnum Monthly Income Plan: A Hybrid Mutual Fund Scheme - Aug 2016
 
SBI Magnum Income Fund (MIF): An Income Mutual Fund Scheme - Aug 16
SBI Magnum Income Fund (MIF): An Income Mutual Fund Scheme - Aug 16SBI Magnum Income Fund (MIF): An Income Mutual Fund Scheme - Aug 16
SBI Magnum Income Fund (MIF): An Income Mutual Fund Scheme - Aug 16
 
SBI Short Term Debt Fund : An Open Ended Debt Fund - Aug 2016
SBI Short Term Debt Fund : An Open Ended Debt Fund - Aug 2016SBI Short Term Debt Fund : An Open Ended Debt Fund - Aug 2016
SBI Short Term Debt Fund : An Open Ended Debt Fund - Aug 2016
 
SBI Dynamic Asset Allocation Fund: A Hybrid Mutual Fund Scheme - Aug 16
SBI Dynamic Asset Allocation Fund: A Hybrid Mutual Fund Scheme - Aug 16SBI Dynamic Asset Allocation Fund: A Hybrid Mutual Fund Scheme - Aug 16
SBI Dynamic Asset Allocation Fund: A Hybrid Mutual Fund Scheme - Aug 16
 
KB Star Funds - Presentation Material (201606)
KB Star Funds - Presentation Material (201606)KB Star Funds - Presentation Material (201606)
KB Star Funds - Presentation Material (201606)
 
Due diligence document
Due diligence documentDue diligence document
Due diligence document
 
Cc 1Q17_eng
Cc 1Q17_engCc 1Q17_eng
Cc 1Q17_eng
 
SBI Money Market Funds : Investment in Debt & Money Market Securities - Aug 2016
SBI Money Market Funds : Investment in Debt & Money Market Securities - Aug 2016SBI Money Market Funds : Investment in Debt & Money Market Securities - Aug 2016
SBI Money Market Funds : Investment in Debt & Money Market Securities - Aug 2016
 
Capital structure analysis for nrb bearings
Capital structure analysis for nrb bearingsCapital structure analysis for nrb bearings
Capital structure analysis for nrb bearings
 
Putnam Absolute Return Funds Q&A Q2 2013
Putnam Absolute Return Funds Q&A Q2 2013Putnam Absolute Return Funds Q&A Q2 2013
Putnam Absolute Return Funds Q&A Q2 2013
 
SBI Magnum Equity Fund: An Equity Mutual Fund - Jul 2016
SBI Magnum Equity Fund: An Equity Mutual Fund - Jul 2016SBI Magnum Equity Fund: An Equity Mutual Fund - Jul 2016
SBI Magnum Equity Fund: An Equity Mutual Fund - Jul 2016
 
Portfolio Management Project
Portfolio Management ProjectPortfolio Management Project
Portfolio Management Project
 
KB Star Funds - Factsheet (20160630)
KB Star Funds - Factsheet (20160630)KB Star Funds - Factsheet (20160630)
KB Star Funds - Factsheet (20160630)
 
SBI Magnum Equity Fund: An Open-ended Equity Scheme - March 17
SBI Magnum Equity Fund: An Open-ended Equity Scheme  - March 17SBI Magnum Equity Fund: An Open-ended Equity Scheme  - March 17
SBI Magnum Equity Fund: An Open-ended Equity Scheme - March 17
 
Expectations For Capital Market Returns
Expectations For Capital Market ReturnsExpectations For Capital Market Returns
Expectations For Capital Market Returns
 
SBI Emerging Businesses Fund: An Open-ended Equity Fund - Jan 17
SBI Emerging Businesses Fund: An Open-ended Equity Fund - Jan 17SBI Emerging Businesses Fund: An Open-ended Equity Fund - Jan 17
SBI Emerging Businesses Fund: An Open-ended Equity Fund - Jan 17
 
Marketing materials factsheet
Marketing materials factsheetMarketing materials factsheet
Marketing materials factsheet
 

Andere mochten auch

Kulon elulugu
Kulon eluluguKulon elulugu
Kulon elulugusummerki
 
Third Sector Presentation
Third Sector PresentationThird Sector Presentation
Third Sector PresentationAge UK
 
Optika itog urok
Optika itog urokOptika itog urok
Optika itog uroksummerki
 
70s decade with-cw
70s decade with-cw70s decade with-cw
70s decade with-cwbattlek
 
70s decade with-cw
70s decade with-cw70s decade with-cw
70s decade with-cwbattlek
 
Verdensrommet
Verdensrommet Verdensrommet
Verdensrommet cm88
 
Zakon kulona
Zakon kulonaZakon kulona
Zakon kulonasummerki
 
Siemens 15 brief_powerpoint
Siemens 15 brief_powerpointSiemens 15 brief_powerpoint
Siemens 15 brief_powerpointSelinaXZ
 
драконы копия
драконы   копиядраконы   копия
драконы копияirinavip27
 
Lässt sich der wirtschaftliche Erfolg von Wissensmanagement überhaupt nachwei...
Lässt sich der wirtschaftliche Erfolg von Wissensmanagement überhaupt nachwei...Lässt sich der wirtschaftliche Erfolg von Wissensmanagement überhaupt nachwei...
Lässt sich der wirtschaftliche Erfolg von Wissensmanagement überhaupt nachwei...Josef Hofer-Alfeis
 
Shaun Gallagher Presentation
Shaun Gallagher PresentationShaun Gallagher Presentation
Shaun Gallagher PresentationAge UK
 
Andrew dilnot presentation
Andrew dilnot presentationAndrew dilnot presentation
Andrew dilnot presentationAge UK
 
Tracey roose
Tracey rooseTracey roose
Tracey rooseAge UK
 
Ipsos mori results
Ipsos mori resultsIpsos mori results
Ipsos mori resultsAge UK
 
WorkINg In Social Media
WorkINg In Social MediaWorkINg In Social Media
WorkINg In Social MediahannahDschmidt
 
Siemens the company
Siemens the companySiemens the company
Siemens the companySaheen Shah
 
Agenda for Later Life 2011 - Andrew Dilnot
Agenda for Later Life 2011 - Andrew DilnotAgenda for Later Life 2011 - Andrew Dilnot
Agenda for Later Life 2011 - Andrew DilnotAge UK
 

Andere mochten auch (20)

Condition monitoring
Condition monitoringCondition monitoring
Condition monitoring
 
Kulon elulugu
Kulon eluluguKulon elulugu
Kulon elulugu
 
The tasks
The tasksThe tasks
The tasks
 
Third Sector Presentation
Third Sector PresentationThird Sector Presentation
Third Sector Presentation
 
Optika itog urok
Optika itog urokOptika itog urok
Optika itog urok
 
70s decade with-cw
70s decade with-cw70s decade with-cw
70s decade with-cw
 
70s decade with-cw
70s decade with-cw70s decade with-cw
70s decade with-cw
 
Verdensrommet
Verdensrommet Verdensrommet
Verdensrommet
 
Zakon kulona
Zakon kulonaZakon kulona
Zakon kulona
 
Siemens 15 brief_powerpoint
Siemens 15 brief_powerpointSiemens 15 brief_powerpoint
Siemens 15 brief_powerpoint
 
драконы копия
драконы   копиядраконы   копия
драконы копия
 
Siemens 360° Performance Dashboard
Siemens 360° Performance DashboardSiemens 360° Performance Dashboard
Siemens 360° Performance Dashboard
 
Lässt sich der wirtschaftliche Erfolg von Wissensmanagement überhaupt nachwei...
Lässt sich der wirtschaftliche Erfolg von Wissensmanagement überhaupt nachwei...Lässt sich der wirtschaftliche Erfolg von Wissensmanagement überhaupt nachwei...
Lässt sich der wirtschaftliche Erfolg von Wissensmanagement überhaupt nachwei...
 
Shaun Gallagher Presentation
Shaun Gallagher PresentationShaun Gallagher Presentation
Shaun Gallagher Presentation
 
Andrew dilnot presentation
Andrew dilnot presentationAndrew dilnot presentation
Andrew dilnot presentation
 
Tracey roose
Tracey rooseTracey roose
Tracey roose
 
Ipsos mori results
Ipsos mori resultsIpsos mori results
Ipsos mori results
 
WorkINg In Social Media
WorkINg In Social MediaWorkINg In Social Media
WorkINg In Social Media
 
Siemens the company
Siemens the companySiemens the company
Siemens the company
 
Agenda for Later Life 2011 - Andrew Dilnot
Agenda for Later Life 2011 - Andrew DilnotAgenda for Later Life 2011 - Andrew Dilnot
Agenda for Later Life 2011 - Andrew Dilnot
 

Ähnlich wie RVP 2011 Q1 Letter

Mercer Capital's Business Development Companies Quarterly Newsletter | Q4 201...
Mercer Capital's Business Development Companies Quarterly Newsletter | Q4 201...Mercer Capital's Business Development Companies Quarterly Newsletter | Q4 201...
Mercer Capital's Business Development Companies Quarterly Newsletter | Q4 201...Mercer Capital
 
IDFC Sterling Value Fund_One pager
IDFC Sterling Value Fund_One pagerIDFC Sterling Value Fund_One pager
IDFC Sterling Value Fund_One pagerIDFCJUBI
 
Note on dspblk bond fund march 2018 1
Note on dspblk bond fund march 2018 1Note on dspblk bond fund march 2018 1
Note on dspblk bond fund march 2018 1Vidya Ashok
 
CEAT ltd. Equity Research
CEAT ltd. Equity ResearchCEAT ltd. Equity Research
CEAT ltd. Equity ResearchBhagwati Maurya
 
Kb star 2019.03 factsheet
Kb star 2019.03 factsheetKb star 2019.03 factsheet
Kb star 2019.03 factsheetkbasset
 
Compelling Arguments or False Assumption No 2
Compelling Arguments or False Assumption No 2Compelling Arguments or False Assumption No 2
Compelling Arguments or False Assumption No 2Ralph K. Czichon
 
LGIP 3rd Quarter
LGIP 3rd QuarterLGIP 3rd Quarter
LGIP 3rd Quarterdougducey
 
SBI Dynamic Bond Fund: An Income Mutual Fund Scheme - Aug 16
SBI Dynamic Bond Fund: An Income Mutual Fund Scheme - Aug 16SBI Dynamic Bond Fund: An Income Mutual Fund Scheme - Aug 16
SBI Dynamic Bond Fund: An Income Mutual Fund Scheme - Aug 16SBI Mutual Fund
 
DIVIDEND PAYOUT Dividend payout is the amount of cash that a com.docx
DIVIDEND PAYOUT Dividend payout is the amount of cash that a com.docxDIVIDEND PAYOUT Dividend payout is the amount of cash that a com.docx
DIVIDEND PAYOUT Dividend payout is the amount of cash that a com.docxmadlynplamondon
 
SBI Dynamic Bond Fund : Debt Mutual Fund - Apr 2016
SBI Dynamic Bond Fund : Debt Mutual Fund - Apr 2016SBI Dynamic Bond Fund : Debt Mutual Fund - Apr 2016
SBI Dynamic Bond Fund : Debt Mutual Fund - Apr 2016SBI Mutual Fund
 
Kb star factsheet apr 2019 201905
Kb star factsheet apr 2019 201905Kb star factsheet apr 2019 201905
Kb star factsheet apr 2019 201905kbasset
 
Kb star factsheet apr 2019 201905
Kb star factsheet apr 2019 201905Kb star factsheet apr 2019 201905
Kb star factsheet apr 2019 201905kbasset
 
IDFC Bond Fund Medium Term Plan_Fund spotlight
IDFC Bond Fund Medium Term Plan_Fund spotlightIDFC Bond Fund Medium Term Plan_Fund spotlight
IDFC Bond Fund Medium Term Plan_Fund spotlightTravisBickle19
 
IDFC Bond Fund Medium Term Plan_Fund spotlight
IDFC Bond Fund Medium Term Plan_Fund spotlightIDFC Bond Fund Medium Term Plan_Fund spotlight
IDFC Bond Fund Medium Term Plan_Fund spotlightJubiIDFCDebt
 
W(h)ither Yields? Dividend Capacity & BDC Stock Prices: A Mortgage REIT Case ...
W(h)ither Yields? Dividend Capacity & BDC Stock Prices: A Mortgage REIT Case ...W(h)ither Yields? Dividend Capacity & BDC Stock Prices: A Mortgage REIT Case ...
W(h)ither Yields? Dividend Capacity & BDC Stock Prices: A Mortgage REIT Case ...Mercer Capital
 
Sushil finance indusind_28oct_2014
Sushil finance indusind_28oct_2014Sushil finance indusind_28oct_2014
Sushil finance indusind_28oct_2014IndiaNotes.com
 

Ähnlich wie RVP 2011 Q1 Letter (20)

DSP Focus Fund
DSP Focus FundDSP Focus Fund
DSP Focus Fund
 
Time weighted vs-dollar-weighted returns
Time weighted vs-dollar-weighted returnsTime weighted vs-dollar-weighted returns
Time weighted vs-dollar-weighted returns
 
Mercer Capital's Business Development Companies Quarterly Newsletter | Q4 201...
Mercer Capital's Business Development Companies Quarterly Newsletter | Q4 201...Mercer Capital's Business Development Companies Quarterly Newsletter | Q4 201...
Mercer Capital's Business Development Companies Quarterly Newsletter | Q4 201...
 
IDFC Sterling Value Fund_One pager
IDFC Sterling Value Fund_One pagerIDFC Sterling Value Fund_One pager
IDFC Sterling Value Fund_One pager
 
Note on dspblk bond fund march 2018 1
Note on dspblk bond fund march 2018 1Note on dspblk bond fund march 2018 1
Note on dspblk bond fund march 2018 1
 
CEAT ltd. Equity Research
CEAT ltd. Equity ResearchCEAT ltd. Equity Research
CEAT ltd. Equity Research
 
Kb star 2019.03 factsheet
Kb star 2019.03 factsheetKb star 2019.03 factsheet
Kb star 2019.03 factsheet
 
Compelling Arguments or False Assumption No 2
Compelling Arguments or False Assumption No 2Compelling Arguments or False Assumption No 2
Compelling Arguments or False Assumption No 2
 
LGIP 3rd Quarter
LGIP 3rd QuarterLGIP 3rd Quarter
LGIP 3rd Quarter
 
SBI Dynamic Bond Fund: An Income Mutual Fund Scheme - Aug 16
SBI Dynamic Bond Fund: An Income Mutual Fund Scheme - Aug 16SBI Dynamic Bond Fund: An Income Mutual Fund Scheme - Aug 16
SBI Dynamic Bond Fund: An Income Mutual Fund Scheme - Aug 16
 
DIVIDEND PAYOUT Dividend payout is the amount of cash that a com.docx
DIVIDEND PAYOUT Dividend payout is the amount of cash that a com.docxDIVIDEND PAYOUT Dividend payout is the amount of cash that a com.docx
DIVIDEND PAYOUT Dividend payout is the amount of cash that a com.docx
 
SBI Dynamic Bond Fund : Debt Mutual Fund - Apr 2016
SBI Dynamic Bond Fund : Debt Mutual Fund - Apr 2016SBI Dynamic Bond Fund : Debt Mutual Fund - Apr 2016
SBI Dynamic Bond Fund : Debt Mutual Fund - Apr 2016
 
Kb star factsheet apr 2019 201905
Kb star factsheet apr 2019 201905Kb star factsheet apr 2019 201905
Kb star factsheet apr 2019 201905
 
Kb star factsheet apr 2019 201905
Kb star factsheet apr 2019 201905Kb star factsheet apr 2019 201905
Kb star factsheet apr 2019 201905
 
Inheritance, Retirement & Cash Flow
Inheritance, Retirement & Cash FlowInheritance, Retirement & Cash Flow
Inheritance, Retirement & Cash Flow
 
IDFC Bond Fund Medium Term Plan_Fund spotlight
IDFC Bond Fund Medium Term Plan_Fund spotlightIDFC Bond Fund Medium Term Plan_Fund spotlight
IDFC Bond Fund Medium Term Plan_Fund spotlight
 
IDFC Bond Fund Medium Term Plan_Fund spotlight
IDFC Bond Fund Medium Term Plan_Fund spotlightIDFC Bond Fund Medium Term Plan_Fund spotlight
IDFC Bond Fund Medium Term Plan_Fund spotlight
 
SMF Q4 Report 2014
SMF Q4 Report 2014SMF Q4 Report 2014
SMF Q4 Report 2014
 
W(h)ither Yields? Dividend Capacity & BDC Stock Prices: A Mortgage REIT Case ...
W(h)ither Yields? Dividend Capacity & BDC Stock Prices: A Mortgage REIT Case ...W(h)ither Yields? Dividend Capacity & BDC Stock Prices: A Mortgage REIT Case ...
W(h)ither Yields? Dividend Capacity & BDC Stock Prices: A Mortgage REIT Case ...
 
Sushil finance indusind_28oct_2014
Sushil finance indusind_28oct_2014Sushil finance indusind_28oct_2014
Sushil finance indusind_28oct_2014
 

RVP 2011 Q1 Letter

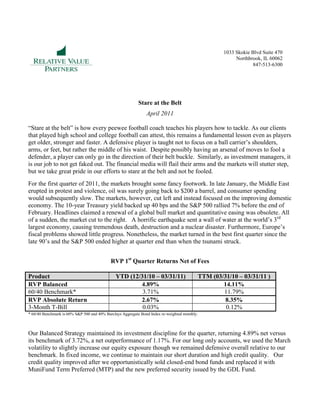
  • 1. 1033 Skokie Blvd Suite 470 Northbrook, IL 60062 847-513-6300 Stare at the Belt April 2011 “Stare at the belt” is how every peewee football coach teaches his players how to tackle. As our clients that played high school and college football can attest, this remains a fundamental lesson even as players get older, stronger and faster. A defensive player is taught not to focus on a ball carrier’s shoulders, arms, or feet, but rather the middle of his waist. Despite possibly having an arsenal of moves to fool a defender, a player can only go in the direction of their belt buckle. Similarly, as investment managers, it is our job to not get faked out. The financial media will flail their arms and the markets will stutter step, but we take great pride in our efforts to stare at the belt and not be fooled. For the first quarter of 2011, the markets brought some fancy footwork. In late January, the Middle East erupted in protest and violence, oil was surely going back to $200 a barrel, and consumer spending would subsequently slow. The markets, however, cut left and instead focused on the improving domestic economy. The 10-year Treasury yield backed up 40 bps and the S&P 500 rallied 7% before the end of February. Headlines claimed a renewal of a global bull market and quantitative easing was obsolete. All of a sudden, the market cut to the right. A horrific earthquake sent a wall of water at the world’s 3rd largest economy, causing tremendous death, destruction and a nuclear disaster. Furthermore, Europe’s fiscal problems showed little progress. Nonetheless, the market turned in the best first quarter since the late 90’s and the S&P 500 ended higher at quarter end than when the tsunami struck. RVP 1st Quarter Returns Net of Fees Product YTD (12/31/10 – 03/31/11) TTM (03/31/10 – 03/31/11 ) RVP Balanced 4.89% 14.11% 60/40 Benchmark* 3.71% 11.79% RVP Absolute Return 2.67% 8.35% 3-Month T-Bill 0.03% 0.12% * 60/40 Benchmark is 60% S&P 500 and 40% Barclays Aggregate Bond Index re-weighted monthly. Our Balanced Strategy maintained its investment discipline for the quarter, returning 4.89% net versus its benchmark of 3.72%, a net outperformance of 1.17%. For our long only accounts, we used the March volatility to slightly increase our equity exposure though we remained defensive overall relative to our benchmark. In fixed income, we continue to maintain our short duration and high credit quality. Our credit quality improved after we opportunistically sold closed-end bond funds and replaced it with MuniFund Term Preferred (MTP) and the new preferred security issued by the GDL Fund.
  • 2. Our Absolute Return Strategy returned 2.67% net for the quarter, in-line with our goal of 8-12% annually. The performance was primarily a result of three key themes: activist plays, Auction Rate Preferred (ARP) redemptions and dividend reinstatements. Our activist holdings were well bid with a tender offer announced and other future actions expected. The sweeping ARP redemptions led by Nuveen again provided additional return to the composite. Finally, two of our largest equity holdings reinstated dividends to attractive levels providing strong discount support. In the face of geopolitical risk, natural disasters and market volatility, the Sector SPDR Energy Select Fund (XLE) was a strong contributor of year-to-date performance in our long only accounts. One of our few sector overweights, we originally purchased shares due to attractive sector valuations and as a natural hedge against inflation and a weaker dollar. This position complements our traditionally conservative equity allocations as a way to increase our market exposure with some protection against rising commodity prices. On March 9, 2011, the LMP Capital & Income Fund (SCD), one of our largest and most widely held positions announced a tender offer for 30% of the fund. We welcomed this news as we originally purchased a majority of the shares at discounts greater than 15% and a significant amount in excess of 20%. We were originally attracted to the fund’s historically wide discount, conservative strategy and its bias towards high quality companies. As its discount contracted, however, it became clear SCD was facing significant activist pressure. We paired back our overweight position and raised our sell target based on the new developments and historic patterns of similar situations. We expect to tender a significant amount of our holdings by the end of July. The first quarter of 2011 was an important one for ARP redemptions. Of the ARP positions we held at the end of 2010, over 40% were redeemed by the end of the first quarter of 2011. Most redemptions were announced by Nuveen, but we also saw a sweeping redemption notice of Blackrock ARPs. Nuveen announced the approval of Variable Rate MuniFund Term Preferred Shares (VMTP), another weapon in their ARP redemption arsenal. In our view, it is clear that the market continues to make progress in ARP redemptions, both in the form of new structures and management’s commitment to refinancing. One of our largest and oldest holdings, the GDL Preferred Series A, also known as GDLPRA, announced it was going to refinance with GDL Preferred Series B, GDLPRB. The preferred was offered via a rights offering for existing shareholders of the series A preferred. In addition to the rights we received from GDLPRA, we purchased rights in the secondary market because we believe the new security represents value in today’s market. We view the new issue as attractively priced and it fits well with our views on the current interest rate and credit environment. The new preferred will pay 7% for the first year and resets at a floating rate of at least 3% every year thereafter. While the issue has a mandatory redemption in 2018, it is puttable, or can be sold back to the fund, at any point after the second year at par and is callable after the third year. This is a rare situation where the option, or put, is in the buyer’s favor. Regardless of the way this plays out, we equate it to a minimum of a 2 year, 5% bond with AAA credit quality characteristics. The preferred is secured 3:1 by the underlying assets in the fund. While we continue to find interesting opportunities in the closed-end fund market, our current portfolio has a larger percentage of activist holdings than it has historically. This reflects our view that activist positions maintain lower discount volatility. We continue to believe that too many directors are failing in their fiduciary duty to their shareholders. As such, we believe these situations offer significant alpha- generating potential given a closed-end fund market that is fairly valued overall.
  • 3. It seems as though numerous investors find themselves in the uncomfortable position of having an excess amount of cash paying literally 0% as the market grinds higher. We have coincidentally experienced increased inquiries into some of our balanced strategies with a lower equity weighting. A look at the data would probably help a person’s perspective. The worst calendar year return for a portfolio with a 30% allocation to the S&P 500 and a 70% allocation to the Barclays Aggregate Bond Index since 1976 was in 2008 at -7.46% and the second worst was in 1994 at -1.65%. In fact, there were only 2 down years in the last 34 on the 30/70 blend. While RVP has the most assets in our 60/40 Balanced Composite, we have always offered customized asset class blends to meet client needs. For those investors with a time horizon beyond the next few quarters, it may make sense to keep their eye on the belt buckle and not the noise on CNBC. As always, thank you for your trust in us. Maury Fertig Bob Huffman Relative Value Partners, LLC Absolute Return Composite 1 Year 3 Years Annualized Inception to 03/31/11 (ending 03/31/11) (ending 03/31/11) Annualized* RVP Absolute Return 8.35% 8.72% 10.02% 3 Month T-Bill 0.12% 0.46% 2.00% *Composite started on 6/1/2006 Relative Value Partners, LLC Balanced Composite 1 Year 3 Years Annualized 5 Years Annualized (ending 03/31/11) (ending 03/31/11) (ending 03/31/11) RVP Balanced 14.11% 6.48% 5.82% 60/40 Benchmark* 11.79% 4.09% 4.37% Relative Value Partners, LLC Equity Composite 1 Year 3 Years Annualized 5 Years Annualized (ending 03/31/11) (ending 03/31/11) (ending 03/31/11) RVP Equity 17.73% 5.91% 5.10% S&P 500 15.64% 2.37% 2.63% Relative Value Partners, LLC Fixed Income Composite 1 Year 3 Years Annualized 5 Years Annualized (ending 03/31/11) (ending 03/31/11) (ending 03/31/11) RVP Fixed Income 6.17% 7.07% 6.67% Barclays Aggregate 5.13% 5.27% 6.01%
  • 4. Relative Value Partners, LLC (RVP) is an independent registered investment advisor. The Balanced Account composite contains fully discretionary balanced accounts and for comparison purposes is measured against the 60/40 Benchmark. The 60/40 Benchmark is comprised of 60% S&P 500 and 40% Barclays Aggregate Bond Index, reweighted monthly. The Absolute Return Composite contains fully discretionary absolute return accounts and for comparison purposes is measured against the 3 Month Treasury bill. The Equity Account Composite contains fully discretionary equity accounts and for comparison purposes is measured against the S&P 500. The Fixed Income composite contains fully discretionary fixed income accounts and for comparison purposes is measured against the Barclays Aggregate Bond Index. All returns are shown in US dollars and are net of actual fees. The returns shown include the reinvestment of dividends and other earnings. Accounts may own levered closed-end funds or ETFs and may short ETFs. Past performance may not be indicative of future results. Different types of investments involve varying degrees of risk and there can be no assurances that any specific investment will be profitable. Investors may experience a loss. RVP claims compliance with the Global Investment Performance Standards (GIPS®). To receive a complete list and description of RVP’s composites and/or a presentation that adheres to the GIPS standards, contact Catherine Goel at (847) 513-6300, or write RVP, 1033 Skokie Blvd, Ste 470 Northbrook, IL 60062, or cgoel@rvpllc.com.