SlideShare ist ein Scribd-Unternehmen logo
1 von 3
Downloaden Sie, um offline zu lesen
THE HIGH PERFORMANCE PORTFOLIO:

RETHINKING
SIMPLE PAYBACK PERIOD

SUMMARY
Simple payback period – defined as the number of years it would take to recover a project’s costs
– is a metric commonly used to evaluate energy-efficiency and sustainability investments. While
quick and intuitive, simple payback can lead to sub-optimal decision-making. By not incorporating
important aspects such as the time value of money, cash flows after the payback period, and how a
property’s lease allocates the costs and benefits of an efficiency project, simple payback provides an
incomplete view of an investment’s financial return.

IN DEPTH
When it comes to deciding which investments get funded, the first question most managers ask
is, “What’s the simple payback period?” A quick calculation – dividing the initial costs of a project
by the annual expected savings – simple payback period is the most widely used metric in capital
budgeting. Determining the simple payback period can be useful if the main goal is quickly
recapturing funds, or as a screening exercise to compare competing projects. However, placing too
much emphasis on simple payback gives a limited view of a project’s economics and can result in
missed opportunities.

Simple payback period ignores the impact of any cash flows that are received after the payback
period – even though it is precisely those cash flows that determine the profitability of the
investment. Take the case of two $100,000 investments. Project A returns $50,000 per year and
nothing thereafter, while Project B returns $25,000 per year for each of 10 years. Project B’s simple
payback period may be twice as long as Project A’s; however, its capacity to generate far greater
returns over its lifetime makes it the superior investment.

Additionally, simple payback period does not recognize the time value of money, treating each dollar
that flows in or out as being equally valuable regardless of when the flow occurs. Assuming a market
interest rate greater than zero, a dollar received today has greater value than a dollar received at some
point in the future. Take two $100,000 projects, each of which has a simple payback period of two years.


FIGURE 1:
PROJECTS WITH IDENTICAL SIMPLE PAYBACK PERIOD CAN HAVE VERY DIFFERENT NET PRESENT
VALUES DEPENDING ON THE TIMING AND DURATION OF CASH FLOWS

             SPP         NPV           TODAY           YR 1         YR 2          YR 3         YR 4         YR 5           YR 6      YR 7      YR 8      YR 9      YR 10

PROJECT A      2     ($13,223.14)    $ (100,000)      $50,000      $50,000
PROJECT B      4      $53,614.18     $ (100,000)      $25,000      $25,000       $25,000      $25,000      $25,000         $25,000   $25,000   $25,000   $25,000   $25,000
            Note: Initial investment is made at beginning of Year 1, while savings are received at the end of each year.
FIGURE 2:
 PROJECTS WITH IDENTICAL FIRST
 COST AND SIMPLE PAYBACK PERIOD                                                  Project A returns $50,000 at the end of each year, but Project C returns
 CAN BE RANKED BY CALCULATING                                                    $100,000 at the end of Year 2. Although both projects have the same
 THE PV OF FUTURE CASH FLOWS
                                                                                 simple payback period, Project A is clearly superior to Project C. Project
                  SPP         PV           YR 1          YR 2
                                                                                 A’s returns have a higher “present value” because the first $50,000 is
  PROJECT A        2      $86,776.86       $50,000      $50,000
                                                                                 returned twelve months earlier when those dollars are worth more.
  PROJECT C        2      $82,644.63                   $100,000
                 Notes: Example assumes savings are received at
                 the end of each year. PV calculation assumes a
                 discount rate of 10%.
                                                                   Another consideration when evaluating expense-reducing investments is
                                                                   the likelihood of receiving one or more future cash flows – or the risk that
                                                                  those cash flows may disappear over time. In many cases, the probability
                                                               of receiving projected cash flows varies over the lifetime of an investment, a
                             nuance that exceeds the capabilities of a simple payback calculation. For example, uncertainties regarding
                             future energy prices, the operating performance of a capital project and the persistence of energy-saving
                             behavior can impact whether estimated savings are actually realized. Managers who value the ability
                             to factor risks such as these into their decision-making favor more sophisticated approaches, such as
                             discounted cash flow modeling.

                             In many real estate firms, there is often a “rule-of-thumb” for capital investment decisions – such as
                             only pursuing projects that are “less than two-year simple payback.” Having such a rigid threshold for
                             project approval seems arbitrary when factoring in market conditions, organizational hurdle rates, or
                             the holding period of a building. Many managers will deny approval for an energy-saving project whose
                             simple payback period exceeds this “rule-of-thumb” without realizing that competing investment
                             opportunities offer far lower rates of return. In fact, this obsession with a two-year payback threshold
                             persists despite significant variation in both market interest rates and the rates of return offered by
                             other investments over the last several decades.


FIGURE 3:
THE SIMPLE PAYBACK PERIOD THAT A LANDLORD SEES WILL DEPEND ON HOW A PROJECT’S FIRST COST AND
SAVINGS ARE ALLOCATED BETWEEN LANDLORD AND TENANT

                                                                      YR 1         YR 2         YR 3         YR 4          YR 5         YR 6         YR 7         YR 8         YR 9        YR 10
                    LANDLORD RECEIVES
                          ALL SAVINGS
                                       First cost    $ (100,000)

                         Total annual savings                        $50,000      $50,000      $50,000     $50,000      $50,000      $50,000      $50,000      $50,000     $50,000      $50,000

                               Landlord’s SPP:             2
                              Landlord’s NPV:        $207,228.36

                     LANDLORD SHARES
                  SAVINGS WITH TENANT
                Landlord’s portion of savings            50%        $25,000      $25,000      $25,000      $25,000      $25,000      $25,000      $25,000      $25,000      $25,000      $25,000
                  Tenant’s portion of savings            50%        $25,000      $25,000      $25,000      $25,000      $25,000      $25,000      $25,000      $25,000      $25,000      $25,000
                               Landlord’s SSP:            4
                              Landlord’s NPV:        $53,614.18

      LANDLORD RECOVERS TENANT’S
                SHARE OF SAVINGS
                Landlord’s portion of savings            50%         $25,000      $25,000      $25,000      $25,000      $25,000      $25,000      $25,000       $25,000      $25,000      $25,000
Cap Ex recoveries that offset tenant’s savings                       $25,000      $25,000      $25,000      $25,000
           Landlord’s total annual cash flows                         $50,000      $50,000      $50,000      $50,000      $25,000      $25,000      $25,000       $25,000      $25,000      $25,000
      Landlord’s SPP with Cap Ex recoveries:               2
                              Landlord’s NPV:        $132,860.81
                                                    Notes: Example assumes that the initial investment is made at the beginning of Year 1, while savings are received at the end of each year. NPV
                                                    calculation considers all listed cash flows and assumes a discount rate of 10%. Lease language, tenant turnover and other factors ultimately
                                                    determine the magnitude and duration of recoveries in the final scenario.
A simple payback period is only as accurate as the costs and benefits that were used to calculate it. It is
                         impossible to compute a project’s simple payback period unless the values used for the numerator and
                         denominator reflect a project’s true costs and savings, respectively. For example, a project’s first cost
                         should be reduced by the amount of any rebates or other incentives received, such as a utility energy-
                         efficiency incentive or a potential tax credit. Failure to do so overstates the length of time necessary to
                         recover that investment.

                         When evaluating investments made in landlord/tenant settings, properly calculating the simple
                         payback period is rarely simple. In the case of a project that would reduce energy costs in the building,
                         any capital expense reimbursements that the leases permit the landlord to collect from tenants should
                         be recorded as additional cash inflows. These assessments help reduce the project’s simple payback
                         period when viewed from the landlord’s perspective. One should also consider how the leases would
                         allocate the estimated savings between the landlord and tenants. If the leases allow the tenants to keep
                         a portion of the savings, those dollars must be excluded when calculating simple payback period from
                         the landlord’s perspective.

                         On the other hand, the landlord’s share of savings could affect the property’s net operating income
                         (NOI) and asset value. According to the Income Approach to Appraisal, an incremental dollar of NOI
                         supports an incremental $10 in asset value at a capitalization rate of 10%. (This assumes that the NOI
                         increase is persistent enough to be factored into the appraisal when the property is refinanced or sold.)
                         If the landlord’s share of savings were verified (and persistent), such an increase in appraised value
                         alone could exceed the landlord’s original investment in the energy-saving project, generating a simple
                         payback period that could be measured in days rather than years.


          THE BOTTOM LINE:

          •   Simple payback calculations often provide a quick         •   Given the complexity of properly allocating the costs
              but limited view of the financial performance of an            and benefits of expense-reducing capital projects in
              investment.                                                   landlord/tenant settings, and the impact that energy
          •   Simple payback does not consider time value                   savings can have on a property’s net operating
              of money, split incentives defined in leases, or               income and asset value, any calculation of simple
              other risks and uncertainties common in capital               payback should be supplemented with more robust
              decisions.                                                    financial metrics, such as internal rate of return, net
                                                                            present value, and/or life-cycle cost.


          USEFUL LINKS:
          The High Performance Portfolio
          www.betterbricks.com/office/framework


August 2009                                                                                                      www.betterbricks.com/office/briefs

Weitere ähnliche Inhalte

Mehr von BetterBricks

Energy Efficiency, Myths and Misperceptions
Energy Efficiency, Myths and MisperceptionsEnergy Efficiency, Myths and Misperceptions
Energy Efficiency, Myths and MisperceptionsBetterBricks
 
Carbon, energy and your building
Carbon, energy and your buildingCarbon, energy and your building
Carbon, energy and your buildingBetterBricks
 
Carbon, energy and your building
Carbon, energy and your buildingCarbon, energy and your building
Carbon, energy and your buildingBetterBricks
 
Carbon, Energy and Your Building
Carbon, Energy and Your BuildingCarbon, Energy and Your Building
Carbon, Energy and Your BuildingBetterBricks
 
Building tune ups for commercial buildings
Building tune ups for commercial buildingsBuilding tune ups for commercial buildings
Building tune ups for commercial buildingsBetterBricks
 
The Energy Efficiency Playbook: Everything you need to know about purchasing...
The Energy Efficiency Playbook:  Everything you need to know about purchasing...The Energy Efficiency Playbook:  Everything you need to know about purchasing...
The Energy Efficiency Playbook: Everything you need to know about purchasing...BetterBricks
 
10 Goals for Green Leasing
10 Goals for Green Leasing10 Goals for Green Leasing
10 Goals for Green LeasingBetterBricks
 
Energy in Healthcare Fact Sheet
Energy in Healthcare Fact SheetEnergy in Healthcare Fact Sheet
Energy in Healthcare Fact SheetBetterBricks
 
Targeting 100! Envisioning the High Performance Hospital
Targeting 100! Envisioning the High Performance HospitalTargeting 100! Envisioning the High Performance Hospital
Targeting 100! Envisioning the High Performance HospitalBetterBricks
 
Green Building Index National Overview
Green Building Index National OverviewGreen Building Index National Overview
Green Building Index National OverviewBetterBricks
 

Mehr von BetterBricks (11)

Energy Efficiency, Myths and Misperceptions
Energy Efficiency, Myths and MisperceptionsEnergy Efficiency, Myths and Misperceptions
Energy Efficiency, Myths and Misperceptions
 
Carbon, energy and your building
Carbon, energy and your buildingCarbon, energy and your building
Carbon, energy and your building
 
Carbon, energy and your building
Carbon, energy and your buildingCarbon, energy and your building
Carbon, energy and your building
 
Carbon, Energy and Your Building
Carbon, Energy and Your BuildingCarbon, Energy and Your Building
Carbon, Energy and Your Building
 
Building tune ups for commercial buildings
Building tune ups for commercial buildingsBuilding tune ups for commercial buildings
Building tune ups for commercial buildings
 
The Energy Efficiency Playbook: Everything you need to know about purchasing...
The Energy Efficiency Playbook:  Everything you need to know about purchasing...The Energy Efficiency Playbook:  Everything you need to know about purchasing...
The Energy Efficiency Playbook: Everything you need to know about purchasing...
 
10 Goals for Green Leasing
10 Goals for Green Leasing10 Goals for Green Leasing
10 Goals for Green Leasing
 
Energy in Healthcare Fact Sheet
Energy in Healthcare Fact SheetEnergy in Healthcare Fact Sheet
Energy in Healthcare Fact Sheet
 
Targeting 100! Envisioning the High Performance Hospital
Targeting 100! Envisioning the High Performance HospitalTargeting 100! Envisioning the High Performance Hospital
Targeting 100! Envisioning the High Performance Hospital
 
Green Building Index National Overview
Green Building Index National OverviewGreen Building Index National Overview
Green Building Index National Overview
 
Powerful Business
Powerful BusinessPowerful Business
Powerful Business
 

Kürzlich hochgeladen

The Path to Product Excellence: Avoiding Common Pitfalls and Enhancing Commun...
The Path to Product Excellence: Avoiding Common Pitfalls and Enhancing Commun...The Path to Product Excellence: Avoiding Common Pitfalls and Enhancing Commun...
The Path to Product Excellence: Avoiding Common Pitfalls and Enhancing Commun...Aggregage
 
Call Girls In Panjim North Goa 9971646499 Genuine Service
Call Girls In Panjim North Goa 9971646499 Genuine ServiceCall Girls In Panjim North Goa 9971646499 Genuine Service
Call Girls In Panjim North Goa 9971646499 Genuine Serviceritikaroy0888
 
Phases of Negotiation .pptx
 Phases of Negotiation .pptx Phases of Negotiation .pptx
Phases of Negotiation .pptxnandhinijagan9867
 
Falcon's Invoice Discounting: Your Path to Prosperity
Falcon's Invoice Discounting: Your Path to ProsperityFalcon's Invoice Discounting: Your Path to Prosperity
Falcon's Invoice Discounting: Your Path to Prosperityhemanthkumar470700
 
FULL ENJOY Call Girls In Mahipalpur Delhi Contact Us 8377877756
FULL ENJOY Call Girls In Mahipalpur Delhi Contact Us 8377877756FULL ENJOY Call Girls In Mahipalpur Delhi Contact Us 8377877756
FULL ENJOY Call Girls In Mahipalpur Delhi Contact Us 8377877756dollysharma2066
 
Call Girls In Noida 959961⊹3876 Independent Escort Service Noida
Call Girls In Noida 959961⊹3876 Independent Escort Service NoidaCall Girls In Noida 959961⊹3876 Independent Escort Service Noida
Call Girls In Noida 959961⊹3876 Independent Escort Service Noidadlhescort
 
Call Girls Service In Old Town Dubai ((0551707352)) Old Town Dubai Call Girl ...
Call Girls Service In Old Town Dubai ((0551707352)) Old Town Dubai Call Girl ...Call Girls Service In Old Town Dubai ((0551707352)) Old Town Dubai Call Girl ...
Call Girls Service In Old Town Dubai ((0551707352)) Old Town Dubai Call Girl ...allensay1
 
Value Proposition canvas- Customer needs and pains
Value Proposition canvas- Customer needs and painsValue Proposition canvas- Customer needs and pains
Value Proposition canvas- Customer needs and painsP&CO
 
How to Get Started in Social Media for Art League City
How to Get Started in Social Media for Art League CityHow to Get Started in Social Media for Art League City
How to Get Started in Social Media for Art League CityEric T. Tung
 
A DAY IN THE LIFE OF A SALESMAN / WOMAN
A DAY IN THE LIFE OF A  SALESMAN / WOMANA DAY IN THE LIFE OF A  SALESMAN / WOMAN
A DAY IN THE LIFE OF A SALESMAN / WOMANIlamathiKannappan
 
Organizational Transformation Lead with Culture
Organizational Transformation Lead with CultureOrganizational Transformation Lead with Culture
Organizational Transformation Lead with CultureSeta Wicaksana
 
Business Model Canvas (BMC)- A new venture concept
Business Model Canvas (BMC)-  A new venture conceptBusiness Model Canvas (BMC)-  A new venture concept
Business Model Canvas (BMC)- A new venture conceptP&CO
 
Call Girls Kengeri Satellite Town Just Call 👗 7737669865 👗 Top Class Call Gir...
Call Girls Kengeri Satellite Town Just Call 👗 7737669865 👗 Top Class Call Gir...Call Girls Kengeri Satellite Town Just Call 👗 7737669865 👗 Top Class Call Gir...
Call Girls Kengeri Satellite Town Just Call 👗 7737669865 👗 Top Class Call Gir...amitlee9823
 
RSA Conference Exhibitor List 2024 - Exhibitors Data
RSA Conference Exhibitor List 2024 - Exhibitors DataRSA Conference Exhibitor List 2024 - Exhibitors Data
RSA Conference Exhibitor List 2024 - Exhibitors DataExhibitors Data
 
Call Girls Pune Just Call 9907093804 Top Class Call Girl Service Available
Call Girls Pune Just Call 9907093804 Top Class Call Girl Service AvailableCall Girls Pune Just Call 9907093804 Top Class Call Girl Service Available
Call Girls Pune Just Call 9907093804 Top Class Call Girl Service AvailableDipal Arora
 
Cracking the Cultural Competence Code.pptx
Cracking the Cultural Competence Code.pptxCracking the Cultural Competence Code.pptx
Cracking the Cultural Competence Code.pptxWorkforce Group
 
Insurers' journeys to build a mastery in the IoT usage
Insurers' journeys to build a mastery in the IoT usageInsurers' journeys to build a mastery in the IoT usage
Insurers' journeys to build a mastery in the IoT usageMatteo Carbone
 
Call Girls From Pari Chowk Greater Noida ❤️8448577510 ⊹Best Escorts Service I...
Call Girls From Pari Chowk Greater Noida ❤️8448577510 ⊹Best Escorts Service I...Call Girls From Pari Chowk Greater Noida ❤️8448577510 ⊹Best Escorts Service I...
Call Girls From Pari Chowk Greater Noida ❤️8448577510 ⊹Best Escorts Service I...lizamodels9
 

Kürzlich hochgeladen (20)

The Path to Product Excellence: Avoiding Common Pitfalls and Enhancing Commun...
The Path to Product Excellence: Avoiding Common Pitfalls and Enhancing Commun...The Path to Product Excellence: Avoiding Common Pitfalls and Enhancing Commun...
The Path to Product Excellence: Avoiding Common Pitfalls and Enhancing Commun...
 
Call Girls In Panjim North Goa 9971646499 Genuine Service
Call Girls In Panjim North Goa 9971646499 Genuine ServiceCall Girls In Panjim North Goa 9971646499 Genuine Service
Call Girls In Panjim North Goa 9971646499 Genuine Service
 
Phases of Negotiation .pptx
 Phases of Negotiation .pptx Phases of Negotiation .pptx
Phases of Negotiation .pptx
 
Falcon's Invoice Discounting: Your Path to Prosperity
Falcon's Invoice Discounting: Your Path to ProsperityFalcon's Invoice Discounting: Your Path to Prosperity
Falcon's Invoice Discounting: Your Path to Prosperity
 
FULL ENJOY Call Girls In Mahipalpur Delhi Contact Us 8377877756
FULL ENJOY Call Girls In Mahipalpur Delhi Contact Us 8377877756FULL ENJOY Call Girls In Mahipalpur Delhi Contact Us 8377877756
FULL ENJOY Call Girls In Mahipalpur Delhi Contact Us 8377877756
 
Call Girls In Noida 959961⊹3876 Independent Escort Service Noida
Call Girls In Noida 959961⊹3876 Independent Escort Service NoidaCall Girls In Noida 959961⊹3876 Independent Escort Service Noida
Call Girls In Noida 959961⊹3876 Independent Escort Service Noida
 
Call Girls Service In Old Town Dubai ((0551707352)) Old Town Dubai Call Girl ...
Call Girls Service In Old Town Dubai ((0551707352)) Old Town Dubai Call Girl ...Call Girls Service In Old Town Dubai ((0551707352)) Old Town Dubai Call Girl ...
Call Girls Service In Old Town Dubai ((0551707352)) Old Town Dubai Call Girl ...
 
Forklift Operations: Safety through Cartoons
Forklift Operations: Safety through CartoonsForklift Operations: Safety through Cartoons
Forklift Operations: Safety through Cartoons
 
Value Proposition canvas- Customer needs and pains
Value Proposition canvas- Customer needs and painsValue Proposition canvas- Customer needs and pains
Value Proposition canvas- Customer needs and pains
 
How to Get Started in Social Media for Art League City
How to Get Started in Social Media for Art League CityHow to Get Started in Social Media for Art League City
How to Get Started in Social Media for Art League City
 
VVVIP Call Girls In Greater Kailash ➡️ Delhi ➡️ 9999965857 🚀 No Advance 24HRS...
VVVIP Call Girls In Greater Kailash ➡️ Delhi ➡️ 9999965857 🚀 No Advance 24HRS...VVVIP Call Girls In Greater Kailash ➡️ Delhi ➡️ 9999965857 🚀 No Advance 24HRS...
VVVIP Call Girls In Greater Kailash ➡️ Delhi ➡️ 9999965857 🚀 No Advance 24HRS...
 
A DAY IN THE LIFE OF A SALESMAN / WOMAN
A DAY IN THE LIFE OF A  SALESMAN / WOMANA DAY IN THE LIFE OF A  SALESMAN / WOMAN
A DAY IN THE LIFE OF A SALESMAN / WOMAN
 
Organizational Transformation Lead with Culture
Organizational Transformation Lead with CultureOrganizational Transformation Lead with Culture
Organizational Transformation Lead with Culture
 
Business Model Canvas (BMC)- A new venture concept
Business Model Canvas (BMC)-  A new venture conceptBusiness Model Canvas (BMC)-  A new venture concept
Business Model Canvas (BMC)- A new venture concept
 
Call Girls Kengeri Satellite Town Just Call 👗 7737669865 👗 Top Class Call Gir...
Call Girls Kengeri Satellite Town Just Call 👗 7737669865 👗 Top Class Call Gir...Call Girls Kengeri Satellite Town Just Call 👗 7737669865 👗 Top Class Call Gir...
Call Girls Kengeri Satellite Town Just Call 👗 7737669865 👗 Top Class Call Gir...
 
RSA Conference Exhibitor List 2024 - Exhibitors Data
RSA Conference Exhibitor List 2024 - Exhibitors DataRSA Conference Exhibitor List 2024 - Exhibitors Data
RSA Conference Exhibitor List 2024 - Exhibitors Data
 
Call Girls Pune Just Call 9907093804 Top Class Call Girl Service Available
Call Girls Pune Just Call 9907093804 Top Class Call Girl Service AvailableCall Girls Pune Just Call 9907093804 Top Class Call Girl Service Available
Call Girls Pune Just Call 9907093804 Top Class Call Girl Service Available
 
Cracking the Cultural Competence Code.pptx
Cracking the Cultural Competence Code.pptxCracking the Cultural Competence Code.pptx
Cracking the Cultural Competence Code.pptx
 
Insurers' journeys to build a mastery in the IoT usage
Insurers' journeys to build a mastery in the IoT usageInsurers' journeys to build a mastery in the IoT usage
Insurers' journeys to build a mastery in the IoT usage
 
Call Girls From Pari Chowk Greater Noida ❤️8448577510 ⊹Best Escorts Service I...
Call Girls From Pari Chowk Greater Noida ❤️8448577510 ⊹Best Escorts Service I...Call Girls From Pari Chowk Greater Noida ❤️8448577510 ⊹Best Escorts Service I...
Call Girls From Pari Chowk Greater Noida ❤️8448577510 ⊹Best Escorts Service I...
 

Rethinking the Simple Payback Period for Energy Efficiency in Commercial buildings

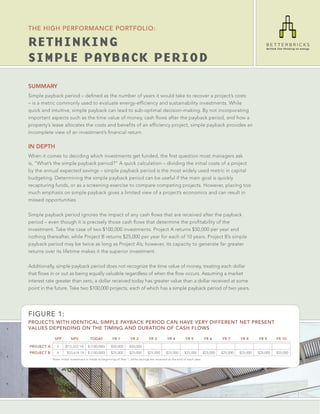
  • 1. THE HIGH PERFORMANCE PORTFOLIO: RETHINKING SIMPLE PAYBACK PERIOD SUMMARY Simple payback period – defined as the number of years it would take to recover a project’s costs – is a metric commonly used to evaluate energy-efficiency and sustainability investments. While quick and intuitive, simple payback can lead to sub-optimal decision-making. By not incorporating important aspects such as the time value of money, cash flows after the payback period, and how a property’s lease allocates the costs and benefits of an efficiency project, simple payback provides an incomplete view of an investment’s financial return. IN DEPTH When it comes to deciding which investments get funded, the first question most managers ask is, “What’s the simple payback period?” A quick calculation – dividing the initial costs of a project by the annual expected savings – simple payback period is the most widely used metric in capital budgeting. Determining the simple payback period can be useful if the main goal is quickly recapturing funds, or as a screening exercise to compare competing projects. However, placing too much emphasis on simple payback gives a limited view of a project’s economics and can result in missed opportunities. Simple payback period ignores the impact of any cash flows that are received after the payback period – even though it is precisely those cash flows that determine the profitability of the investment. Take the case of two $100,000 investments. Project A returns $50,000 per year and nothing thereafter, while Project B returns $25,000 per year for each of 10 years. Project B’s simple payback period may be twice as long as Project A’s; however, its capacity to generate far greater returns over its lifetime makes it the superior investment. Additionally, simple payback period does not recognize the time value of money, treating each dollar that flows in or out as being equally valuable regardless of when the flow occurs. Assuming a market interest rate greater than zero, a dollar received today has greater value than a dollar received at some point in the future. Take two $100,000 projects, each of which has a simple payback period of two years. FIGURE 1: PROJECTS WITH IDENTICAL SIMPLE PAYBACK PERIOD CAN HAVE VERY DIFFERENT NET PRESENT VALUES DEPENDING ON THE TIMING AND DURATION OF CASH FLOWS SPP NPV TODAY YR 1 YR 2 YR 3 YR 4 YR 5 YR 6 YR 7 YR 8 YR 9 YR 10 PROJECT A 2 ($13,223.14) $ (100,000) $50,000 $50,000 PROJECT B 4 $53,614.18 $ (100,000) $25,000 $25,000 $25,000 $25,000 $25,000 $25,000 $25,000 $25,000 $25,000 $25,000 Note: Initial investment is made at beginning of Year 1, while savings are received at the end of each year.
  • 2. FIGURE 2: PROJECTS WITH IDENTICAL FIRST COST AND SIMPLE PAYBACK PERIOD Project A returns $50,000 at the end of each year, but Project C returns CAN BE RANKED BY CALCULATING $100,000 at the end of Year 2. Although both projects have the same THE PV OF FUTURE CASH FLOWS simple payback period, Project A is clearly superior to Project C. Project SPP PV YR 1 YR 2 A’s returns have a higher “present value” because the first $50,000 is PROJECT A 2 $86,776.86 $50,000 $50,000 returned twelve months earlier when those dollars are worth more. PROJECT C 2 $82,644.63 $100,000 Notes: Example assumes savings are received at the end of each year. PV calculation assumes a discount rate of 10%. Another consideration when evaluating expense-reducing investments is the likelihood of receiving one or more future cash flows – or the risk that those cash flows may disappear over time. In many cases, the probability of receiving projected cash flows varies over the lifetime of an investment, a nuance that exceeds the capabilities of a simple payback calculation. For example, uncertainties regarding future energy prices, the operating performance of a capital project and the persistence of energy-saving behavior can impact whether estimated savings are actually realized. Managers who value the ability to factor risks such as these into their decision-making favor more sophisticated approaches, such as discounted cash flow modeling. In many real estate firms, there is often a “rule-of-thumb” for capital investment decisions – such as only pursuing projects that are “less than two-year simple payback.” Having such a rigid threshold for project approval seems arbitrary when factoring in market conditions, organizational hurdle rates, or the holding period of a building. Many managers will deny approval for an energy-saving project whose simple payback period exceeds this “rule-of-thumb” without realizing that competing investment opportunities offer far lower rates of return. In fact, this obsession with a two-year payback threshold persists despite significant variation in both market interest rates and the rates of return offered by other investments over the last several decades. FIGURE 3: THE SIMPLE PAYBACK PERIOD THAT A LANDLORD SEES WILL DEPEND ON HOW A PROJECT’S FIRST COST AND SAVINGS ARE ALLOCATED BETWEEN LANDLORD AND TENANT YR 1 YR 2 YR 3 YR 4 YR 5 YR 6 YR 7 YR 8 YR 9 YR 10 LANDLORD RECEIVES ALL SAVINGS First cost $ (100,000) Total annual savings $50,000 $50,000 $50,000 $50,000 $50,000 $50,000 $50,000 $50,000 $50,000 $50,000 Landlord’s SPP: 2 Landlord’s NPV: $207,228.36 LANDLORD SHARES SAVINGS WITH TENANT Landlord’s portion of savings 50% $25,000 $25,000 $25,000 $25,000 $25,000 $25,000 $25,000 $25,000 $25,000 $25,000 Tenant’s portion of savings 50% $25,000 $25,000 $25,000 $25,000 $25,000 $25,000 $25,000 $25,000 $25,000 $25,000 Landlord’s SSP: 4 Landlord’s NPV: $53,614.18 LANDLORD RECOVERS TENANT’S SHARE OF SAVINGS Landlord’s portion of savings 50% $25,000 $25,000 $25,000 $25,000 $25,000 $25,000 $25,000 $25,000 $25,000 $25,000 Cap Ex recoveries that offset tenant’s savings $25,000 $25,000 $25,000 $25,000 Landlord’s total annual cash flows $50,000 $50,000 $50,000 $50,000 $25,000 $25,000 $25,000 $25,000 $25,000 $25,000 Landlord’s SPP with Cap Ex recoveries: 2 Landlord’s NPV: $132,860.81 Notes: Example assumes that the initial investment is made at the beginning of Year 1, while savings are received at the end of each year. NPV calculation considers all listed cash flows and assumes a discount rate of 10%. Lease language, tenant turnover and other factors ultimately determine the magnitude and duration of recoveries in the final scenario.
  • 3. A simple payback period is only as accurate as the costs and benefits that were used to calculate it. It is impossible to compute a project’s simple payback period unless the values used for the numerator and denominator reflect a project’s true costs and savings, respectively. For example, a project’s first cost should be reduced by the amount of any rebates or other incentives received, such as a utility energy- efficiency incentive or a potential tax credit. Failure to do so overstates the length of time necessary to recover that investment. When evaluating investments made in landlord/tenant settings, properly calculating the simple payback period is rarely simple. In the case of a project that would reduce energy costs in the building, any capital expense reimbursements that the leases permit the landlord to collect from tenants should be recorded as additional cash inflows. These assessments help reduce the project’s simple payback period when viewed from the landlord’s perspective. One should also consider how the leases would allocate the estimated savings between the landlord and tenants. If the leases allow the tenants to keep a portion of the savings, those dollars must be excluded when calculating simple payback period from the landlord’s perspective. On the other hand, the landlord’s share of savings could affect the property’s net operating income (NOI) and asset value. According to the Income Approach to Appraisal, an incremental dollar of NOI supports an incremental $10 in asset value at a capitalization rate of 10%. (This assumes that the NOI increase is persistent enough to be factored into the appraisal when the property is refinanced or sold.) If the landlord’s share of savings were verified (and persistent), such an increase in appraised value alone could exceed the landlord’s original investment in the energy-saving project, generating a simple payback period that could be measured in days rather than years. THE BOTTOM LINE: • Simple payback calculations often provide a quick • Given the complexity of properly allocating the costs but limited view of the financial performance of an and benefits of expense-reducing capital projects in investment. landlord/tenant settings, and the impact that energy • Simple payback does not consider time value savings can have on a property’s net operating of money, split incentives defined in leases, or income and asset value, any calculation of simple other risks and uncertainties common in capital payback should be supplemented with more robust decisions. financial metrics, such as internal rate of return, net present value, and/or life-cycle cost. USEFUL LINKS: The High Performance Portfolio www.betterbricks.com/office/framework August 2009 www.betterbricks.com/office/briefs