SlideShare ist ein Scribd-Unternehmen logo
1 von 44
Downloaden Sie, um offline zu lesen
Payout Policy: A Shareholder-Level Analysis
Jennifer Blouin
University of Pennsylvania
(blouin@wharton.upenn.edu)
Maria E. Nondorf
University of California at Berkeley
(nondorf@haas.berkeley.edu)
First Draft: January 2004
This Version: February 18, 2004
Preliminary
1
Abstract
This paper attempts to link the share repurchase decision with shareholder-level taxes. By
looking at payout policy relative to insider, institutional and blockholder shareholdings, we
document that the methods of distribution, either dividends or repurchases, appear to differ
among the different classes of shareholders. To date, this is the most comprehensive study of
shareholder composite on payout policy. Consistent with the tax clienteles hypothesis, we find
that insider holdings are higher in firms who repurchase shares or do not distribute funds at all
and lower in firms that distribute via only dividends or make distributions using both dividends
and repurchases. In contrast, institutional holdings are higher in firms that distribute using
dividends or a combination of dividends and repurchases and lower for firms that use
repurchases or do not make any distributions. There are no such clear patterns in blockholder
shareholdings. Furthermore, we find a positive association between firm repurchase activity and
the interaction of our measures of influential investors and a measure of shareholders’ tax
preference for capital gains. The sum of our evidence demonstrates that the tax status of
influential shareholders plays a significant role in whether and how firms distribute proceeds to
shareholders.
2
1. Introduction
That share repurchases have become a prominent form of payout for U.S. corporations is
incontrovertible. In response to this increase in prominence, recent academic research has
documented that managers of firms had numerous firm-specific reasons for increasing their
repurchase activity as an alternative to or as a supplement to dividend payouts (see, for example,
Allen and Michaely (2003) for an overview of the payout policy literature and Brav, Graham,
Harvey, and Michaely (2003) for managers’ perspectives from recent surveys and field
interviews). Anecdotally, one of the determinants of share repurchase activity is their tax
advantage relative to dividends for certain classes of shareholders (called the “tax clienteles
hypothesis”).1
We attempt to link repurchase activity to the tax clienteles hypothesis by
examining the ownership structure of firms that repurchase compared to firms that utilize other
forms of distribution. Using detailed shareholder data, this paper seeks to link the puzzles
surrounding payout policy to a group that is arguably the most affected by the payout decision, a
firm’s shareholders.
If a distribution is paid out as a dividend, it is fully taxable to certain classes of
shareholders. But if it is paid out as a share repurchase, the payment results in a capital gain to
shareholders in the amount of the difference between the cost of the shares and the repurchase
value of the shares tendered. In addition to the difference between ordinary and capital gains tax
rates, most of the capital gains on repurchases are accrued by shareholders not tendering their
shares and are thus not realized. A large part of the dividend puzzle involves the argument that,
if distributions are going to be made to shareholders, share repurchases are a relatively tax-
1
Note that we are examining what are called the “holding clienteles” (i.e., those shareholder groups who seek to buy
and hold shares in a particular company based upon benefits derived from their particular shareholder tax status) as
opposed to “trading clienteles” (i.e., those shareholders who buy and sell a stock based on a particular trading
strategy for which their tax status provides relative benefits). Please see Dhaliwal, Erickson, and Trezevant (1999)
for further distinction on this issue.
3
favorable method and should therefore be preferred to dividends (Black (1976) and Allen and
Michaely (2003)). Again, this argument is only true for certain classes of investors, primarily
individual investors.
In order to examine the clienteles of firms that make payouts, we utilize a large sample of
insider, institutional and blockholder shareholder data to evaluate the mix of shareholders for
firms that undergo repurchases compared to firms that do not. We also examine the changes in
shareholder mix around repurchases to evaluate the classes of shareholders who tender their
shares in a repurchase program. Of course, analyzing the mix of shareholders for firms that
make payoffs can address more than the tax clienteles hypothesis. Our research can also support
evidence on other motives for making shareholder distributions. Our initial tests focus on the tax
clienteles hypothesis because it is such a prominent feature of the dividend puzzle2
and using
shareholder-level data can directly address the clienteles effect. Further, as discussed below, the
results of existing research on tax clienteles have been decidedly mixed.
As we consider insider owners to primarily be individual investors for tax purposes, we
find evidence consistent with the tax clienteles hypothesis where influential insiders appear to
affect payout policy. Supporting individual shareholders’ preferences for capital gains, we find
significantly greater insider ownership in firms that either make no distributions or distribute
only through repurchases relative to firms who pay out dividends. Furthermore, an analysis of
the differential between insider ownership and institutional holdings for significant repurchasers
(i.e., those that buy back more than 5% of their outstanding shares) is indicative of insider
holdings increasing and institutional holdings decreasing. Said another way, those firms that are
2
As noted by Allen and Michaely (2003), individual shareholders pay substantial taxes for dividends that they
receive. They report that over 50% of the dividends paid out by corporations from 1973-1996 were to individuals
and most of these individuals were in high tax brackets.
4
large repurchasers have larger insider owners relative to instiutional holders, consistent with
insiders desiring tax preferred repurchases.
We examine institutional shareholders as one undifferentiated mass.3
By considering this
group of shareholders together, we are able to hypothesize that these shareholders will be less
sensitive to the spread between dividends and capital gains rates (as the group contains both non-
taxable and taxable entities). Consistent with Grinstein and Michaely (2003), we find that firms
with lower institutional ownership levels do not pay dividends or repurchase shares.
Interestingly, when our measure for an individual’s preference for capital gains is interacted with
institutional holdings, we find a positive association suggesting that institutions are sensitive to
individual taxes. This is indicative of institutional investors passing through fund income to
taxable individuals.
No discernable relation between blockholders or diffuse non-influential shareholders is
identified. The results for blockholders are consistent with those presented in Barclay,
Holderness, and Sheehan (2003) who examine dividend payouts in the presence of corporate
blockholders. These results are also consistent with the notion that these types of investors
represent a broad mix of shareholder types that precludes differentiating between tax clienteles.
The results of our research contribute to our understanding of firms’ payout policies in
several important ways. First, we advance the study of tax clientele effects on payout policy. In
addition to directly linking classes of shareholders to tax rates and payout policy, we have
demonstrated that the shift in investor composite over time is related to increases in tax-
advantaged repurchase activity. Further, we have shown that the shift in corporate payout
behavior can be linked to the increase in individual shareholder participation in the market.
3
Future versions of this paper will delve into the details of our institutional owner database in an attempt to
distinguish among institutional investors and their taxable form.
5
Second, because we use a comprehensive ownership dataset, we are able to assess the
relative effects for each major shareholder group on payout policy. Existing research on payout
policy examines only one class of shareholders in relation to firms’ payout decisions (see for
example, Lee, Mikkelson, and Partch (1992) for analysis of insider trades around tender offer
repurchase announcements and Lie and Lie (1999), Perez-Gonzalez (2003), and Grinstein and
Michaely (2003) for analysis of institutional shareholders and various forms of payout; see also
Barclay, Holderness, and Sheehan (2003) for a study examining the impact of large corporate
blockholders on dividends). Controlling for all classes of shareholders extends our
understanding of the different behavior of shareholder groups and will help to clarify the motives
for payout policy as a corporate financing decision.
Third, we contribute to the research that examines a more complete picture of firms’
payout policy by analyzing both dividends and repurchases.4
Much research on the tax clienteles
hypothesis focuses solely on dividend payouts. (See, for example, Dhaliwal, Erickson, and
Trezevant (1999), Ayers, Cloyd, and Robinson (2002), Dhaliwal, Li, and Trezevant (2003), and
Perez-Gonzalez (2003).) Note that these studies also primarily focus on institutional
shareholders as the group driving tax clienteles. Overall, our research contributes by presenting
a comprehensive analysis of payout policy using a comprehensive breakdown of shareholdings.
The paper proceeds as follows: section 2 discusses the general effects that various groups
of shareholders bring to bear on corporate financing decisions. The section also covers related
literature on the tax clienteles hypothesis and develops the specific hypotheses that we test.
Section 3 highlights our data and sample selection procedures. Sections 4 through 6 present the
4
As noted in Allen and Michaely (2003), to truly examine the complete payout picture, researchers should also
consider cash paid out in the form of liquidating dividends (from, for example, a merger or acquisition transaction).
They also note that analysis of net payouts should consider the impact of inflows from equity offerings. Future
drafts of this paper will consider these additional pieces of the payout picture.
6
empirical results of the tests of our hypotheses and section 7 provides our conclusions and
directions for future work.
2. Background and Development of Hypotheses
A large body of research in the past 30 years has linked the corporate financing decisions
of firms to various classes of shareholders. There are generally considered to be four classes of
shareholders that are examined. These broad classes are 1) insider shareholders, 2) institutional
shareholders, 3) non-insider/non-insitutional blockholders (hereafter, “blockholders”), and 4)
diffuse non-influential shareholders. In the following paragraphs, we briefly define each class
and generally describe the theoretical and empirical characteristics that underlie the effects that
each class has on firms’ corporate financing behavior, particularly their payout behavior.5
We
also document our proposed link between each class and the tax clienteles hypothesis.
2.1 Insider Ownership
One of the primary considerations regarding insider, primarily managerial, ownership is
the principal-agent issues that can arise between managers and shareholders (e.g., Jensen and
Meckling (1976), Holmstrom (1979), and Homstrom and Milgrom (1987)). There is a
theoretically optimal amount of shares that managers should hold that will link their incentives to
the incentives of the other shareholders while at the same time minimizing their private benefits
and the probability of outside takeovers.
Regarding the agency problem and payout policy, both dividends and repurchases are
seen as a mechanism to disgorge the firm of free cash flow that could otherwise be used by
managers in their own interests (Rozeff (1982), Easterbrook (1984), and Jensen (1986)). A
5
Please refer to section 3 for information regarding the construction of our empirical variables that link to these
shareholder classes.
7
recent paper by Hu and Kumar (2004) examines managerial entrenchment in relation to firms’
payoff policies and finds that executive entrenchment levels have an asymmetric influence on
dividend versus share repurchase payout policies. However, none of these papers consider the
personal tax reasons that managers may have for undertaking a particular payout policy.
2.2 Institutional Ownership
There is a great deal of debate surrounding the effects of institutional shareholders on
corporate financing policy. The theoretical treatment of institutional shareholders differs greatly
from that of insiders. While managers are viewed as receiving their equity stake as part of an
optimal contract signed with shareholders, institutional investors are modeled as shareholder-
monitors who choose their optimal equity stake through the open-market trading of shares.
Examples of models that look at the optimal equity stake of monitors include Admati, Pleiderer,
and Zechner (1994) and Maug (1998). The liquidity benefits and risk-diversification of
dispersed ownership are contrasted with the control benefits of ownership concentration and their
attendant free-rider problem.
Grinstein and Michaely (2003) perform an extensive analysis of institutional
shareholdings and payout policy. They summarize the effects of ownership structure, in
particular, institutional shareholdings, on payout policy by spelling out the following theories.
First, they discuss Jensen’s (1986) argument (as mentioned above), that institutions, in their roles
as monitors, will induce higher overall payouts. Second, as posited by Allen, Bernardo, and
Welch (2000), institutional shareholders may prefer firms that issue dividends (over those that
repurchase or those that do not make any distributions) because of institutional charter and
prudent-man rule restrictions and because of the comparative tax advantage that some
institutions have for dividends. We discuss this implication for tax clienteles below.
8
Third, Grinstein and Michaely (2003) cite the differences in payout preferences between
informed investors (of which institutional shareholders are often considered part) and
uninformed investors as predicted by Barclay and Smith (1988) and Brennan and Thakor (1990).
Uninformed (or dispersed) shareholders prefer dividends, which are distributed pro rata to all
shareholders, compared to repurchases, which are only tendered by certain shareholders where
the uninformed shareholders know that they do not possess the level of information of other
shareholders (and, above all, managers). Thus, firms will separate into dividend-payers and
repurchasers depending on the perceived level of information held by their shareholders.
The empirical results of Grinstein and Michaely (2003) indicate that firms with higher
institutional shareholdings prefer dividend-paying firms and firms that make regular repurchases.
However, their results do not support models that predict that high dividends (in terms of yield)
attract institutional clienteles (e.g., Allen, Bernardo, and Welch (2000)) or models that predict
that institutions cause firms to increase their payouts (e.g., Jensen (1986)). Grinstein and
Michaely’s (2003) results are important for our study because they document the link between
institutional holdings and payout policy. However, we focus on the tax clienteles hypothesis,
and more importantly, we control for other classes of shareholders in our analysis.
2.3 Blockholders
Blockholders represent large, potentially influential shareholders that are neither insiders
(managers) nor institutions. Much of the theory surrounding institutional shareholders can be
applied to blockholders in that these shareholders are considered to affect corporate financing
policy and are often considered to be more informed than diffuse individual shareholders.
Blockholdings often lack the features that define institutions, such as reporting requirements and
organizational structure and thus, can be comprised of one or more influential individuals or an
9
entity of any organizational form. Because of their perceived roles as monitors and because a
blockholding is often considered a toe-hold for a future increase in ownership stake, much of the
research on blockholders has focused on models of takeovers (e.g., Shleifer and Vishny (1986)
and Hirshleifer and Titman (1990)).
As far as payout policy preferences, the effect of monitors on payout levels (Jensen
(1986)) would apply to blockholders. Further, the payout policy preferences of informed versus
uninformed shareholders (Barclay and Smith (1988) and Brennan and Thakor (1990)) would also
apply here, where blockholders would be considered relatively informed investors.
Barclay, Holderness, and Sheehan (2003) empirically examine the effect of corporate
block ownership on dividend policy, finding no evidence that dividends are higher for firms with
corporate blockholders. As their primary hypothesis relates to the impact of corporate
blockholders on tax clienteles, we defer further discussion of this paper for now. To our
knowledge, with the exception of Barclay et. al. (2003), there has been no other empirical
research focusing on the effects of outside blockholders on payout policy.
2.4 Diffuse Non-influential Shareholders
To round out our comprehensive examination of firm shareholdings and payout policy,
we consider the final class of shareholders to be those shareholders who own small percentages
and are likely not able to affect the corporate financing decisions of firms. In theoretical cost-
benefit terms, if institutional and blockholding shareholders are considered to be monitors, non-
influential shareholders are considered to be free-riders. Further, if institutional and
blockholding shareholders are considered to be informed, this class of shareholders is considered
to be relatively uninformed.
10
Regarding payout policy, if these non-influential shareholders represent the majority of
shareholders for an organization and/or there is no concentration of ownership among the other
three classes, the relationship between the payout policy decision and level of diffuse ownership
should be as predicted by the theories covered above. As far as we are aware, there is no other
empirical study that explicitly controls for this shareholding class in its analysis.
This shareholder class, while often considered to be comprised of individuals, can in
reality take any organizational form, from individual to corporation, in our analysis. Thus, as
discussed below, their effects on tax clienteles is ambiguous.
2.5 Tax Clienteles
Tax clienteles exist because there is variation in the marginal tax rates of shareholders.
Miller’s (1977) analysis of capital structure implies that dividend clienteles will exist whereby
high dividend yield stocks will be held by low marginal tax rate investors and vice versa. To
summarize the general predictions of payout policy and tax clienteles, we initially display a
classification scheme as presented in Allen and Michaely (1995):
Shareholder group: Asset holdings:
High tax bracket Low dividend payout assets
Corporations High dividend payout assets
Tax-free institutions Any assets
We recast this scheme based upon the consideration of share repurchases as a payout
mechanism for our four classes of shareholdings as follows:
11
Shareholder class: Asset holdings:
Insider shareholders
• High tax bracket
• Individuals
• Low dividend payout assets
• Repurchase payout assets
Institutional shareholders
• Taxable institutions
• Tax-exempt institutions
• Overall payout policy is less
sensitive to tax effects than
firms with influential insider
shareholders
Blockholders
• Individuals
• Corporations
• Tax-exempt entities
• Ambiguous tax effects
Diffuse non-influential shareholders
• Individuals
• Corporations
• Tax-exempt entities
• Ambiguous tax effects
We discuss these classifications in terms of our specific hypotheses, below. First,
however, we discuss the extant literature on tax clienteles. Early empirical studies such as Elton
and Gruber (1970), Miller and Scholes (1978 and 1982), and Litzenberger and Ramaswamy
(1979, 1980, and 1982) examine the relation between stock returns, dividend yield, and the
differential taxes between dividends and capital gains. The results of these and numerous other
more recent empirical studies, which generally do not model the class of shareholder, are mixed.
However, there is compelling recent evidence of clienteles in Graham and Kumar’s
(2003) empirical study examining retail (i.e., individual) investors and their dividend
preferences. They find that, as a group, these investors prefer non-dividend paying stocks over
dividend paying stocks. Further, among their investor sample, lower-tax individuals hold high-
yield stocks. This result fits well with our prediction that insider shareholders (and various sub-
groups of blockholders and diffuse non-influential shareholders) prefer tax advantaged payouts.
12
Further, numerous studies have utilized the level of institutional shareholdings and/or
corporate ownership as a proxy for the tax status of a firm’s investors (e.g., Dhaliwal, Erickson,
and Trezevant (1999), Ayers, Cloyd, and Robinson (2002), Dhaliwal, Li, and Trezevant (2003)).
Dhaliwal et. al. (1999) examine the effects of an initiation of dividend payouts on changes in
institutional ownership percentages, concluding that institutional ownership increases when
dividends are initiated by a corporation.
Conditional upon whether or not dividends were paid, Ayers et. al. (2002) empirically
examine whether the investor-level tax effects from the increase in ordinary (dividends) tax rates
that was imposed the Revenue Recognition Act of 1993 affected firm stock returns. They find
evidence of a clientele effect in that the level of institutional holdings mitigated the negative
stock price reaction for dividend-paying firms.
A closely-related study by Dahliwal et. al. (2003) examines the interaction of dividend
yield and the institutional/corporate ownership indicator on stock returns. They conclude that
stock returns are penalized by dividend taxes and that institutional/corporate ownership mitigates
this penalty.
One problem with using institutional shareholdings as the proxy for the tax status of
investors is that institutional investors are comprised of both taxable (e.g., flow-thru mutual
funds) and tax-exempt entities (e.g., college and pension funds). Strickland (1996) finds that, for
a fairly comprehensive sample of corporations, the holdings of taxable institutions outweigh the
holdings of tax-exempt institutional holdings. At any rate, our study builds on these results by
considering shareholder classes beyond institutions and corporations and by also considering the
repurchase mechanism as a form of payout.
13
In addition to Grinstein and Michaely’s (2003) study, discussed above, other papers have
examined the effects of institutional shareholdings on method of payment. Lie and Lie (1999)
hypothesize that decision-makers are more sensitive to shareholders’ tax positions if the firm has
a large fraction of institutional investors. They assume that if this the case, firms with high
institutional holdings will still prefer repurchases over tax-disfavored dividends despite the
possibility that if institutional investors are affecting payout policy, and if they are tax-exempt,
they would be indifferent between payout method (ceteris paribus).6
Examining all classes of
ownership allows us to more accurately rank payout preference by ownership class.
Perez-Gonzalez (2003) attempts to identify the influential shareholder in an organization
and tests the association of the tax status of this influential party to levels of dividend payout.
This approach allows him to differentiate between the tax incentive effects that the most
concentrated shareholder may possess. He documents that in a number of firms, the largest
shareholder is an individual blockholder. He also finds evidence that the dividend yield varies
with the relative tax disadvantage of dividends (as compared to capital gains) over a period of
time consistent with the largest shareholder influencing a firm’s proclivity to pay dividends.
Similar to Perez-Gonzalez (2003) in the identification of an influential party, Barclay,
Holderness, and Sheehan (2003), as noted above, identify corporate blockholders as an
influential party in firms’ payout decisions. In fact, they posit that large corporate blockholders
can request or even demand that management increase dividends. They call their perspective the
“controlling shareholder view” of dividends. Barclay et. al. (2003) hypothesize that corporate
shareholders will cause firms to issue high levels of dividends as these distributions have a small
tax effect on corporations because of the dividends received deductions available to them. They
6
Although the authors hypothesize and discuss their tax clienteles hypothesis in relation to the level of institutional
ownership, Lie and Lie’s (1999) study does not explicitly report any tests of the repurchase/dividend decision in
association with institutional ownership.
14
find no evidence that large corporate shareholders are attracted to firms with high dividend
payouts. Their results are counter to the clienteles hypothesis. However, they do not control for
other classes of shareholders and again, this study does not examine repurchases.
These studies go a long way into furthering our understanding of the clientele effects on
payout policy. Our paper expands upon this research by examining the full composite of
shareholdings (institutional shareholdings, plus insider, blockholder, and dispersion measures).
We examine how the full mix of shareholdings correlates with the relative tax advantage of
repurchasing over dividends.
2.6 Hypothesis Development
The specific hypotheses that we test in this paper build on our knowledge of various
shareholder classes, their potential impact on firms’ payout decisions, and their potential tax
clientele effects. First, in order to confirm and slightly expand previous research on the
influence of shareholder classes on payout policy, we propose the following hypothesis:
H1A: All else equal, firms with higher levels of repurchase activity and firms that
do not make distributions experience higher levels of insider ownership than firms
that pay out dividends and firms that both issue dividends and pay repurchases.
This hypothesis follows from the presumption that insiders are individual shareholders in
higher marginal tax rates. And, as such, capital appreciation is their preferred mechanism to
recognize investment profits.
An associated hypothesis relates to institutional shareholders, as follows:
H1B: All else equal, firms with positive distribution levels, whether dividends, or
repurchases, or both, are associated with higher levels of institutional ownership
than firms that do not make distributions.
From a tax clientele perspective, this hypothesis is formulated based upon the prediction
that institutional investors’ asset holdings should be less sensitive to tax effects than insiders.
15
Further, we would expect this result based on Grinstein and Michaely’s (2003) findings that
institutions prefer firms that do make some level of dividend payouts and firms that repurchase.
As noted above, the tax clientele effects of shareholder distributions are ambiguous for
blockholders and diffuse non-influential shareholders. Thus, we have no tax-related predictions
for these groups. However, it is important to include them in our analysis because of their
potential effects on the non-tax motives for repurchasing. While the non-tax motives for
distributions are expected to be similar for institutional shareholders and blockholders, these
motives are expected to be quite different for non-monitor/less informed shareholders.
The tax rate on repurchases relative to dividends has varied over time. To further
examine whether shareholder composite alters a firm’s payout, we test whether the magnitude of
the tax advantage of repurchases varies with changes in the spread between the capital gains and
dividend tax rates. We predict that the effect on payout policy as related to taxable investors is
increasing in the spread between capital gains and dividends tax rates. We present this as our
second hypothesis.
H2A: All else equal, the relation between repurchase activity and insider
shareholdings is increasing in the magnitude of the spread between capital gains
and dividend tax rates.
This hypothesis seeks to find direct evidence that the insider shareholder class affects
payout policy in relation to the tax impact of the payouts. We have a related prediction for
institutional shareholdings based upon their relative insensitivity to tax rates, as follows:
H2B: The relation between repurchase activity and institutional shareholdings,
conditional upon the spread between capital gains and dividends tax rates, is less
than for that of insider shareholdings.
Again, we do not have tax-related predictions for our blockholder and diffuse non-
influential shareholder groupings.
16
In an effort to substantiate our initial findings, we also look at firms that undertook
significant repurchases (defined as greater than five percent of shares outstanding) to determine
whether the capital gains preference proxy is associated with who is selling their shares. We
examine if payout policy is related to shareholder tax preferences. Said another way, if certain
types of shareholders prefer a certain type of payout for tax reasons, i.e., repurchases, then the
spread should be related to who is selling. We surmise that the mix of shareholders for firms
who pay out more in repurchases have a decreasing percentage of insider shareholders and an
increasing percentage of institutional shareholders from before to after the repurchase program.
This effect is increasing in the spread between capital gains and dividend tax rates. This leads to
the following hypothesis:
H3: All else equal, for firms with significant repurchases, insider ownership will
decrease and institutional ownership will increase as a result of the repurchase
program.
2.7 Causality - A Cavaet
It is not entirely clear whether ownership structure determines payout policy (which is
what we currently assume) or if payout policy determines corporate ownership. This is a critical
concern that we have thought about as we developed our hypotheses and considered our
empirical tests. This statement is a caveat of our awareness of the issue and our further
consideration of the issue in future versions of the paper.
3. Data and Sample Selection
3.1 Ownership Data
We begin our analysis using the equity ownership dataset developed in Brown, Goldman,
and Nondorf (2003). Brown et. al. develop the dataset using disaggregated ownership data for
17
the majority of publicly traded U.S. corporations from the Compact Disclosure SEC Database
CDs (“CompactD”) for the years 1988-2001. Using the CompactD data, Brown et. al. construct
three mutually exclusive primary variables for equity ownership. We utilize their variables,
constructed as follows:
Insider Ownership (INSIDE%) is the sum of the shares held by officers and directors.
Although non-officer and director beneficial owners of more than ten percent of the company
stock (as custodians or trustees) are also considered insiders for SEC filing purposes, we
consider such shareholders as better fitting the description of blockholders rather than insiders
and therefore exclude such owners from the definition of insider ownership. Thus, this group is
primarily comprised of shareholders who would be considered individuals for tax purposes.7
Institutional Ownership (INSTIT%) is the sum of shares held by institutions filing 13-F
forms with the SEC. Investment companies, organizations, corporations, universities, and other
groups with at least $100 million in equity assets must file 13-Fs on a quarterly basis. Due to the
amalgamated nature of the type of entities in this classification, it is difficult to assess the
ultimate tax status of these shareholders. Future work will involve the detailed classification of
the tax status of significant institutional shareholders, similar to that performed by Perez-
Gonzalez (2003). At this point, however, we assume that institutions as a whole class receive
more favorable tax treatment for dividends (alone, and compared to capital gains) than the
insider ownership group. This assumption appears reasonable because insiders likely earn wages
taxed in the highest tax bracket for ordinary income whereas at least some portion of the
institutional shareholders represent tax-free entities.
7
Other common types of insiders with significant holdings include family trusts and private investment
partnerships, which may or may not be taxable entities. As noted above, because of their role as monitors (vs.
managers) these types of insiders are considered in our “adjusted blockholder ownership” category.
18
Adjusted Blockholder Ownership (BLOCK%) is the sum of shares held by owners of at
least five percent of a company’s shares, excluding insiders and institutional shareholders.
Blockholder data are from SEC forms 13-D, 13-G, and 14D-1. To construct this measure,
Brown et.al. (2003) sum the shares held by insiders and institutions that hold at least five percent
of shares and subtract this from the sum of blockholder shares.
The percentage ownership measures for the above variables are calculated using the total
number of shares outstanding. Similar to Brown et. al. (2003), we use the maximum number of
shares outstanding reported by CompactD, Compustat or CRSP.8
Number of Shareholders (NO_SHLDRS) is our proxy for the diffuseness of equity not
owned by insiders, institutions or blockholders. We collect the total number of shareholders data
from Compustat and subtract the number of insider and institutional shareholders. Like the other
ownership variables, NO_SHLDRS is as of the beginning of the year.
We examine the relation between payout and the previous year’s ownership measures
(i.e., in every analysis the ownership variables represent lagged measures). To some extent, this
approach mitigates our causality concerns.
Further, we exclude firms in the financial services industry, ADRs, closed-end funds and
REITs because the ownership mixes for certain firms may differ from what we hypothesize due
to regulatory requirements.
8
As noted in Brown, Goldman, and Nondorf (2003), the shares outstanding data from CompactD most likely
coincide in time with the ownership data, but these data are often missing. Taking the maximum from CRSP or
Compustat helps to control for the few cases where there was a stock split between the fiscal year-end and the
calendar year-end.
19
3.2 Measures of Payout Activity
We match the Brown et. al. (2003) ownership dataset to firms in the Compustat Industrial
Files. To remain in the sample, each firm-year observation must have information available to
estimate items such as dividends, repurchases, and earnings.
Repurchase Percentage (REPURCH%) is equal to repurchase activity in total dollars
over the sum of total dollars paid in repurchases and common dividends.
Repurchase Activity (REPURCH) is equal to the expenditures for the purchase of
common and preferred stock (Compustat data item #115) minus any reduction in the value
(redemption value) of the net number of preferred shares outstanding (Compustat data item #56).
This is a commonly-used proxy for repurchase activity (see, for example, Grullon and Michaely
(2002)).
Common Dividends (DIVS) are the total dollar dividends declared on the common stock
during the firm’s applicable fiscal year (Compustat data item #21).
Similar to Grullon and Michaely (2002), we classify our sample firms into four payout
policy groups as follows:
Group 1: Firms that make no payouts during a fiscal year (DIVS = 0 and
REPURCH = 0).
Group 2: Firms that make payouts using only dividends (DIVS > 0 and
REPURCH = 0).
Group 3: Firms that make payouts using only repurchases (DIVS = 0 and
REPURCH > 0).
Group 4: Firms that make payouts using a mix of dividends and repurchases
(DIVS > 0 and REPURCH > 0).
3.3 Other Variables of Interest
Tax Spread (THETA_CG) represents our measure of the difference between capital gain
tax rates and tax rates on ordinary income. Existing research examining effects of individual tax
20
rates (e.g., Poterba and Summers (1985)) typically uses a measure of shareholder tax preferences
- theta, θt. It is interpreted as the ratio of the net income that an investor receives from a dollar of
dividends to the net income that the same investor would have received from capital gains and is
defined as θt = [(1 - Maximum federal tax rate on ordinary income) / (1 - Maximum federal long-
term capital gains tax rate)], assuming that the statutory tax rates for individuals are the effective
rates.9
To ease the interpretation of tax effects in our analysis, we use THETA_CG, defined as
(1- θt), as a proxy for individual shareholders’ preference for capital gains. See Table I for the
distribution of THETA_CG over our sample period.
Additional proxies are necessary to control for the numerous non-tax motives for
payouts. These items include measures of the market value of equity, market-to-book, leverage,
estimated stock option levels, operating income and prior-year returns. These variables are
constructed from Compustat and CRSP data and are defined in Appendix 1.
4. The Level of Repurchases in Relation to Ownership Mix
Our first hypothesis is whether or not shareholder composite ownership varies with
corporate payout policy. Specifically, we hypothesize in H1A that because insiders tend to be
subject to differential taxation between capital gains and dividends, they prefer payouts that are
taxed as capital gains. Figure 1 plots mean INSIDE% over our sample period by firm payout
policy grouping. Notice that although overall insider ownership is decreasing over time, it is
highest in firms that either do not undergo distributions (Group 1) or that distribute only via
9
Assuming that individuals facing holding period incentives are in the top tax bracket seems reasonable based on
the latest analysis of individual income tax returns (1997 returns) by the Statistics of Income (Internal Revenue
Service (1999a, 1999b)). These statistics show that individuals in the maximum tax bracket (tax rate of 39.6%)
accounted for 61% of all net capital gains (long-term and short-term capital gains less long-term and short-term
capital losses). The percentage increases to 75% when individuals in the penultimate bracket (tax rate of 36%) are
also considered.
21
repurchases (Group 3). Table II Panel A documents the mean and median INSIDE% by firm
payout category. Confirming insiders’ preference for capital gains, the highest mean (median)
ownership is in Group 1 and Group 3. In fact, Table II Panel B reports that there is no statistical
difference in insider ownership between these two groups. However, both Groups 1 and 3 have
significantly higher INSIDE% than either firms who pay only dividends (Group 2) or firms that
payout using both dividends and repurchases (Group 4).
H1B states that institutional shareholders prefer firms with some level of distributions,
perhaps because of prudent-man requirements. Consistent with this hypothesis, Figure 2
documents that INSTIT% is highest in firms that pay dividends (Group 2) or both dividends and
repurchases (Group 4). Corroborating that institutional shareholders prefer payout firms, firms
that make no payout (Group 1) have the lowest level of institutional ownership. Panel B of
Table II documents that Group 4, Group 2, and Group 3 all have institutional ownership at higher
levels than Group 1 and all differences are statistically significant for both means and medians.
Next, Figure 3 plots BLOCK% over time. Although we do not make any predictions on
the relation between payout policy and blockholders, we find that their pattern of preference in
payout policy more closely resembles that of insiders than institutions. Table II shows that the
highest level of BLOCK% is in Group 1. Similar to INSIDE%, BLOCK% is not significantly
different between Groups 1 and 3.
In order to control for other shareholder groups in our analysis, Table IV presents a Tobit
estimate of the relation between REPURCH% and shareholder composite. We estimate the
relation between repurchase activity, shareholder composite, and variables likely to affect the
repurchase decision.10
Results for Models 1 and 2 indicate that both INSIDE% and INSTIT% are
10
In this draft of the paper, we focus on repurchase activity using our measure REPURCH% as the dependent
variable. This measure does not distinguish between firms that do not make any payouts (Group 1 firms) and firms
22
positively associated with repurchase activity. BLOCK% also appears to have a positive affect,
albeit an insignificant one.
The results from this first set of tests indicate that firms with larger insider holdings
prefer repurchases, as do firms with larger institutional holdings. However, management’s
apparent preference for repurchases or no payouts could be driven by non-tax reasons. First,
agency issues (e.g., entrenchment) may drive management’s preference for no corporate payout
whatsoever. Second, stock options are common form of compensation during our sample period
and dividends dilute the value of stock options. In addition, the shift in repurchase behavior
could be primarily attributable to the maintenance of option plans rather than changes in
shareholder payout preferences. The next section attempts to mitigate potential confounding
non-tax explanations for our results by incorporating a tax variable.
5. The Effect of Relative Tax Rates and Ownership Mix on the Level of
Repurchases
To explicitly test the tax clienteles hypothesis, we incorporate THETA_CG as our
measure of individual shareholder preferences for capital gains relative to dividends. If findings
in Table IV are indeed attributable to taxes, then greater individual shareholder preferences for
capital gains will lead to a the positive association with REPURCH%. We incorporate
THETA_CG and its interaction with INSIDE%, INSTIT% and BLOCK% into our regression
model.
As we posit that INSIDE% represents individual holdings, we expect that the relation
between taxes and repurchases will be positive, as predicted in H2A. We also predict that this
relation will be greater than for any other shareholder class, as in H2B. Table V presents the
that utilize only dividends to make payouts (Group 2 firms) as both types of firms would have REPURCH% = 0.
Future analysis will consider alternate measures to distinguish between all of the payout groups.
23
Tobit estimates of repurchase activity including the relation between THETA_CG and INSIDE%,
INSTIT% and BLOCK%. Similar to Table IV, we find that INSIDE% and INSTIT% are
positively associated with repurchase activity. BLOCK% continues to be unrelated to
REPURCH%.
Contrary to our predictions, the interaction between INSIDE% and THETA_CG is
positive but insignificant; whereas the interaction between INSTIT% and THETA_CG is positive
and significant. The insignificant relation between REPURCH% and the INSIDE% interaction
term implies that agency issues and/or stock option compensation may drive the positive
association between INSIDE% and REPURCH%.11
We intend to explore the agency and option
issues in subsequent drafts of the paper. Interestingly, the significance of the interaction term for
INSTIT% is indicative of institutional sensitivity to individual taxes. Because a large portion of
institutional holdings are mutual funds and other flow-thru entities and would therefore pass
through payout income to individual shareholders, it is possible that institutions shift their payout
preferences towards repurchases in periods where they are relatively more tax advantaged. We
hope to explore this phenomenon in more detail by understanding the entities that comprise
INSTIT% and by focusing on INSTIT% in relation to firms that pay both dividends and
repurchases (i.e., Group 4 firms).
Finally, we included NO_SHLDRS as a measure of the dispersion of non-influential
shareholders. We had no prediction of the relation between dispersion and payout policy. Table
V documents an insignificant association between NO_SHLDRS and REPURCH%.
11
We attempt to control for stock option-related repurchase activity. However, our proxy is crude and may not be
correlated with the true measure of insider option compensation. Subsequent tests will incorporate improved
measures of executive option holdings.
24
6. Changes in Ownership Based on Payout Policy
As a first-pass examination of the effects of repurchase programs on ownership mix, we
estimate the relation between significant repurchasers and the spread between insider and
institutional holdings. A firm is considered a significant repurchaser if it repurchases 5% or
more of its outstanding shares during the course of a year. Tables II and IV documented that
INSIDE% (INSTIT%) have a preference for repurchases (dividends) relative to dividends
(repurchases). We define SPREAD as the difference between INSIDE% and INSTIT% thereby
providing a relative measure of ownership. We predict a positive coefficient on SPREAD.
Furthermore, in periods where capital gains are more tax advantaged, we expect this positive
relation to be even stronger.
Figure 4 plots SPREAD by payout policy over time. Although SPREAD has been
decreasing steadily, the rate of descent is less for firms that repurchase than for dividend-paying
firms. Table VI reports the results from a logistic estimation of the relation between significant
repurchasers, SPREAD and THETA_CG. Consistent with insiders having a greater preference
for repurchases relative to institutions, coefficient estimates on SPREAD and THETA_CG are
positive and significant.
7. Conclusions and Directions for Future Research
Overall, this study provides the most comprehensive examination of payout policy at the
shareholder level to date. We have several interesting results that demonstrate the differences
between various shareholder classes and repurchase and dividend activity. The sum of our
evidence indicates that the tax status of influential shareholders plays a significant role in
whether and how firms distribute proceeds to shareholders.
25
We have several issues to consider as we proceed with this line of research. As
mentioned above, the causality of relationships is likely an important concern that should be
addressed. Fortunately, there are several approaches that we will able to use to assess this
matter. For example, Brown, Goldman, and Nondorf (2003) use a two-stage model that better-
describes the functional form of the evolution of equity ownership than a simple linear model.
An approach that controls for the autocorrelation in dividends is the vector-autoregressive
regression model used by Grinstein and Michaely (2003). Using a system-of-equations approach
such as those in these two studies of shareholder behavior should help us to address causality
issues.
Another task that will clarify our analysis is digging into the details behind several of the
classes of shareholders, particularly institutional shareholders and blockholders. By examining
the organizational structure of investors within these groups (building on such measures as those
developed by Perez-Gonzalez (2003) and Barclay, Holderness, and Sheehan (2003)) we will be
able to fine-tune our predictions, especially regarding the expected effects of tax clienteles.
The Jobs and Growth Tax Relief Reconciliation Act of 2003 is bringing about dramatic
changes that could affect firms’ payout policy. As the individual tax rate on dividends was cut to
match that on capital gains, our THETA_CG measure effectively became zero. This would
make individual shareholders indifferent between types of payout. In fact, Blouin, Raedy, and
Shackelford (2004) show that aggregate dividends, particularly in the form of special dividends,
rose 9% upon the change in tax law. The fact that this increase is primarily attributable to
special dividends highlights the non-tax reasons that firms may avoid dividends. At any rate, the
tax law changes have deep implications for tax clienteles motives and we intent to include this
period in our analysis.
26
Finally, a natural next-step for our research will be to study the interrelation of payout
policy, stock options and firms’ ownership mix. It is interesting to consider that when firms
repurchase shares to reduce the perceived dilution of stock option exercises, there may be a shift
in ownership mix. To maintain control, insiders may not tender their shares when repurchases
are linked to stock option plans. However, in an effort to diversify their overall portfolios,
insiders may participate in share repurchase programs when they receive stock options.
Preliminary examination of our data shows that there appears to be a link between these factors.
A future research project will attempt to understand this link.
27
Appendix 1
Variable Definitions
Variable
Variable
Name Definition
Source of
Data
Predicted
Effect on
Repurchases
Ownership Data:
Insider ownership INSIDE%
Sum of shares held by officers
and directors / Shares
outstanding
CompactD
(Brown, et. al.
(2003))
+
Insititutional ownership INSTIT%
Sum of shares held by
institutions/ Shares
outstanding
CompactD
(Brown, et. al.
(2003))
?
Adjusted blockholder
ownership
BLOCK%
Sum of shares held by non-
insider, non-institutional
owners of at least 5% / Shares
outstanding
CompactD
(Brown, et. al.
(2003))
?
Diffuse non-influential
shareholders
NO_SHLDRS
Total number of shareholders
less number of insider and
institutional shareholders
Compustat ?
Measures of Payout
Activity:
Repurchase percentage REPURCH%
REPURCH / (REPURCH +
DIVS) Compustat N/A
Repurchase activity ($) REPURCH
Expenditures on the purchase
of common and preferred
stock (Item #115) minus
reduction in the value of
preferred shares outstanding
(Item #56)
Compustat N/A
Common dividends DIVS
Dividends declared on
common stock (Item #21) Compustat N/A
Prior year dividend
yield
LG_DIVYLD
Prior year DIVS / Prior year
market value of equity (Item
#24 * Item #25)
Compustat ?
Relative Tax Measure:
Tax spread THETA_CG
(also θtCG)
1 - [(1-Maximum federal tax
rate on ordinary income) / (1-
Maximum federal long-term
capital gain rates)]
See Table I +
Control Variables:
Earnings EARN
Total earnings before
extraordinary items (Item #18) Compustat +
Total assets ASSETS Book value of total assets
(Item #6) Compustat N/A
Market value of equity MVE
Market value of common
equity (Item #24 * Item #25) Compustat +
Market-to-book MKT_BOOK
(Book value of total assets
(Item #6) plus MVE minus
book value of equity (Item
#216)) / Book value of total
assets
Compustat ?
28
Variable
Variable
Name Definition
Source of
Data
Predicted
Effect on
Repurchases
Cash balance CASH
Book value of cash and short-
term assets (Item #1) Compustat +
Avg. operating income OP_INC
Three-year average of
operating income (Item #13) Compustat +
Leverage LEVERAGE
Book value of total assets
(Item #6) - book value of
equity (Item #216) / Shares
outstanding (Item #25)
Compustat ?
Signal dummy SIGNAL
Equals 1 if the firm’s stock
price decreased over the
preceding year; 0, otherwise
CRSP +
Options outstanding OPT_SHR
Difference between shares
used to calculate basis EPS
(Item #54) and shares used to
calculate diluted EPS (Item
#171) / Shares outstanding
(Item #25)
Compustat +
Return on assets ROA
Operating income (Item #13) /
Book value of total assets
(Item #6)
Compustat ?
Non-operating return on
assets
NONOP_ROA
Non-operating income (Item
#61) / Book value of total
assets (Item #6)
Compustat +
29
References
Admati, Anat, Paul Pfleiderer, and Josef Zechner, 1994, Large shareholder activism, risk sharing
and financial market equilibrium, Journal of Political Economy 102: 1097-1131.
Allen, Franklin, Antonio Bernardo and Ivo Welch, 2000, A theory of dividends based on tax
clienteles, The Journal of Finance 55: 2499-2536.
Allen, Franklin and Roni Michaely, 1995, Dividend policy, Handbooks in OR and MS, Volume
9, edited by R. Jarrow et al., Elsevier Science B.V.: 793-837.
Allen, Franklin and Roni Michaely, forthcoming, Payout policy, North-Holland Handbook of
Economics, edited by George Constantinides, Milton Harris and Rene Stulz.
Ayers, Benjamin, Bryan Cloyd, and John Robinson, 2002, The effect of shareholder-level
dividend taxes on stock prices: Evidence from the Revenue Reconciliation Act of 1993,
Accounting Review 77: 933-947.
Barclay, Michael J. and Clifford W. Smith Jr., 1988, Corporate payout policy: Cash dividends
versus open-market repurchases, Journal of Financial Economics 22: 61-82.
Barclay, Michael J., Clifford G. Holderness, and Dennis P. Sheehan, 2003, Dividends and
dominant corporate shareholders, working paper, University of Rochester, Boston
College and Pennsylvania State University.
Black, Fischer, 1976, The dividend puzzle, Journal of Portfolio Management 2: 5-8.
Blouin, Jennifer L., Jana S. Raedy, and Douglas Shackelford, 2004, Did dividends increase
immediately after the 2003 reduction in tax rates? working paper, University of North
Carolina at Chapel Hill and University of Pennsylvania.
Brav, Alon, John R. Graham, Campbell R. Harvey, and Roni Michaely, 2003, Payout policy in
the 21st
Century, working paper, Duke University, National Bureau of Economic
Research, and Cornell University.
Brennan, Michael J. and Anjan V. Thakor, 1990, Shareholder preferences and dividend policy,
Journal of Finance 45: 993-1018.
Brown, Gregory W., Eitan Goldman, and Maria E. Nondorf, 2003, The evolution of equity
ownership, working paper, The University of North Carolina at Chapel Hill and
University of California at Berkeley.
Dhaliwal, Dan S., Merle Erickson, and Robert Trezevant, 1999, A test of the theory of tax
clienteles for dividend policies, National Tax Journal 52: 179-194.
30
Dhaliwal, Dan S., Oliver Li, and Rober Trezevant, 2003, Is a dividend tax penalty incorporated
into the return on a firm’s common stock? Journal of Accounting and Economics 35:
155-178.
Easterbrook, Frank H., 1984, Two agency-cost explanations of dividends, American Economic
Review 74: 650-659.
Elton, Edward and Martin Gruber, 1970, Marginal stockholders’ tax rates and the clientele
effect, Review of Economics and Statistics 52: 68-74.
Graham, John and Alok Kumar, 2003, Do dividend clienteles exist? Evidence on dividend
preferences of retail investors, working paper, Duke University and University of Notre
Dame.
Grinstein, Yaniv and Roni Michaely, 2003, Institutional holdings and payout policy, working
paper, Cornell University.
Grullon, Gustavo and Roni Michaely, 2002, Dividends, share repurchases, and the substitution
hypothesis, Journal of Finance 57: 1649-1684.
Hirshleifer, David and Sheridan Titman, 1990, Share tendering strategies and the success of
hostile takeover bids, Journal of Political Economy 98: 295-324.
Holmstrom, Bengt, 1979, Moral hazard and observability, Bell Journal of Economics 10: 74-91.
Holmstrom, Bengt and Paul Milgrom, 1987, Aggregation and linearity in the provision of
intertemporal incentives, Econometrica 55: 303-328.
Hu, Aidong and Praveen Kumar, 2004, Managerial entrenchment and payout policy, Journal of
Financial and Quantiative Analysis (forthcoming).
Jensen, Michael C., 1986, Agency costs of free cash flow, corporate finance, and takeovers,
American Economic Review 76: 323-329.
Jensen, Michael C. and William Meckling, 1976, Theory of the firm: Managerial behavior,
agency costs, and ownership structure, Journal of Financial Economics 3: 305-360.
Lee, D. Scott, Wayne H. Mikkelson, and M. Megan Partch, 1992, Managers’ trading around
stock repurchases, Journal of Finance 47: 1947-1961.
Lie, Erik and Heidi J. Lie, 1999, The role of personal taxes in corporate decisions: An empirical
analysis of share repurchases and dividends, Journal of Financial and Quantitative
Analysis 34: 533-552.
31
Litzenberger, Robert and Krishna Ramaswamy, 1979, The effects of personal taxes and dividend
on capital asset prices: Theory and empirical evidence, Journal of Financial Economics
7: 163-195.
Litzenberger, Robert and Krishna Ramaswamy, 1980, Dividends, short selling restrictions, tax
induced investor clientele and market equilibrium, Journal of Finance 35: 469-482.
Litzenberger, Robert and Krishna Ramaswamy, 1982, The effects of dividends on common stock
prices: Tax effects or information effects? Journal of Finance 37: 429-443.
Maug, Ernst, 1998, Large shareholders as monitors: Is there a tradeoff between liquidity and
control? Journal of Finance 53: 65-98.
Miller, Merton, 1977, Debt and taxes, Journal of Finance 32: 261-276.
Miller, Merton and Myron Scholes, 1978, Dividends and taxes, Journal of Financial Economics
6: 333-364.
Miller, Merton and Myron Scholes, 1982, Dividends and taxes: Empirical evidence, Journal of
Political Economy 90: 1118-1141.
Perez-Gonzalez, Francisco, 2003, Large shareholder dividends: Evidence from U.S. tax reforms,
working paper, Columbia University.
Poterba, James and Lawrence Summers, 1985, The economic effects of dividend taxation,
Recent Advances in Corporate Finance, edited by Altman and Subramanyam,
Homewood.
Rozeff, Michael S., 1982, Growth, beta and agency costs as determinants of dividend payout
ratios, Journal of Financial Research 5: 249-259.
Shleifer, Andrei and Robert Vishny, 1986, Large shareholders and corporate control, Journal of
Political Economy 94: 461-488.
Strickland, Deon, 1996, Determinants of institutional ownership: Implications for dividend
clienteles, working paper, The University of North Carolina at Chapel Hill.
32
0
0.02
0.04
0.06
0.08
0.1
0.12
0.14
0.16
0.18
0.2
1989 1990 1991 1992 1993 1994 1995 1996 1997 1998 1999 2000 2001 2002
Year
INSIDE%
DIVS = 0, REPURCH = 0 DIVS > 0, REPURCH = 0
DIVS = 0, REPURCH > 0 DIVS > 0, REPURCH > 0
Figure 1. Distribution of insider ownership of firms by payout method.
This figure depicts the distribution of insider ownership percentage (INSIDE%) for a sample of U.S. firms. We
determine the payout policy of a firm by observing the cash disbursements of the firm over a period of a year. The
sample includes all firms included in Compustat and the dataset described in Brown et al (2003) over the period
1989 and 2002. REPURCH is the expenditure on the purchase of common and preferred stocks (Compustat item
#115) minus any reduction in the value (redemption value) of the net number of preferred shared outstanding
(Compustat item #56). DIVS is the total dollar amount of dividends declared on the common stock (Compustat item
#21). INSIDE% is the number of shares owned by inside management over shares outstanding.
33
0
0.1
0.2
0.3
0.4
0.5
0.6
1989 1990 1991 1992 1993 1994 1995 1996 1997 1998 1999 2000 2001 2002
Year
INSTIT%
DIVS = 0, REPURCH = 0 DIVS > 0, REPURCH = 0 DIVS = 0, REPURCH > 0 DIVS > 0, REPURCH > 0
Figure 2. Distribution of institutional ownership of firms by payout method.
This figure depicts the distribution of institutional ownership percentage (INSTIT%) for a sample of U.S. firms. We
determine the payout policy of a firm by observing the cash disbursements of the firm over a period of a year. The
sample includes all firms included in Compustat and the dataset described in Brown et al (2003) over the period
1989 and 2002. REPURCH is the expenditure on the purchase of common and preferred stocks (Compustat item
#115) minus any reduction in the value (redemption value) of the net number of preferred shared outstanding
(Compustat item #56). DIVS is the total dollar amount of dividends declared on the common stock (Compustat item
#21). INSTIT% is the number of shares owned by institutions over shares outstanding.
34
0
0.05
0.1
0.15
0.2
0.25
0.3
0.35
0.4
0.45
1989 1990 1991 1992 1993 1994 1995 1996 1997 1998 1999 2000 2001 2002
Year
BLOCK%
DIVS = 0, REPURCH = 0 DIVS > 0, REPURCH = 0 DIVS = 0, REPURCH > 0 DIVS > 0, REPURCH > 0
Figure 3. Distribution of blockholder ownership of firms by payout method.
This figure depicts the distribution of blockholder ownership percentage (BLOCK%) for a sample of U.S. firms.
We determine the payout policy of a firm by observing the cash disbursements of the firm over a period of a year.
The sample includes all firms included in Compustat and the dataset described in Brown et al (2003) over the period
1989 and 2002. REPURCH is the expenditure on the purchase of common and preferred stocks (Compustat item
#115) minus any reduction in the value (redemption value) of the net number of preferred shared outstanding
(Compustat item #56). DIVS is the total dollar amount of dividends declared on the common stock (Compustat item
#21). BLOCK% is shares held by non-institution and non-inside management blockholders scaled by shares
outstanding.
35
-0.6
-0.5
-0.4
-0.3
-0.2
-0.1
0
0.1
1989 1990 1991 1992 1993 1994 1995 1996 1997 1998 1999 2000 2001 2002
Year
Spread
DIVS = 0, REPURCH = 0 DIVS > 0, REPURCH = 0
DIVS = 0, REPURCH > 0 DIVS > 0, REPURCH > 0
Figure 4. Distribution of spread between insider and institutional ownership of firms by
payout method.
This figure depicts the distribution of the spread between insider (INSIDE%) and institutional ownership
(INSTIT%) for a sample of U.S. firms. We determine the payout policy of a firm by observing the cash
disbursements of the firm over a period of a year. The sample includes all firms included in Compustat and the
dataset described in Brown et al (2003) over the period 1989 and 2002. REPURCH is the expenditure on the
purchase of common and preferred stocks (Compustat item #115) minus any reduction in the value (redemption
value) of the net number of preferred shared outstanding (Compustat item #56). DIVS is the total dollar amount of
dividends declared on the common stock (Compustat item #21). INSIDE% is the number of shares owned by inside
management over shares outstanding. INSTIT% is the number of shares owned by institutions over shares
outstanding.
36
Table I
THETA_CG from 1988-2002
Date
Statutory tax
rate for
dividends
(i.e., ordinary
income)
(A)
Statutory tax
rate for
long-term capital
gains
(B)
Theta
(1-(A))/(1-(B))
THETA_CG
1 - [(1-(A))/(1-(B))]
1/1/88—1/1/89 28 28 1.000 0
1/2/89—12/31/90 28 28 1.000 0
1991—1992 31 28 0.958 0.042
1/1/93—5/6/97 39.6 28 0.838 0.162a
5/7/97—12/31/97 39.6 20 0.755 0.245a
1998-2000 39.6 20 0.755 0.245
2001 39.1 20 0.761 0.239
2002 38.6 20 0.768 0.232
a
The 1997 THETA_CG is averaged assuming 4 months of 0.162 and 8 month of 0.245.
37
Table II
Firm Characteristics by Payout Policy
This table reports descriptive statistics by payout policy for a sample of U.S. firms. We determine the payout policy of a firm by observing the cash disbursements from 1989 to
2002. The sample is the intersection of the Compustat and Brown et al (2003) datasets. The data sample contains 45,520 firm-year observations and excludes banks, utilities and
insurance companies. REPURCH is the expenditure on the purchase of common and preferred stocks (Compustat item #115) minus any reduction in the value (redemption value)
of the net number of preferred shared outstanding (Compustat item #56). DIVS is the total dollar amount of dividends declared on the common stock (Compustat item #21). MVE
is the market value of common stock (Compustat data #24 times Compustat item #25). ASSETS is the book value of assets (Compustat item #6). OP_INC is operating income per
share (Compustat item #13/Compustat item #25). OPT_SHR is our proxy for exercisable stock option shares estimated as the number of shares used in computing diluted EPS
(Compustat item #171) less shares used in computing basic EPS (Compustat item #54) divided by shares outstanding (Compustat item #25). LEVERAGE is debt per share which
is the book value of assets minus the book value of equity ((Compustat item #6 – Compustat item #216)/Compustat item #25). LG_DIVYLD is the prior year’s dividend yield
(Compustat item #21t-1/(Compustat item #24 t-1 times Compustat item #25 t-1)). MKT_BOOK is the market-to-book ratio ((book value of assets + market value of equity – book
value of equity)/book value of assets). SIGNAL is a dummy variable that equals 1 if the firm’s buy and hold return of the prior return was negative; 0 otherwise. INSIDE% is the
number of shares owned by inside management over shares outstanding. INSTIT% is the number of shares owned by institutions over shares outstanding. BLOCK% is shares
held by non-institution and non-inside management blockholders scaled by shares outstanding. NO_SHLDRS is a measure of the diffusion of the non-influential owners, which is
defined as the total number of shareholders less the number of institutions, insiders and blockholders. REPURCH% is the ratio of repurchases (REPURCH) over total payout
(REPURCH +DIVS). The significance levels of the means (medians) are based on a two-tailed t-test (two-tailed Wilcoxon rank test).
Panel A: Descriptive Statistics
GROUP 1 GROUP 2 GROUP 3 GROUP 4
DIVS = 0, REPURCH = 0 DIVS > 0, REPURCH = 0 DIVS = 0, REPURCH > 0 DIVS > 0, REPURCH > 0
N = 25,708 N = 5,799 N = 8,159 N = 6,099
Mean Median Mean Median Mean Median Mean Median
MVE 418.63 44.64 2,273.28 309.86 881.15 79.26 5400.53 570.99
ASSETS 320.18 53.93 3,026.11 383.25 600.30 103.82 6,089.91 604.39
MKT_BOOK 3.51 1.45 1.63 1.31 1.85 1.26 1.75 1.42
CASH 19.56% 9.22% 9.78% 4.24% 19.62% 11.05% 9.69% 4.80%
ROA -4.04% 6.60% 13.92% 13.63% 6.15% 10.84% 16.10% 15.55%
NONOP_ROA 0.69% 0.62% 0.87% 0.50% 1.24% 0.75% 0.92% 0.53%
DIVS 0.00 0.00 43.32 4.58 0.00 0.00 97.61 8.59
REPURCH 0.00 0.00 0.00 0.00 20.61 1.09 108.86 7.25
REPURCH% 0.00 0.00 0.00 0.00 100% 100% 45.51% 46.13%
INSIDE% 12.96% 6.88% 9.86% 3.76% 12.73% 6.96% 8.70% 3.16%
INSTIT% 22.76% 15.45% 39.85% 39.30% 31.81% 25.78% 44.41% 45.54%
BLOCK% 32.68% 21.68% 23.70% 13.33% 30.41% 21.41% 22.78% 13.03%
NO_SHLDRS 5,077 780 16,971 1,929 5,196 992 31,131 3,179
38
Panel B: Univariate Analysis - Test of Differences
Comparison is column to row. Above diagonal, test of means; below diagonal, test of medians. All comparisons are significant at the 0.001 level except the
bolded statistics.
GROUP 1 GROUP 2 GROUP 3 GROUP 4
INSIDE% INSTIT% BLOCK% INSIDE% INSTIT% BLOCK% INSIDE% INSTIT% BLOCK% INSIDE% INSTIT% BLOCK%
GROUP 1 – INSIDE% - - - 14.72 - - 1.12 - - 19.55 - -
GROUP 1 – INSTIT% - - - - -51.72 - - -30.51 - - -67.63 -
GROUP 1 – BLOCK% - - - - - 9.74 - - 2.71 - - 10.85
GROUP 2 – INSIDE% -19.41 - - - - - -12.11 - - 3.82 - -
GROUP 2 – INSTIT% - 50.59 - - - - - 18.81 - - -10.89 -
GROUP 2 – BLOCK% - - -17.23 - - - - - -7.79 - - 1.34
GROUP 3 – INSIDE% 0.1631 - - -16.84 - - - - - 16.54 - -
GROUP 3 – INSTIT% - 29.44 - - 20.71 - - - - - -30.69 -
GROUP 3 – BLOCK% - - 0.0349 - - -15.68 - - - - - 8.63
GROUP 4 – INSIDE% -24.06 - - 2.91 - - -20.76 - - - - -
GROUP 4 – INSTIT% - 64.00 - - -10.82 - - 31.89 - - - -
GROUP 4 – BLOCK% - - -18.59 - - 0.2112 - - -16.93 - - -
39
Table III
Summary Statistics for Sample Control Variables
This table displays descriptive statistics for the various repurchase control variables. THETA_CG is the proxy for
individual capital gains preference. See Table I for computation. OP_INC is operating income per share (Compustat
item #13/Compustat item #25). OPT_SHR is our proxy for exercisable stock option shares estimated shares used in
computing diluted EPS (Compustat item #171) less shares used in computing basic EPS (Compustat item #54)
divided by shares outstanding (Compustat item #25). EPS is the earnings before extraordinary per share (Compustat
#18/Compustat item #25). LEVERAGE is debt per share which is the book value of assets minus the book value of
equity ((Compustat item #6 – Compustat item #216)/Compustat item #25). LG_DIVYLD is the prior year’s
dividend yield (Compustat item #21t-1/(Compustat item #24 t-1 times Compustat item #25 t-1)). MKT_BOOK is the
market-to-book ratio ((book value of assets + market value of equity – book value of equity)/book value of assets).
SIGNAL is a dummy variable that equals 1 if the firm’s buy and hold return of the prior return was negative; 0
otherwise. The number of observations is 45,520.
Mean Median Std. Dev
THETA_CG 0.17496 0.16111 0.070841
EPS 35.069 1.454 511.153
LEVERAGE 1 068.2 43.505 12 216.45
LG_DIVYLD 0.1716 0 32.61
OPT_SHR 0.025178 0 0.68931
OP_INC 169.262 9.184 1 160.78
MKT_BOOK 2.74199 1.38622 65.4275
SIGNAL 0.56165 1 0.49619
40
Table IV
The Effect of Ownership Composite on Repurchase Activity: Tobit Estimates
This table provides estimates of the relation between repurchases, shareholder composite and variables likely to
affect the repurchase decision. REPURCH% is the ratio of repurchases (REPURCH) over total payout (REPURCH
+ DIVS). REPURCH is the expenditure on the purchase of common and preferred stocks (Compustat item #115)
minus any reduction in the value (redemption value) of the net number of preferred shared outstanding (Compustat
item #56). DIVS is the total dollar amount of dividends declared on the common stock (Compustat item #21).
INSIDE% is the number of shares owned by inside management over shares outstanding. INSTIT% is the number
of shares owned by institutions over shares outstanding. BLOCK% is shares held by non-institution and non-inside
management blockholders scaled by shares outstanding. NO_SHLDRS is a measure of the diffusion of the non-
influential owners, which is defined as the total number of shareholders less the number of institutions, insiders and
blockholders. MVE is price (Compustat item #24). OP_INC is operating income per share (Compustat item
#13/Compustat item #25). OPT_SHR is our proxy for exercisable stock option shares estimated shares used in
computing diluted EPS (Compustat item #171) less shares used in computing basic EPS (Compustat item #54)
divided by shares outstanding (Compustat item #25). EPS is the earnings before extraordinary per share (Compustat
#18/Compustat item #25). LEVERAGE is debt per share which is the book value of assets minus the book value of
equity ((Compustat item #6 – Compustat item #216)/Compustat item #25). LG_DIVYLD is the prior year’s
dividend yield (Compustat item #21t-1/(Compustat item #24 t-1 times Compustat item #25 t-1)). MKT_BOOK is the
market-to-book ratio ((book value of assets + market value of equity – book value of equity)/book value of assets).
SIGNAL is a dummy variable that equals 1 if the firm’s buy and hold return of the prior return was negative; 0
otherwise. Industry dummy variables are included. The actual equation estimated is a two-tailed Tobit truncated at
both zero and one. Standard errors are given in parentheses below the estimated coefficients.
Model 1 Model 2
Intercept -2.0165*** -1.8729***
(0.067) (0.074)
INSIDE% 0.4894*** 0.5227***
(0.093) (0.098)
INSTIT% 2.0132*** 1.7234***
(0.061) (0.066)
BLOCK% 0.0224 0.0191
(0.023) (0.024)
EPS 0.0000
(0.000)
MVE 0.0070***
(0.001)
LEVERAGE 0.0000
(0.000)
LG_DIVYLD -0.2136
(0.186)
OPT_SHR -0.0087
(0.028)
MKT_BOOK -0.1356***
(0.008)
OP_INC 0.0000***
(0.008)
SIGNAL -0.0507*
(0.029)
Log-likelihood -37399.62 -35773.14
*,**,*** significant at the 0.10, 0.05 or 0.01 levels, respectively.
41
Table V
The Effect of Ownership Composite and Taxes on Repurchase Activity: Tobit Estimates
This table provides estimates of the relation between repurchases, shareholder composite and variables likely to affect the repurchase decision. REPURCH% is
the ratio of repurchases (REPURCH) over total payout (REPURCH + DIVS). REPURCH is the expenditure on the purchase of common and preferred stocks
(Compustat item #115) minus any reduction in the value (redemption value) of the net number of preferred shared outstanding (Compustat item #56). DIVS is
the total dollar amount of dividends declared on the common stock (Compustat item #21). INSIDE% is the number of shares owned by inside management over
shares outstanding. INSTIT% is the number of shares owned by institutions over shares outstanding. BLOCK% is shares held by non-institution and non-inside
management blockholders scaled by shares outstanding. NO_SHLDRS is a measure of the diffusion of the non-influential owners, which is defined as the total
number of shareholders less the number of institutions, insiders and blockholders. OP_INC is operating income per share (Compustat item #13/Compustat item
#25). OPT_SHR is our proxy for exercisable stock option shares estimated shares used in computing diluted EPS (Compustat item #171) less shares used in
computing basic EPS (Compustat item #54) divided by shares outstanding (Compustat item #25). EPS is the earnings before extraordinary per share (Compustat
#18/Compustat item #25). LEVERAGE is debt per share which is the book value of assets minus the book value of equity ((Compustat item #6 – Compustat
item #216)/Compustat item #25). LG_DIVYLD is the prior year’s dividend yield (Compustat item #21t-1/(Compustat item #24 t-1 times Compustat item #25 t-1)).
MKT_BOOK is the market-to-book ratio ((book value of assets + market value of equity – book value of equity)/book value of assets). SIGNAL is a dummy
variable that equals 1 if the firm’s buy and hold return of the prior return was negative; 0 otherwise. Industry dummy variables are included. The actual equation
estimated is a two-tailed Tobit truncated at both zero and one. Standard errors are given in parentheses below the estimated coefficients. *,**,*** significant at
the 0.10, 0.05 or 0.01 levels, respectively.
42
Model 1 Model 2
Intercept -2.3170*** -2.1331***
(0.096) (0.102)
THETA_CG 2.0879*** 2.8544***
(0.402) (0.436)
INSIDE% 0.5209** 0.5544**
(0.231) (0.250)
INSIDE%*THETA_CG 0.3082 0.5449
(1.277) (1.356)
INSTIT% 1.3534*** 0.8362***
(0.170) (0.184)
INSTIT%*THETA_CG 2.9384*** 3.8004***
(0.845) (0.896)
BLOCK% 0.0530 0.0550
(0.048) (0.050)
BLOCK%*THETA_CG -0.2915 -0.3736
(0.301) (0.317)
NO_SHLDRS 0.0000 0.0000
(0.000) (0.000)
EPS 0.0000
(0.000)
MVE 0.0080***
(0.001)
LEVERAGE 0.0000***
(0.000)
LG_DIVYLD -0.1158
(0.145)
OPT_SHR -0.0123
(0.030)
MKT_BOOK -0.1438***
(0.008)
OP_INC 0.0000***
(0.000)
SIGNAL -0.0912***
(0.029)
43
Table VI
Logistic Regression of Significant Repurchasers
This table provides estimates of the relation between significant repurchasers and the spread between
insider and institutional holdings. The dependent variable if 1 if a firms is a significant repurchaser; 0
otherwise. A firm is considered a significant repurchaser if it repurchases 5% or more of its outstanding
shares. SPREAD is INSIDE% minus INSTIT%. THETA_CG is the proxy for individual capital gains
preference. INSIDE% is the number of shares owned by inside management over shares outstanding.
INSTIT% is the number of shares owned by institutions over shares outstanding. OP_INC is operating
income per share (Compustat item #13/Compustat item #25). OPT_SHR is our proxy for exercisable stock
option shares estimated shares used in computing diluted EPS (Compustat item #171) less shares used in
computing basic EPS (Compustat item #54) divided by shares outstanding (Compustat item #25). EPS is
the earnings before extraordinary per share (Compustat #18/Compustat item #25). LEVERAGE is debt per
share which is the book value of assets minus the book value of equity ((Compustat item #6 – Compustat
item #216)/Compustat item #25). LG_DIVYLD is the prior year’s dividend yield (Compustat item #21t-
1/(Compustat item #24 t-1 times Compustat item #25 t-1)). MKT_BOOK is the market-to-book ratio ((book
value of assets + market value of equity – book value of equity)/book value of assets). SIGNAL is a
dummy variable that equals 1 if the firm’s buy and hold return of the prior return was negative; 0
otherwise. Industry dummy variables are included. Standard errors are given in parentheses below the
estimated coefficients. *,**,*** significant at the 0.10, 0.05 or 0.01 levels, respectively.
Intercept 0.3655*** 0.1863***
0.0462 0.0488
THETA_CG 1.3418*** 1.1394***
0.1504 0.1675
SPREAD 0.5326*** 0.2644***
0.0826 0.0848
SPREAD*THETA_CG 0.9126** 1.2096***
0.4297 0.4335
EPS -0.00003
0.000026
MVE -0.00758***
0.000653
LEVERAGE -6.41E-07
1.10E-06
LG_DIVYLD -0.0246
0.0207
OPT_SHR 0.00217
0.0141
MKT_BOOK 0.1158***
0.00557
OP_INC 0.000028
0.000029
SIGNAL 0.1992***
0.0201
Psuedo R2

Weitere ähnliche Inhalte

Was ist angesagt?

The changing of the boards
The changing of the boardsThe changing of the boards
The changing of the boardsBABACAR SECK
 
Edepotlink t4bde92b3 001
Edepotlink t4bde92b3 001Edepotlink t4bde92b3 001
Edepotlink t4bde92b3 001qmransari1
 
Firm Resources and Sustained Competitive Advantage by Jay Barney
Firm Resources and Sustained Competitive Advantage by Jay BarneyFirm Resources and Sustained Competitive Advantage by Jay Barney
Firm Resources and Sustained Competitive Advantage by Jay Barneychitwarnold
 
Literature analysis of sudia arabia companies - assignment - www.topgradepa...
Literature   analysis of sudia arabia companies - assignment - www.topgradepa...Literature   analysis of sudia arabia companies - assignment - www.topgradepa...
Literature analysis of sudia arabia companies - assignment - www.topgradepa...Top Grade Papers
 
CEO Salary - Group 10 Report - Final
CEO Salary - Group 10 Report - FinalCEO Salary - Group 10 Report - Final
CEO Salary - Group 10 Report - FinalStephanie Simopoulos
 
Real Estate Mergers Review
Real Estate Mergers ReviewReal Estate Mergers Review
Real Estate Mergers ReviewOscar Gonzales
 
CPCU Insights - Price Optimization, Sept 2015(2)
CPCU Insights - Price Optimization, Sept 2015(2)CPCU Insights - Price Optimization, Sept 2015(2)
CPCU Insights - Price Optimization, Sept 2015(2)Arthur Schwartz
 

Was ist angesagt? (11)

The changing of the boards
The changing of the boardsThe changing of the boards
The changing of the boards
 
Edepotlink t4bde92b3 001
Edepotlink t4bde92b3 001Edepotlink t4bde92b3 001
Edepotlink t4bde92b3 001
 
Firm Resources and Sustained Competitive Advantage by Jay Barney
Firm Resources and Sustained Competitive Advantage by Jay BarneyFirm Resources and Sustained Competitive Advantage by Jay Barney
Firm Resources and Sustained Competitive Advantage by Jay Barney
 
Literature analysis of sudia arabia companies - assignment - www.topgradepa...
Literature   analysis of sudia arabia companies - assignment - www.topgradepa...Literature   analysis of sudia arabia companies - assignment - www.topgradepa...
Literature analysis of sudia arabia companies - assignment - www.topgradepa...
 
CEO Salary - Group 10 Report - Final
CEO Salary - Group 10 Report - FinalCEO Salary - Group 10 Report - Final
CEO Salary - Group 10 Report - Final
 
Real Estate Mergers Review
Real Estate Mergers ReviewReal Estate Mergers Review
Real Estate Mergers Review
 
agency theory
 agency theory agency theory
agency theory
 
AApa formatted paper
AApa formatted paperAApa formatted paper
AApa formatted paper
 
CPCU Insights - Price Optimization, Sept 2015(2)
CPCU Insights - Price Optimization, Sept 2015(2)CPCU Insights - Price Optimization, Sept 2015(2)
CPCU Insights - Price Optimization, Sept 2015(2)
 
Agency theory ob
Agency theory obAgency theory ob
Agency theory ob
 
Ch23
Ch23Ch23
Ch23
 

Ähnlich wie Payout Policy: A Shareholder-Level Analysis

Ownership structure and dividend policy.doc=2
Ownership structure and dividend policy.doc=2Ownership structure and dividend policy.doc=2
Ownership structure and dividend policy.doc=2Liza Khanam
 
Impact of Dividend policy on Shareholders Wealth
Impact of Dividend policy on Shareholders WealthImpact of Dividend policy on Shareholders Wealth
Impact of Dividend policy on Shareholders WealthAasim Mushtaq
 
This article is about analysis of if corporate change their divide.docx
This article is about analysis of if corporate change their divide.docxThis article is about analysis of if corporate change their divide.docx
This article is about analysis of if corporate change their divide.docxchristalgrieg
 
A Synopsis On -Corporate Governance And Performance Around The World What We...
A Synopsis On -Corporate Governance And Performance Around The World  What We...A Synopsis On -Corporate Governance And Performance Around The World  What We...
A Synopsis On -Corporate Governance And Performance Around The World What We...Allison Koehn
 
The causes and risk-taking on the change of CEO equity-based compensation
The causes and risk-taking on the change of CEO equity-based compensationThe causes and risk-taking on the change of CEO equity-based compensation
The causes and risk-taking on the change of CEO equity-based compensationMax Lai
 
Ownership and fund performance evans
Ownership and fund performance evansOwnership and fund performance evans
Ownership and fund performance evansbfmresearch
 
Selection termination goyalwahal
Selection termination goyalwahalSelection termination goyalwahal
Selection termination goyalwahalbfmresearch
 
邬梦曲论文
邬梦曲论文邬梦曲论文
邬梦曲论文Meng Qu Wu
 
Determinants of dividend payout policy of listed financial institutions in ghana
Determinants of dividend payout policy of listed financial institutions in ghanaDeterminants of dividend payout policy of listed financial institutions in ghana
Determinants of dividend payout policy of listed financial institutions in ghanaAlexander Decker
 
Agency theory
Agency theoryAgency theory
Agency theorysagarphul
 
Agencytheory 130715011814-phpapp02
Agencytheory 130715011814-phpapp02Agencytheory 130715011814-phpapp02
Agencytheory 130715011814-phpapp02Umer Saeed
 
Sp57
Sp57Sp57
Sp57LW B
 
Makan atau dimakan (merger or control corporate)
Makan atau dimakan (merger or control corporate)Makan atau dimakan (merger or control corporate)
Makan atau dimakan (merger or control corporate)Lucianus Kelen
 
· Choose and Respond to 3 posts listed below. Advance the conversa.docx
· Choose and Respond to 3 posts listed below. Advance the conversa.docx· Choose and Respond to 3 posts listed below. Advance the conversa.docx
· Choose and Respond to 3 posts listed below. Advance the conversa.docxLynellBull52
 

Ähnlich wie Payout Policy: A Shareholder-Level Analysis (20)

Ownership structure and dividend policy.doc=2
Ownership structure and dividend policy.doc=2Ownership structure and dividend policy.doc=2
Ownership structure and dividend policy.doc=2
 
Impact of Dividend policy on Shareholders Wealth
Impact of Dividend policy on Shareholders WealthImpact of Dividend policy on Shareholders Wealth
Impact of Dividend policy on Shareholders Wealth
 
This article is about analysis of if corporate change their divide.docx
This article is about analysis of if corporate change their divide.docxThis article is about analysis of if corporate change their divide.docx
This article is about analysis of if corporate change their divide.docx
 
QG_SayOnPay
QG_SayOnPayQG_SayOnPay
QG_SayOnPay
 
Say on Pay - Research Spotlight
Say on Pay - Research SpotlightSay on Pay - Research Spotlight
Say on Pay - Research Spotlight
 
A Synopsis On -Corporate Governance And Performance Around The World What We...
A Synopsis On -Corporate Governance And Performance Around The World  What We...A Synopsis On -Corporate Governance And Performance Around The World  What We...
A Synopsis On -Corporate Governance And Performance Around The World What We...
 
Does the Composition of a Company’s Shareholder Base Really Matter?
Does the Composition of a Company’s Shareholder Base Really Matter?Does the Composition of a Company’s Shareholder Base Really Matter?
Does the Composition of a Company’s Shareholder Base Really Matter?
 
The causes and risk-taking on the change of CEO equity-based compensation
The causes and risk-taking on the change of CEO equity-based compensationThe causes and risk-taking on the change of CEO equity-based compensation
The causes and risk-taking on the change of CEO equity-based compensation
 
B02110106018
B02110106018B02110106018
B02110106018
 
Ownership and fund performance evans
Ownership and fund performance evansOwnership and fund performance evans
Ownership and fund performance evans
 
Determinants of Dividend Payout Policy of Listed Corporations in Nigeria
Determinants of Dividend Payout Policy of Listed Corporations in NigeriaDeterminants of Dividend Payout Policy of Listed Corporations in Nigeria
Determinants of Dividend Payout Policy of Listed Corporations in Nigeria
 
Selection termination goyalwahal
Selection termination goyalwahalSelection termination goyalwahal
Selection termination goyalwahal
 
邬梦曲论文
邬梦曲论文邬梦曲论文
邬梦曲论文
 
Ten Myths of "Say on Pay"
Ten Myths of "Say on Pay"Ten Myths of "Say on Pay"
Ten Myths of "Say on Pay"
 
Determinants of dividend payout policy of listed financial institutions in ghana
Determinants of dividend payout policy of listed financial institutions in ghanaDeterminants of dividend payout policy of listed financial institutions in ghana
Determinants of dividend payout policy of listed financial institutions in ghana
 
Agency theory
Agency theoryAgency theory
Agency theory
 
Agencytheory 130715011814-phpapp02
Agencytheory 130715011814-phpapp02Agencytheory 130715011814-phpapp02
Agencytheory 130715011814-phpapp02
 
Sp57
Sp57Sp57
Sp57
 
Makan atau dimakan (merger or control corporate)
Makan atau dimakan (merger or control corporate)Makan atau dimakan (merger or control corporate)
Makan atau dimakan (merger or control corporate)
 
· Choose and Respond to 3 posts listed below. Advance the conversa.docx
· Choose and Respond to 3 posts listed below. Advance the conversa.docx· Choose and Respond to 3 posts listed below. Advance the conversa.docx
· Choose and Respond to 3 posts listed below. Advance the conversa.docx
 

Mehr von Baker Khader Abdallah, PMP

Mehr von Baker Khader Abdallah, PMP (20)

Oracle Carry Forward Methods
Oracle Carry Forward MethodsOracle Carry Forward Methods
Oracle Carry Forward Methods
 
TE040 Oracle AP Testscript
TE040 Oracle AP TestscriptTE040 Oracle AP Testscript
TE040 Oracle AP Testscript
 
Oracle Payables Reference Guide
Oracle Payables Reference GuideOracle Payables Reference Guide
Oracle Payables Reference Guide
 
Entering Invoices in Oracle Payables
Entering Invoices in Oracle PayablesEntering Invoices in Oracle Payables
Entering Invoices in Oracle Payables
 
BR100 Oracle AP Setup
BR100 Oracle AP SetupBR100 Oracle AP Setup
BR100 Oracle AP Setup
 
Quick Reference Guide
Quick Reference GuideQuick Reference Guide
Quick Reference Guide
 
PCS iProcurement
PCS iProcurement PCS iProcurement
PCS iProcurement
 
Oracle iProcurement
Oracle iProcurementOracle iProcurement
Oracle iProcurement
 
Oracle R12 iProcurement Reference Guide
Oracle R12 iProcurement Reference GuideOracle R12 iProcurement Reference Guide
Oracle R12 iProcurement Reference Guide
 
Leveraging iProcurement to Increase Cash Flow
Leveraging iProcurement to Increase Cash FlowLeveraging iProcurement to Increase Cash Flow
Leveraging iProcurement to Increase Cash Flow
 
iProcurement Reference Guide
iProcurement Reference GuideiProcurement Reference Guide
iProcurement Reference Guide
 
Oracle Internet Procurement
Oracle Internet ProcurementOracle Internet Procurement
Oracle Internet Procurement
 
FIS Oracle iProcurement
FIS Oracle iProcurementFIS Oracle iProcurement
FIS Oracle iProcurement
 
CDU iProcurement R12 Manual
CDU iProcurement R12 ManualCDU iProcurement R12 Manual
CDU iProcurement R12 Manual
 
Understanding Physical Inventory
Understanding Physical InventoryUnderstanding Physical Inventory
Understanding Physical Inventory
 
Stock Maintenance
Stock MaintenanceStock Maintenance
Stock Maintenance
 
Oracle Inventory Kanban
Oracle Inventory KanbanOracle Inventory Kanban
Oracle Inventory Kanban
 
Inventory Transaction Types
Inventory Transaction TypesInventory Transaction Types
Inventory Transaction Types
 
Forecasting in Oracle Inventory
Forecasting in Oracle InventoryForecasting in Oracle Inventory
Forecasting in Oracle Inventory
 
Accounting in Oracle Inventory
Accounting in Oracle InventoryAccounting in Oracle Inventory
Accounting in Oracle Inventory
 

Kürzlich hochgeladen

Famous No1 Amil Baba Love marriage Astrologer Specialist Expert In Pakistan a...
Famous No1 Amil Baba Love marriage Astrologer Specialist Expert In Pakistan a...Famous No1 Amil Baba Love marriage Astrologer Specialist Expert In Pakistan a...
Famous No1 Amil Baba Love marriage Astrologer Specialist Expert In Pakistan a...janibaber266
 
Lion One Corporate Presentation May 2024
Lion One Corporate Presentation May 2024Lion One Corporate Presentation May 2024
Lion One Corporate Presentation May 2024Adnet Communications
 
Dubai Call Girls Deira O525547819 Dubai Call Girls Bur Dubai Multiple
Dubai Call Girls Deira O525547819 Dubai Call Girls Bur Dubai MultipleDubai Call Girls Deira O525547819 Dubai Call Girls Bur Dubai Multiple
Dubai Call Girls Deira O525547819 Dubai Call Girls Bur Dubai Multiplekojalpk89
 
Bhubaneswar🌹Ravi Tailkes ❤CALL GIRLS 9777949614 💟 CALL GIRLS IN bhubaneswar ...
Bhubaneswar🌹Ravi Tailkes  ❤CALL GIRLS 9777949614 💟 CALL GIRLS IN bhubaneswar ...Bhubaneswar🌹Ravi Tailkes  ❤CALL GIRLS 9777949614 💟 CALL GIRLS IN bhubaneswar ...
Bhubaneswar🌹Ravi Tailkes ❤CALL GIRLS 9777949614 💟 CALL GIRLS IN bhubaneswar ...Call Girls Mumbai
 
Famous Kala Jadu, Black magic expert in Faisalabad and Kala ilam specialist i...
Famous Kala Jadu, Black magic expert in Faisalabad and Kala ilam specialist i...Famous Kala Jadu, Black magic expert in Faisalabad and Kala ilam specialist i...
Famous Kala Jadu, Black magic expert in Faisalabad and Kala ilam specialist i...batoole333
 
Significant AI Trends for the Financial Industry in 2024 and How to Utilize Them
Significant AI Trends for the Financial Industry in 2024 and How to Utilize ThemSignificant AI Trends for the Financial Industry in 2024 and How to Utilize Them
Significant AI Trends for the Financial Industry in 2024 and How to Utilize Them360factors
 
Certified Kala Jadu, Black magic specialist in Rawalpindi and Bangali Amil ba...
Certified Kala Jadu, Black magic specialist in Rawalpindi and Bangali Amil ba...Certified Kala Jadu, Black magic specialist in Rawalpindi and Bangali Amil ba...
Certified Kala Jadu, Black magic specialist in Rawalpindi and Bangali Amil ba...batoole333
 
Solution Manual For Financial Statement Analysis, 13th Edition By Charles H. ...
Solution Manual For Financial Statement Analysis, 13th Edition By Charles H. ...Solution Manual For Financial Statement Analysis, 13th Edition By Charles H. ...
Solution Manual For Financial Statement Analysis, 13th Edition By Charles H. ...rightmanforbloodline
 
✂️ 👅 Independent Bhubaneswar Escorts Odisha Call Girls With Room Bhubaneswar ...
✂️ 👅 Independent Bhubaneswar Escorts Odisha Call Girls With Room Bhubaneswar ...✂️ 👅 Independent Bhubaneswar Escorts Odisha Call Girls With Room Bhubaneswar ...
✂️ 👅 Independent Bhubaneswar Escorts Odisha Call Girls With Room Bhubaneswar ...Call Girls Mumbai
 
Strategic Resources May 2024 Corporate Presentation
Strategic Resources May 2024 Corporate PresentationStrategic Resources May 2024 Corporate Presentation
Strategic Resources May 2024 Corporate PresentationAdnet Communications
 
2999,Vashi Fantastic Ellete Call Girls📞📞9833754194 CBD Belapur Genuine Call G...
2999,Vashi Fantastic Ellete Call Girls📞📞9833754194 CBD Belapur Genuine Call G...2999,Vashi Fantastic Ellete Call Girls📞📞9833754194 CBD Belapur Genuine Call G...
2999,Vashi Fantastic Ellete Call Girls📞📞9833754194 CBD Belapur Genuine Call G...priyasharma62062
 
falcon-invoice-discounting-unlocking-prime-investment-opportunities
falcon-invoice-discounting-unlocking-prime-investment-opportunitiesfalcon-invoice-discounting-unlocking-prime-investment-opportunities
falcon-invoice-discounting-unlocking-prime-investment-opportunitiesFalcon Invoice Discounting
 
Kopar Khairane Cheapest Call Girls✔✔✔9833754194 Nerul Premium Call Girls-Navi...
Kopar Khairane Cheapest Call Girls✔✔✔9833754194 Nerul Premium Call Girls-Navi...Kopar Khairane Cheapest Call Girls✔✔✔9833754194 Nerul Premium Call Girls-Navi...
Kopar Khairane Cheapest Call Girls✔✔✔9833754194 Nerul Premium Call Girls-Navi...priyasharma62062
 
GIFT City Overview India's Gateway to Global Finance
GIFT City Overview  India's Gateway to Global FinanceGIFT City Overview  India's Gateway to Global Finance
GIFT City Overview India's Gateway to Global FinanceGaurav Kanudawala
 
Pension dashboards forum 1 May 2024 (1).pdf
Pension dashboards forum 1 May 2024 (1).pdfPension dashboards forum 1 May 2024 (1).pdf
Pension dashboards forum 1 May 2024 (1).pdfHenry Tapper
 
Premium Call Girls Bangalore Call Girls Service Just Call 🍑👄6378878445 🍑👄 Top...
Premium Call Girls Bangalore Call Girls Service Just Call 🍑👄6378878445 🍑👄 Top...Premium Call Girls Bangalore Call Girls Service Just Call 🍑👄6378878445 🍑👄 Top...
Premium Call Girls Bangalore Call Girls Service Just Call 🍑👄6378878445 🍑👄 Top...vershagrag
 
Female Russian Escorts Mumbai Call Girls-((ANdheri))9833754194-Jogeshawri Fre...
Female Russian Escorts Mumbai Call Girls-((ANdheri))9833754194-Jogeshawri Fre...Female Russian Escorts Mumbai Call Girls-((ANdheri))9833754194-Jogeshawri Fre...
Female Russian Escorts Mumbai Call Girls-((ANdheri))9833754194-Jogeshawri Fre...priyasharma62062
 
7 steps to achieve financial freedom.pdf
7 steps to achieve financial freedom.pdf7 steps to achieve financial freedom.pdf
7 steps to achieve financial freedom.pdfthemoneyacademy07
 

Kürzlich hochgeladen (20)

Famous No1 Amil Baba Love marriage Astrologer Specialist Expert In Pakistan a...
Famous No1 Amil Baba Love marriage Astrologer Specialist Expert In Pakistan a...Famous No1 Amil Baba Love marriage Astrologer Specialist Expert In Pakistan a...
Famous No1 Amil Baba Love marriage Astrologer Specialist Expert In Pakistan a...
 
Call Girls in Yamuna Vihar (delhi) call me [🔝9953056974🔝] escort service 24X7
Call Girls in  Yamuna Vihar  (delhi) call me [🔝9953056974🔝] escort service 24X7Call Girls in  Yamuna Vihar  (delhi) call me [🔝9953056974🔝] escort service 24X7
Call Girls in Yamuna Vihar (delhi) call me [🔝9953056974🔝] escort service 24X7
 
Lion One Corporate Presentation May 2024
Lion One Corporate Presentation May 2024Lion One Corporate Presentation May 2024
Lion One Corporate Presentation May 2024
 
Dubai Call Girls Deira O525547819 Dubai Call Girls Bur Dubai Multiple
Dubai Call Girls Deira O525547819 Dubai Call Girls Bur Dubai MultipleDubai Call Girls Deira O525547819 Dubai Call Girls Bur Dubai Multiple
Dubai Call Girls Deira O525547819 Dubai Call Girls Bur Dubai Multiple
 
Bhubaneswar🌹Ravi Tailkes ❤CALL GIRLS 9777949614 💟 CALL GIRLS IN bhubaneswar ...
Bhubaneswar🌹Ravi Tailkes  ❤CALL GIRLS 9777949614 💟 CALL GIRLS IN bhubaneswar ...Bhubaneswar🌹Ravi Tailkes  ❤CALL GIRLS 9777949614 💟 CALL GIRLS IN bhubaneswar ...
Bhubaneswar🌹Ravi Tailkes ❤CALL GIRLS 9777949614 💟 CALL GIRLS IN bhubaneswar ...
 
Famous Kala Jadu, Black magic expert in Faisalabad and Kala ilam specialist i...
Famous Kala Jadu, Black magic expert in Faisalabad and Kala ilam specialist i...Famous Kala Jadu, Black magic expert in Faisalabad and Kala ilam specialist i...
Famous Kala Jadu, Black magic expert in Faisalabad and Kala ilam specialist i...
 
Significant AI Trends for the Financial Industry in 2024 and How to Utilize Them
Significant AI Trends for the Financial Industry in 2024 and How to Utilize ThemSignificant AI Trends for the Financial Industry in 2024 and How to Utilize Them
Significant AI Trends for the Financial Industry in 2024 and How to Utilize Them
 
Certified Kala Jadu, Black magic specialist in Rawalpindi and Bangali Amil ba...
Certified Kala Jadu, Black magic specialist in Rawalpindi and Bangali Amil ba...Certified Kala Jadu, Black magic specialist in Rawalpindi and Bangali Amil ba...
Certified Kala Jadu, Black magic specialist in Rawalpindi and Bangali Amil ba...
 
Solution Manual For Financial Statement Analysis, 13th Edition By Charles H. ...
Solution Manual For Financial Statement Analysis, 13th Edition By Charles H. ...Solution Manual For Financial Statement Analysis, 13th Edition By Charles H. ...
Solution Manual For Financial Statement Analysis, 13th Edition By Charles H. ...
 
✂️ 👅 Independent Bhubaneswar Escorts Odisha Call Girls With Room Bhubaneswar ...
✂️ 👅 Independent Bhubaneswar Escorts Odisha Call Girls With Room Bhubaneswar ...✂️ 👅 Independent Bhubaneswar Escorts Odisha Call Girls With Room Bhubaneswar ...
✂️ 👅 Independent Bhubaneswar Escorts Odisha Call Girls With Room Bhubaneswar ...
 
Strategic Resources May 2024 Corporate Presentation
Strategic Resources May 2024 Corporate PresentationStrategic Resources May 2024 Corporate Presentation
Strategic Resources May 2024 Corporate Presentation
 
2999,Vashi Fantastic Ellete Call Girls📞📞9833754194 CBD Belapur Genuine Call G...
2999,Vashi Fantastic Ellete Call Girls📞📞9833754194 CBD Belapur Genuine Call G...2999,Vashi Fantastic Ellete Call Girls📞📞9833754194 CBD Belapur Genuine Call G...
2999,Vashi Fantastic Ellete Call Girls📞📞9833754194 CBD Belapur Genuine Call G...
 
falcon-invoice-discounting-unlocking-prime-investment-opportunities
falcon-invoice-discounting-unlocking-prime-investment-opportunitiesfalcon-invoice-discounting-unlocking-prime-investment-opportunities
falcon-invoice-discounting-unlocking-prime-investment-opportunities
 
Call Girls in Tilak Nagar (delhi) call me [🔝9953056974🔝] escort service 24X7
Call Girls in Tilak Nagar (delhi) call me [🔝9953056974🔝] escort service 24X7Call Girls in Tilak Nagar (delhi) call me [🔝9953056974🔝] escort service 24X7
Call Girls in Tilak Nagar (delhi) call me [🔝9953056974🔝] escort service 24X7
 
Kopar Khairane Cheapest Call Girls✔✔✔9833754194 Nerul Premium Call Girls-Navi...
Kopar Khairane Cheapest Call Girls✔✔✔9833754194 Nerul Premium Call Girls-Navi...Kopar Khairane Cheapest Call Girls✔✔✔9833754194 Nerul Premium Call Girls-Navi...
Kopar Khairane Cheapest Call Girls✔✔✔9833754194 Nerul Premium Call Girls-Navi...
 
GIFT City Overview India's Gateway to Global Finance
GIFT City Overview  India's Gateway to Global FinanceGIFT City Overview  India's Gateway to Global Finance
GIFT City Overview India's Gateway to Global Finance
 
Pension dashboards forum 1 May 2024 (1).pdf
Pension dashboards forum 1 May 2024 (1).pdfPension dashboards forum 1 May 2024 (1).pdf
Pension dashboards forum 1 May 2024 (1).pdf
 
Premium Call Girls Bangalore Call Girls Service Just Call 🍑👄6378878445 🍑👄 Top...
Premium Call Girls Bangalore Call Girls Service Just Call 🍑👄6378878445 🍑👄 Top...Premium Call Girls Bangalore Call Girls Service Just Call 🍑👄6378878445 🍑👄 Top...
Premium Call Girls Bangalore Call Girls Service Just Call 🍑👄6378878445 🍑👄 Top...
 
Female Russian Escorts Mumbai Call Girls-((ANdheri))9833754194-Jogeshawri Fre...
Female Russian Escorts Mumbai Call Girls-((ANdheri))9833754194-Jogeshawri Fre...Female Russian Escorts Mumbai Call Girls-((ANdheri))9833754194-Jogeshawri Fre...
Female Russian Escorts Mumbai Call Girls-((ANdheri))9833754194-Jogeshawri Fre...
 
7 steps to achieve financial freedom.pdf
7 steps to achieve financial freedom.pdf7 steps to achieve financial freedom.pdf
7 steps to achieve financial freedom.pdf
 

Payout Policy: A Shareholder-Level Analysis

  • 1. Payout Policy: A Shareholder-Level Analysis Jennifer Blouin University of Pennsylvania (blouin@wharton.upenn.edu) Maria E. Nondorf University of California at Berkeley (nondorf@haas.berkeley.edu) First Draft: January 2004 This Version: February 18, 2004 Preliminary
  • 2. 1 Abstract This paper attempts to link the share repurchase decision with shareholder-level taxes. By looking at payout policy relative to insider, institutional and blockholder shareholdings, we document that the methods of distribution, either dividends or repurchases, appear to differ among the different classes of shareholders. To date, this is the most comprehensive study of shareholder composite on payout policy. Consistent with the tax clienteles hypothesis, we find that insider holdings are higher in firms who repurchase shares or do not distribute funds at all and lower in firms that distribute via only dividends or make distributions using both dividends and repurchases. In contrast, institutional holdings are higher in firms that distribute using dividends or a combination of dividends and repurchases and lower for firms that use repurchases or do not make any distributions. There are no such clear patterns in blockholder shareholdings. Furthermore, we find a positive association between firm repurchase activity and the interaction of our measures of influential investors and a measure of shareholders’ tax preference for capital gains. The sum of our evidence demonstrates that the tax status of influential shareholders plays a significant role in whether and how firms distribute proceeds to shareholders.
  • 3. 2 1. Introduction That share repurchases have become a prominent form of payout for U.S. corporations is incontrovertible. In response to this increase in prominence, recent academic research has documented that managers of firms had numerous firm-specific reasons for increasing their repurchase activity as an alternative to or as a supplement to dividend payouts (see, for example, Allen and Michaely (2003) for an overview of the payout policy literature and Brav, Graham, Harvey, and Michaely (2003) for managers’ perspectives from recent surveys and field interviews). Anecdotally, one of the determinants of share repurchase activity is their tax advantage relative to dividends for certain classes of shareholders (called the “tax clienteles hypothesis”).1 We attempt to link repurchase activity to the tax clienteles hypothesis by examining the ownership structure of firms that repurchase compared to firms that utilize other forms of distribution. Using detailed shareholder data, this paper seeks to link the puzzles surrounding payout policy to a group that is arguably the most affected by the payout decision, a firm’s shareholders. If a distribution is paid out as a dividend, it is fully taxable to certain classes of shareholders. But if it is paid out as a share repurchase, the payment results in a capital gain to shareholders in the amount of the difference between the cost of the shares and the repurchase value of the shares tendered. In addition to the difference between ordinary and capital gains tax rates, most of the capital gains on repurchases are accrued by shareholders not tendering their shares and are thus not realized. A large part of the dividend puzzle involves the argument that, if distributions are going to be made to shareholders, share repurchases are a relatively tax- 1 Note that we are examining what are called the “holding clienteles” (i.e., those shareholder groups who seek to buy and hold shares in a particular company based upon benefits derived from their particular shareholder tax status) as opposed to “trading clienteles” (i.e., those shareholders who buy and sell a stock based on a particular trading strategy for which their tax status provides relative benefits). Please see Dhaliwal, Erickson, and Trezevant (1999) for further distinction on this issue.
  • 4. 3 favorable method and should therefore be preferred to dividends (Black (1976) and Allen and Michaely (2003)). Again, this argument is only true for certain classes of investors, primarily individual investors. In order to examine the clienteles of firms that make payouts, we utilize a large sample of insider, institutional and blockholder shareholder data to evaluate the mix of shareholders for firms that undergo repurchases compared to firms that do not. We also examine the changes in shareholder mix around repurchases to evaluate the classes of shareholders who tender their shares in a repurchase program. Of course, analyzing the mix of shareholders for firms that make payoffs can address more than the tax clienteles hypothesis. Our research can also support evidence on other motives for making shareholder distributions. Our initial tests focus on the tax clienteles hypothesis because it is such a prominent feature of the dividend puzzle2 and using shareholder-level data can directly address the clienteles effect. Further, as discussed below, the results of existing research on tax clienteles have been decidedly mixed. As we consider insider owners to primarily be individual investors for tax purposes, we find evidence consistent with the tax clienteles hypothesis where influential insiders appear to affect payout policy. Supporting individual shareholders’ preferences for capital gains, we find significantly greater insider ownership in firms that either make no distributions or distribute only through repurchases relative to firms who pay out dividends. Furthermore, an analysis of the differential between insider ownership and institutional holdings for significant repurchasers (i.e., those that buy back more than 5% of their outstanding shares) is indicative of insider holdings increasing and institutional holdings decreasing. Said another way, those firms that are 2 As noted by Allen and Michaely (2003), individual shareholders pay substantial taxes for dividends that they receive. They report that over 50% of the dividends paid out by corporations from 1973-1996 were to individuals and most of these individuals were in high tax brackets.
  • 5. 4 large repurchasers have larger insider owners relative to instiutional holders, consistent with insiders desiring tax preferred repurchases. We examine institutional shareholders as one undifferentiated mass.3 By considering this group of shareholders together, we are able to hypothesize that these shareholders will be less sensitive to the spread between dividends and capital gains rates (as the group contains both non- taxable and taxable entities). Consistent with Grinstein and Michaely (2003), we find that firms with lower institutional ownership levels do not pay dividends or repurchase shares. Interestingly, when our measure for an individual’s preference for capital gains is interacted with institutional holdings, we find a positive association suggesting that institutions are sensitive to individual taxes. This is indicative of institutional investors passing through fund income to taxable individuals. No discernable relation between blockholders or diffuse non-influential shareholders is identified. The results for blockholders are consistent with those presented in Barclay, Holderness, and Sheehan (2003) who examine dividend payouts in the presence of corporate blockholders. These results are also consistent with the notion that these types of investors represent a broad mix of shareholder types that precludes differentiating between tax clienteles. The results of our research contribute to our understanding of firms’ payout policies in several important ways. First, we advance the study of tax clientele effects on payout policy. In addition to directly linking classes of shareholders to tax rates and payout policy, we have demonstrated that the shift in investor composite over time is related to increases in tax- advantaged repurchase activity. Further, we have shown that the shift in corporate payout behavior can be linked to the increase in individual shareholder participation in the market. 3 Future versions of this paper will delve into the details of our institutional owner database in an attempt to distinguish among institutional investors and their taxable form.
  • 6. 5 Second, because we use a comprehensive ownership dataset, we are able to assess the relative effects for each major shareholder group on payout policy. Existing research on payout policy examines only one class of shareholders in relation to firms’ payout decisions (see for example, Lee, Mikkelson, and Partch (1992) for analysis of insider trades around tender offer repurchase announcements and Lie and Lie (1999), Perez-Gonzalez (2003), and Grinstein and Michaely (2003) for analysis of institutional shareholders and various forms of payout; see also Barclay, Holderness, and Sheehan (2003) for a study examining the impact of large corporate blockholders on dividends). Controlling for all classes of shareholders extends our understanding of the different behavior of shareholder groups and will help to clarify the motives for payout policy as a corporate financing decision. Third, we contribute to the research that examines a more complete picture of firms’ payout policy by analyzing both dividends and repurchases.4 Much research on the tax clienteles hypothesis focuses solely on dividend payouts. (See, for example, Dhaliwal, Erickson, and Trezevant (1999), Ayers, Cloyd, and Robinson (2002), Dhaliwal, Li, and Trezevant (2003), and Perez-Gonzalez (2003).) Note that these studies also primarily focus on institutional shareholders as the group driving tax clienteles. Overall, our research contributes by presenting a comprehensive analysis of payout policy using a comprehensive breakdown of shareholdings. The paper proceeds as follows: section 2 discusses the general effects that various groups of shareholders bring to bear on corporate financing decisions. The section also covers related literature on the tax clienteles hypothesis and develops the specific hypotheses that we test. Section 3 highlights our data and sample selection procedures. Sections 4 through 6 present the 4 As noted in Allen and Michaely (2003), to truly examine the complete payout picture, researchers should also consider cash paid out in the form of liquidating dividends (from, for example, a merger or acquisition transaction). They also note that analysis of net payouts should consider the impact of inflows from equity offerings. Future drafts of this paper will consider these additional pieces of the payout picture.
  • 7. 6 empirical results of the tests of our hypotheses and section 7 provides our conclusions and directions for future work. 2. Background and Development of Hypotheses A large body of research in the past 30 years has linked the corporate financing decisions of firms to various classes of shareholders. There are generally considered to be four classes of shareholders that are examined. These broad classes are 1) insider shareholders, 2) institutional shareholders, 3) non-insider/non-insitutional blockholders (hereafter, “blockholders”), and 4) diffuse non-influential shareholders. In the following paragraphs, we briefly define each class and generally describe the theoretical and empirical characteristics that underlie the effects that each class has on firms’ corporate financing behavior, particularly their payout behavior.5 We also document our proposed link between each class and the tax clienteles hypothesis. 2.1 Insider Ownership One of the primary considerations regarding insider, primarily managerial, ownership is the principal-agent issues that can arise between managers and shareholders (e.g., Jensen and Meckling (1976), Holmstrom (1979), and Homstrom and Milgrom (1987)). There is a theoretically optimal amount of shares that managers should hold that will link their incentives to the incentives of the other shareholders while at the same time minimizing their private benefits and the probability of outside takeovers. Regarding the agency problem and payout policy, both dividends and repurchases are seen as a mechanism to disgorge the firm of free cash flow that could otherwise be used by managers in their own interests (Rozeff (1982), Easterbrook (1984), and Jensen (1986)). A 5 Please refer to section 3 for information regarding the construction of our empirical variables that link to these shareholder classes.
  • 8. 7 recent paper by Hu and Kumar (2004) examines managerial entrenchment in relation to firms’ payoff policies and finds that executive entrenchment levels have an asymmetric influence on dividend versus share repurchase payout policies. However, none of these papers consider the personal tax reasons that managers may have for undertaking a particular payout policy. 2.2 Institutional Ownership There is a great deal of debate surrounding the effects of institutional shareholders on corporate financing policy. The theoretical treatment of institutional shareholders differs greatly from that of insiders. While managers are viewed as receiving their equity stake as part of an optimal contract signed with shareholders, institutional investors are modeled as shareholder- monitors who choose their optimal equity stake through the open-market trading of shares. Examples of models that look at the optimal equity stake of monitors include Admati, Pleiderer, and Zechner (1994) and Maug (1998). The liquidity benefits and risk-diversification of dispersed ownership are contrasted with the control benefits of ownership concentration and their attendant free-rider problem. Grinstein and Michaely (2003) perform an extensive analysis of institutional shareholdings and payout policy. They summarize the effects of ownership structure, in particular, institutional shareholdings, on payout policy by spelling out the following theories. First, they discuss Jensen’s (1986) argument (as mentioned above), that institutions, in their roles as monitors, will induce higher overall payouts. Second, as posited by Allen, Bernardo, and Welch (2000), institutional shareholders may prefer firms that issue dividends (over those that repurchase or those that do not make any distributions) because of institutional charter and prudent-man rule restrictions and because of the comparative tax advantage that some institutions have for dividends. We discuss this implication for tax clienteles below.
  • 9. 8 Third, Grinstein and Michaely (2003) cite the differences in payout preferences between informed investors (of which institutional shareholders are often considered part) and uninformed investors as predicted by Barclay and Smith (1988) and Brennan and Thakor (1990). Uninformed (or dispersed) shareholders prefer dividends, which are distributed pro rata to all shareholders, compared to repurchases, which are only tendered by certain shareholders where the uninformed shareholders know that they do not possess the level of information of other shareholders (and, above all, managers). Thus, firms will separate into dividend-payers and repurchasers depending on the perceived level of information held by their shareholders. The empirical results of Grinstein and Michaely (2003) indicate that firms with higher institutional shareholdings prefer dividend-paying firms and firms that make regular repurchases. However, their results do not support models that predict that high dividends (in terms of yield) attract institutional clienteles (e.g., Allen, Bernardo, and Welch (2000)) or models that predict that institutions cause firms to increase their payouts (e.g., Jensen (1986)). Grinstein and Michaely’s (2003) results are important for our study because they document the link between institutional holdings and payout policy. However, we focus on the tax clienteles hypothesis, and more importantly, we control for other classes of shareholders in our analysis. 2.3 Blockholders Blockholders represent large, potentially influential shareholders that are neither insiders (managers) nor institutions. Much of the theory surrounding institutional shareholders can be applied to blockholders in that these shareholders are considered to affect corporate financing policy and are often considered to be more informed than diffuse individual shareholders. Blockholdings often lack the features that define institutions, such as reporting requirements and organizational structure and thus, can be comprised of one or more influential individuals or an
  • 10. 9 entity of any organizational form. Because of their perceived roles as monitors and because a blockholding is often considered a toe-hold for a future increase in ownership stake, much of the research on blockholders has focused on models of takeovers (e.g., Shleifer and Vishny (1986) and Hirshleifer and Titman (1990)). As far as payout policy preferences, the effect of monitors on payout levels (Jensen (1986)) would apply to blockholders. Further, the payout policy preferences of informed versus uninformed shareholders (Barclay and Smith (1988) and Brennan and Thakor (1990)) would also apply here, where blockholders would be considered relatively informed investors. Barclay, Holderness, and Sheehan (2003) empirically examine the effect of corporate block ownership on dividend policy, finding no evidence that dividends are higher for firms with corporate blockholders. As their primary hypothesis relates to the impact of corporate blockholders on tax clienteles, we defer further discussion of this paper for now. To our knowledge, with the exception of Barclay et. al. (2003), there has been no other empirical research focusing on the effects of outside blockholders on payout policy. 2.4 Diffuse Non-influential Shareholders To round out our comprehensive examination of firm shareholdings and payout policy, we consider the final class of shareholders to be those shareholders who own small percentages and are likely not able to affect the corporate financing decisions of firms. In theoretical cost- benefit terms, if institutional and blockholding shareholders are considered to be monitors, non- influential shareholders are considered to be free-riders. Further, if institutional and blockholding shareholders are considered to be informed, this class of shareholders is considered to be relatively uninformed.
  • 11. 10 Regarding payout policy, if these non-influential shareholders represent the majority of shareholders for an organization and/or there is no concentration of ownership among the other three classes, the relationship between the payout policy decision and level of diffuse ownership should be as predicted by the theories covered above. As far as we are aware, there is no other empirical study that explicitly controls for this shareholding class in its analysis. This shareholder class, while often considered to be comprised of individuals, can in reality take any organizational form, from individual to corporation, in our analysis. Thus, as discussed below, their effects on tax clienteles is ambiguous. 2.5 Tax Clienteles Tax clienteles exist because there is variation in the marginal tax rates of shareholders. Miller’s (1977) analysis of capital structure implies that dividend clienteles will exist whereby high dividend yield stocks will be held by low marginal tax rate investors and vice versa. To summarize the general predictions of payout policy and tax clienteles, we initially display a classification scheme as presented in Allen and Michaely (1995): Shareholder group: Asset holdings: High tax bracket Low dividend payout assets Corporations High dividend payout assets Tax-free institutions Any assets We recast this scheme based upon the consideration of share repurchases as a payout mechanism for our four classes of shareholdings as follows:
  • 12. 11 Shareholder class: Asset holdings: Insider shareholders • High tax bracket • Individuals • Low dividend payout assets • Repurchase payout assets Institutional shareholders • Taxable institutions • Tax-exempt institutions • Overall payout policy is less sensitive to tax effects than firms with influential insider shareholders Blockholders • Individuals • Corporations • Tax-exempt entities • Ambiguous tax effects Diffuse non-influential shareholders • Individuals • Corporations • Tax-exempt entities • Ambiguous tax effects We discuss these classifications in terms of our specific hypotheses, below. First, however, we discuss the extant literature on tax clienteles. Early empirical studies such as Elton and Gruber (1970), Miller and Scholes (1978 and 1982), and Litzenberger and Ramaswamy (1979, 1980, and 1982) examine the relation between stock returns, dividend yield, and the differential taxes between dividends and capital gains. The results of these and numerous other more recent empirical studies, which generally do not model the class of shareholder, are mixed. However, there is compelling recent evidence of clienteles in Graham and Kumar’s (2003) empirical study examining retail (i.e., individual) investors and their dividend preferences. They find that, as a group, these investors prefer non-dividend paying stocks over dividend paying stocks. Further, among their investor sample, lower-tax individuals hold high- yield stocks. This result fits well with our prediction that insider shareholders (and various sub- groups of blockholders and diffuse non-influential shareholders) prefer tax advantaged payouts.
  • 13. 12 Further, numerous studies have utilized the level of institutional shareholdings and/or corporate ownership as a proxy for the tax status of a firm’s investors (e.g., Dhaliwal, Erickson, and Trezevant (1999), Ayers, Cloyd, and Robinson (2002), Dhaliwal, Li, and Trezevant (2003)). Dhaliwal et. al. (1999) examine the effects of an initiation of dividend payouts on changes in institutional ownership percentages, concluding that institutional ownership increases when dividends are initiated by a corporation. Conditional upon whether or not dividends were paid, Ayers et. al. (2002) empirically examine whether the investor-level tax effects from the increase in ordinary (dividends) tax rates that was imposed the Revenue Recognition Act of 1993 affected firm stock returns. They find evidence of a clientele effect in that the level of institutional holdings mitigated the negative stock price reaction for dividend-paying firms. A closely-related study by Dahliwal et. al. (2003) examines the interaction of dividend yield and the institutional/corporate ownership indicator on stock returns. They conclude that stock returns are penalized by dividend taxes and that institutional/corporate ownership mitigates this penalty. One problem with using institutional shareholdings as the proxy for the tax status of investors is that institutional investors are comprised of both taxable (e.g., flow-thru mutual funds) and tax-exempt entities (e.g., college and pension funds). Strickland (1996) finds that, for a fairly comprehensive sample of corporations, the holdings of taxable institutions outweigh the holdings of tax-exempt institutional holdings. At any rate, our study builds on these results by considering shareholder classes beyond institutions and corporations and by also considering the repurchase mechanism as a form of payout.
  • 14. 13 In addition to Grinstein and Michaely’s (2003) study, discussed above, other papers have examined the effects of institutional shareholdings on method of payment. Lie and Lie (1999) hypothesize that decision-makers are more sensitive to shareholders’ tax positions if the firm has a large fraction of institutional investors. They assume that if this the case, firms with high institutional holdings will still prefer repurchases over tax-disfavored dividends despite the possibility that if institutional investors are affecting payout policy, and if they are tax-exempt, they would be indifferent between payout method (ceteris paribus).6 Examining all classes of ownership allows us to more accurately rank payout preference by ownership class. Perez-Gonzalez (2003) attempts to identify the influential shareholder in an organization and tests the association of the tax status of this influential party to levels of dividend payout. This approach allows him to differentiate between the tax incentive effects that the most concentrated shareholder may possess. He documents that in a number of firms, the largest shareholder is an individual blockholder. He also finds evidence that the dividend yield varies with the relative tax disadvantage of dividends (as compared to capital gains) over a period of time consistent with the largest shareholder influencing a firm’s proclivity to pay dividends. Similar to Perez-Gonzalez (2003) in the identification of an influential party, Barclay, Holderness, and Sheehan (2003), as noted above, identify corporate blockholders as an influential party in firms’ payout decisions. In fact, they posit that large corporate blockholders can request or even demand that management increase dividends. They call their perspective the “controlling shareholder view” of dividends. Barclay et. al. (2003) hypothesize that corporate shareholders will cause firms to issue high levels of dividends as these distributions have a small tax effect on corporations because of the dividends received deductions available to them. They 6 Although the authors hypothesize and discuss their tax clienteles hypothesis in relation to the level of institutional ownership, Lie and Lie’s (1999) study does not explicitly report any tests of the repurchase/dividend decision in association with institutional ownership.
  • 15. 14 find no evidence that large corporate shareholders are attracted to firms with high dividend payouts. Their results are counter to the clienteles hypothesis. However, they do not control for other classes of shareholders and again, this study does not examine repurchases. These studies go a long way into furthering our understanding of the clientele effects on payout policy. Our paper expands upon this research by examining the full composite of shareholdings (institutional shareholdings, plus insider, blockholder, and dispersion measures). We examine how the full mix of shareholdings correlates with the relative tax advantage of repurchasing over dividends. 2.6 Hypothesis Development The specific hypotheses that we test in this paper build on our knowledge of various shareholder classes, their potential impact on firms’ payout decisions, and their potential tax clientele effects. First, in order to confirm and slightly expand previous research on the influence of shareholder classes on payout policy, we propose the following hypothesis: H1A: All else equal, firms with higher levels of repurchase activity and firms that do not make distributions experience higher levels of insider ownership than firms that pay out dividends and firms that both issue dividends and pay repurchases. This hypothesis follows from the presumption that insiders are individual shareholders in higher marginal tax rates. And, as such, capital appreciation is their preferred mechanism to recognize investment profits. An associated hypothesis relates to institutional shareholders, as follows: H1B: All else equal, firms with positive distribution levels, whether dividends, or repurchases, or both, are associated with higher levels of institutional ownership than firms that do not make distributions. From a tax clientele perspective, this hypothesis is formulated based upon the prediction that institutional investors’ asset holdings should be less sensitive to tax effects than insiders.
  • 16. 15 Further, we would expect this result based on Grinstein and Michaely’s (2003) findings that institutions prefer firms that do make some level of dividend payouts and firms that repurchase. As noted above, the tax clientele effects of shareholder distributions are ambiguous for blockholders and diffuse non-influential shareholders. Thus, we have no tax-related predictions for these groups. However, it is important to include them in our analysis because of their potential effects on the non-tax motives for repurchasing. While the non-tax motives for distributions are expected to be similar for institutional shareholders and blockholders, these motives are expected to be quite different for non-monitor/less informed shareholders. The tax rate on repurchases relative to dividends has varied over time. To further examine whether shareholder composite alters a firm’s payout, we test whether the magnitude of the tax advantage of repurchases varies with changes in the spread between the capital gains and dividend tax rates. We predict that the effect on payout policy as related to taxable investors is increasing in the spread between capital gains and dividends tax rates. We present this as our second hypothesis. H2A: All else equal, the relation between repurchase activity and insider shareholdings is increasing in the magnitude of the spread between capital gains and dividend tax rates. This hypothesis seeks to find direct evidence that the insider shareholder class affects payout policy in relation to the tax impact of the payouts. We have a related prediction for institutional shareholdings based upon their relative insensitivity to tax rates, as follows: H2B: The relation between repurchase activity and institutional shareholdings, conditional upon the spread between capital gains and dividends tax rates, is less than for that of insider shareholdings. Again, we do not have tax-related predictions for our blockholder and diffuse non- influential shareholder groupings.
  • 17. 16 In an effort to substantiate our initial findings, we also look at firms that undertook significant repurchases (defined as greater than five percent of shares outstanding) to determine whether the capital gains preference proxy is associated with who is selling their shares. We examine if payout policy is related to shareholder tax preferences. Said another way, if certain types of shareholders prefer a certain type of payout for tax reasons, i.e., repurchases, then the spread should be related to who is selling. We surmise that the mix of shareholders for firms who pay out more in repurchases have a decreasing percentage of insider shareholders and an increasing percentage of institutional shareholders from before to after the repurchase program. This effect is increasing in the spread between capital gains and dividend tax rates. This leads to the following hypothesis: H3: All else equal, for firms with significant repurchases, insider ownership will decrease and institutional ownership will increase as a result of the repurchase program. 2.7 Causality - A Cavaet It is not entirely clear whether ownership structure determines payout policy (which is what we currently assume) or if payout policy determines corporate ownership. This is a critical concern that we have thought about as we developed our hypotheses and considered our empirical tests. This statement is a caveat of our awareness of the issue and our further consideration of the issue in future versions of the paper. 3. Data and Sample Selection 3.1 Ownership Data We begin our analysis using the equity ownership dataset developed in Brown, Goldman, and Nondorf (2003). Brown et. al. develop the dataset using disaggregated ownership data for
  • 18. 17 the majority of publicly traded U.S. corporations from the Compact Disclosure SEC Database CDs (“CompactD”) for the years 1988-2001. Using the CompactD data, Brown et. al. construct three mutually exclusive primary variables for equity ownership. We utilize their variables, constructed as follows: Insider Ownership (INSIDE%) is the sum of the shares held by officers and directors. Although non-officer and director beneficial owners of more than ten percent of the company stock (as custodians or trustees) are also considered insiders for SEC filing purposes, we consider such shareholders as better fitting the description of blockholders rather than insiders and therefore exclude such owners from the definition of insider ownership. Thus, this group is primarily comprised of shareholders who would be considered individuals for tax purposes.7 Institutional Ownership (INSTIT%) is the sum of shares held by institutions filing 13-F forms with the SEC. Investment companies, organizations, corporations, universities, and other groups with at least $100 million in equity assets must file 13-Fs on a quarterly basis. Due to the amalgamated nature of the type of entities in this classification, it is difficult to assess the ultimate tax status of these shareholders. Future work will involve the detailed classification of the tax status of significant institutional shareholders, similar to that performed by Perez- Gonzalez (2003). At this point, however, we assume that institutions as a whole class receive more favorable tax treatment for dividends (alone, and compared to capital gains) than the insider ownership group. This assumption appears reasonable because insiders likely earn wages taxed in the highest tax bracket for ordinary income whereas at least some portion of the institutional shareholders represent tax-free entities. 7 Other common types of insiders with significant holdings include family trusts and private investment partnerships, which may or may not be taxable entities. As noted above, because of their role as monitors (vs. managers) these types of insiders are considered in our “adjusted blockholder ownership” category.
  • 19. 18 Adjusted Blockholder Ownership (BLOCK%) is the sum of shares held by owners of at least five percent of a company’s shares, excluding insiders and institutional shareholders. Blockholder data are from SEC forms 13-D, 13-G, and 14D-1. To construct this measure, Brown et.al. (2003) sum the shares held by insiders and institutions that hold at least five percent of shares and subtract this from the sum of blockholder shares. The percentage ownership measures for the above variables are calculated using the total number of shares outstanding. Similar to Brown et. al. (2003), we use the maximum number of shares outstanding reported by CompactD, Compustat or CRSP.8 Number of Shareholders (NO_SHLDRS) is our proxy for the diffuseness of equity not owned by insiders, institutions or blockholders. We collect the total number of shareholders data from Compustat and subtract the number of insider and institutional shareholders. Like the other ownership variables, NO_SHLDRS is as of the beginning of the year. We examine the relation between payout and the previous year’s ownership measures (i.e., in every analysis the ownership variables represent lagged measures). To some extent, this approach mitigates our causality concerns. Further, we exclude firms in the financial services industry, ADRs, closed-end funds and REITs because the ownership mixes for certain firms may differ from what we hypothesize due to regulatory requirements. 8 As noted in Brown, Goldman, and Nondorf (2003), the shares outstanding data from CompactD most likely coincide in time with the ownership data, but these data are often missing. Taking the maximum from CRSP or Compustat helps to control for the few cases where there was a stock split between the fiscal year-end and the calendar year-end.
  • 20. 19 3.2 Measures of Payout Activity We match the Brown et. al. (2003) ownership dataset to firms in the Compustat Industrial Files. To remain in the sample, each firm-year observation must have information available to estimate items such as dividends, repurchases, and earnings. Repurchase Percentage (REPURCH%) is equal to repurchase activity in total dollars over the sum of total dollars paid in repurchases and common dividends. Repurchase Activity (REPURCH) is equal to the expenditures for the purchase of common and preferred stock (Compustat data item #115) minus any reduction in the value (redemption value) of the net number of preferred shares outstanding (Compustat data item #56). This is a commonly-used proxy for repurchase activity (see, for example, Grullon and Michaely (2002)). Common Dividends (DIVS) are the total dollar dividends declared on the common stock during the firm’s applicable fiscal year (Compustat data item #21). Similar to Grullon and Michaely (2002), we classify our sample firms into four payout policy groups as follows: Group 1: Firms that make no payouts during a fiscal year (DIVS = 0 and REPURCH = 0). Group 2: Firms that make payouts using only dividends (DIVS > 0 and REPURCH = 0). Group 3: Firms that make payouts using only repurchases (DIVS = 0 and REPURCH > 0). Group 4: Firms that make payouts using a mix of dividends and repurchases (DIVS > 0 and REPURCH > 0). 3.3 Other Variables of Interest Tax Spread (THETA_CG) represents our measure of the difference between capital gain tax rates and tax rates on ordinary income. Existing research examining effects of individual tax
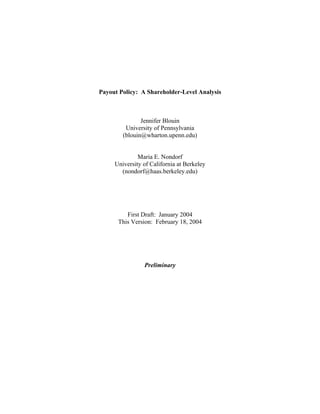
  • 21. 20 rates (e.g., Poterba and Summers (1985)) typically uses a measure of shareholder tax preferences - theta, θt. It is interpreted as the ratio of the net income that an investor receives from a dollar of dividends to the net income that the same investor would have received from capital gains and is defined as θt = [(1 - Maximum federal tax rate on ordinary income) / (1 - Maximum federal long- term capital gains tax rate)], assuming that the statutory tax rates for individuals are the effective rates.9 To ease the interpretation of tax effects in our analysis, we use THETA_CG, defined as (1- θt), as a proxy for individual shareholders’ preference for capital gains. See Table I for the distribution of THETA_CG over our sample period. Additional proxies are necessary to control for the numerous non-tax motives for payouts. These items include measures of the market value of equity, market-to-book, leverage, estimated stock option levels, operating income and prior-year returns. These variables are constructed from Compustat and CRSP data and are defined in Appendix 1. 4. The Level of Repurchases in Relation to Ownership Mix Our first hypothesis is whether or not shareholder composite ownership varies with corporate payout policy. Specifically, we hypothesize in H1A that because insiders tend to be subject to differential taxation between capital gains and dividends, they prefer payouts that are taxed as capital gains. Figure 1 plots mean INSIDE% over our sample period by firm payout policy grouping. Notice that although overall insider ownership is decreasing over time, it is highest in firms that either do not undergo distributions (Group 1) or that distribute only via 9 Assuming that individuals facing holding period incentives are in the top tax bracket seems reasonable based on the latest analysis of individual income tax returns (1997 returns) by the Statistics of Income (Internal Revenue Service (1999a, 1999b)). These statistics show that individuals in the maximum tax bracket (tax rate of 39.6%) accounted for 61% of all net capital gains (long-term and short-term capital gains less long-term and short-term capital losses). The percentage increases to 75% when individuals in the penultimate bracket (tax rate of 36%) are also considered.
  • 22. 21 repurchases (Group 3). Table II Panel A documents the mean and median INSIDE% by firm payout category. Confirming insiders’ preference for capital gains, the highest mean (median) ownership is in Group 1 and Group 3. In fact, Table II Panel B reports that there is no statistical difference in insider ownership between these two groups. However, both Groups 1 and 3 have significantly higher INSIDE% than either firms who pay only dividends (Group 2) or firms that payout using both dividends and repurchases (Group 4). H1B states that institutional shareholders prefer firms with some level of distributions, perhaps because of prudent-man requirements. Consistent with this hypothesis, Figure 2 documents that INSTIT% is highest in firms that pay dividends (Group 2) or both dividends and repurchases (Group 4). Corroborating that institutional shareholders prefer payout firms, firms that make no payout (Group 1) have the lowest level of institutional ownership. Panel B of Table II documents that Group 4, Group 2, and Group 3 all have institutional ownership at higher levels than Group 1 and all differences are statistically significant for both means and medians. Next, Figure 3 plots BLOCK% over time. Although we do not make any predictions on the relation between payout policy and blockholders, we find that their pattern of preference in payout policy more closely resembles that of insiders than institutions. Table II shows that the highest level of BLOCK% is in Group 1. Similar to INSIDE%, BLOCK% is not significantly different between Groups 1 and 3. In order to control for other shareholder groups in our analysis, Table IV presents a Tobit estimate of the relation between REPURCH% and shareholder composite. We estimate the relation between repurchase activity, shareholder composite, and variables likely to affect the repurchase decision.10 Results for Models 1 and 2 indicate that both INSIDE% and INSTIT% are 10 In this draft of the paper, we focus on repurchase activity using our measure REPURCH% as the dependent variable. This measure does not distinguish between firms that do not make any payouts (Group 1 firms) and firms
  • 23. 22 positively associated with repurchase activity. BLOCK% also appears to have a positive affect, albeit an insignificant one. The results from this first set of tests indicate that firms with larger insider holdings prefer repurchases, as do firms with larger institutional holdings. However, management’s apparent preference for repurchases or no payouts could be driven by non-tax reasons. First, agency issues (e.g., entrenchment) may drive management’s preference for no corporate payout whatsoever. Second, stock options are common form of compensation during our sample period and dividends dilute the value of stock options. In addition, the shift in repurchase behavior could be primarily attributable to the maintenance of option plans rather than changes in shareholder payout preferences. The next section attempts to mitigate potential confounding non-tax explanations for our results by incorporating a tax variable. 5. The Effect of Relative Tax Rates and Ownership Mix on the Level of Repurchases To explicitly test the tax clienteles hypothesis, we incorporate THETA_CG as our measure of individual shareholder preferences for capital gains relative to dividends. If findings in Table IV are indeed attributable to taxes, then greater individual shareholder preferences for capital gains will lead to a the positive association with REPURCH%. We incorporate THETA_CG and its interaction with INSIDE%, INSTIT% and BLOCK% into our regression model. As we posit that INSIDE% represents individual holdings, we expect that the relation between taxes and repurchases will be positive, as predicted in H2A. We also predict that this relation will be greater than for any other shareholder class, as in H2B. Table V presents the that utilize only dividends to make payouts (Group 2 firms) as both types of firms would have REPURCH% = 0. Future analysis will consider alternate measures to distinguish between all of the payout groups.
  • 24. 23 Tobit estimates of repurchase activity including the relation between THETA_CG and INSIDE%, INSTIT% and BLOCK%. Similar to Table IV, we find that INSIDE% and INSTIT% are positively associated with repurchase activity. BLOCK% continues to be unrelated to REPURCH%. Contrary to our predictions, the interaction between INSIDE% and THETA_CG is positive but insignificant; whereas the interaction between INSTIT% and THETA_CG is positive and significant. The insignificant relation between REPURCH% and the INSIDE% interaction term implies that agency issues and/or stock option compensation may drive the positive association between INSIDE% and REPURCH%.11 We intend to explore the agency and option issues in subsequent drafts of the paper. Interestingly, the significance of the interaction term for INSTIT% is indicative of institutional sensitivity to individual taxes. Because a large portion of institutional holdings are mutual funds and other flow-thru entities and would therefore pass through payout income to individual shareholders, it is possible that institutions shift their payout preferences towards repurchases in periods where they are relatively more tax advantaged. We hope to explore this phenomenon in more detail by understanding the entities that comprise INSTIT% and by focusing on INSTIT% in relation to firms that pay both dividends and repurchases (i.e., Group 4 firms). Finally, we included NO_SHLDRS as a measure of the dispersion of non-influential shareholders. We had no prediction of the relation between dispersion and payout policy. Table V documents an insignificant association between NO_SHLDRS and REPURCH%. 11 We attempt to control for stock option-related repurchase activity. However, our proxy is crude and may not be correlated with the true measure of insider option compensation. Subsequent tests will incorporate improved measures of executive option holdings.
  • 25. 24 6. Changes in Ownership Based on Payout Policy As a first-pass examination of the effects of repurchase programs on ownership mix, we estimate the relation between significant repurchasers and the spread between insider and institutional holdings. A firm is considered a significant repurchaser if it repurchases 5% or more of its outstanding shares during the course of a year. Tables II and IV documented that INSIDE% (INSTIT%) have a preference for repurchases (dividends) relative to dividends (repurchases). We define SPREAD as the difference between INSIDE% and INSTIT% thereby providing a relative measure of ownership. We predict a positive coefficient on SPREAD. Furthermore, in periods where capital gains are more tax advantaged, we expect this positive relation to be even stronger. Figure 4 plots SPREAD by payout policy over time. Although SPREAD has been decreasing steadily, the rate of descent is less for firms that repurchase than for dividend-paying firms. Table VI reports the results from a logistic estimation of the relation between significant repurchasers, SPREAD and THETA_CG. Consistent with insiders having a greater preference for repurchases relative to institutions, coefficient estimates on SPREAD and THETA_CG are positive and significant. 7. Conclusions and Directions for Future Research Overall, this study provides the most comprehensive examination of payout policy at the shareholder level to date. We have several interesting results that demonstrate the differences between various shareholder classes and repurchase and dividend activity. The sum of our evidence indicates that the tax status of influential shareholders plays a significant role in whether and how firms distribute proceeds to shareholders.
  • 26. 25 We have several issues to consider as we proceed with this line of research. As mentioned above, the causality of relationships is likely an important concern that should be addressed. Fortunately, there are several approaches that we will able to use to assess this matter. For example, Brown, Goldman, and Nondorf (2003) use a two-stage model that better- describes the functional form of the evolution of equity ownership than a simple linear model. An approach that controls for the autocorrelation in dividends is the vector-autoregressive regression model used by Grinstein and Michaely (2003). Using a system-of-equations approach such as those in these two studies of shareholder behavior should help us to address causality issues. Another task that will clarify our analysis is digging into the details behind several of the classes of shareholders, particularly institutional shareholders and blockholders. By examining the organizational structure of investors within these groups (building on such measures as those developed by Perez-Gonzalez (2003) and Barclay, Holderness, and Sheehan (2003)) we will be able to fine-tune our predictions, especially regarding the expected effects of tax clienteles. The Jobs and Growth Tax Relief Reconciliation Act of 2003 is bringing about dramatic changes that could affect firms’ payout policy. As the individual tax rate on dividends was cut to match that on capital gains, our THETA_CG measure effectively became zero. This would make individual shareholders indifferent between types of payout. In fact, Blouin, Raedy, and Shackelford (2004) show that aggregate dividends, particularly in the form of special dividends, rose 9% upon the change in tax law. The fact that this increase is primarily attributable to special dividends highlights the non-tax reasons that firms may avoid dividends. At any rate, the tax law changes have deep implications for tax clienteles motives and we intent to include this period in our analysis.
  • 27. 26 Finally, a natural next-step for our research will be to study the interrelation of payout policy, stock options and firms’ ownership mix. It is interesting to consider that when firms repurchase shares to reduce the perceived dilution of stock option exercises, there may be a shift in ownership mix. To maintain control, insiders may not tender their shares when repurchases are linked to stock option plans. However, in an effort to diversify their overall portfolios, insiders may participate in share repurchase programs when they receive stock options. Preliminary examination of our data shows that there appears to be a link between these factors. A future research project will attempt to understand this link.
  • 28. 27 Appendix 1 Variable Definitions Variable Variable Name Definition Source of Data Predicted Effect on Repurchases Ownership Data: Insider ownership INSIDE% Sum of shares held by officers and directors / Shares outstanding CompactD (Brown, et. al. (2003)) + Insititutional ownership INSTIT% Sum of shares held by institutions/ Shares outstanding CompactD (Brown, et. al. (2003)) ? Adjusted blockholder ownership BLOCK% Sum of shares held by non- insider, non-institutional owners of at least 5% / Shares outstanding CompactD (Brown, et. al. (2003)) ? Diffuse non-influential shareholders NO_SHLDRS Total number of shareholders less number of insider and institutional shareholders Compustat ? Measures of Payout Activity: Repurchase percentage REPURCH% REPURCH / (REPURCH + DIVS) Compustat N/A Repurchase activity ($) REPURCH Expenditures on the purchase of common and preferred stock (Item #115) minus reduction in the value of preferred shares outstanding (Item #56) Compustat N/A Common dividends DIVS Dividends declared on common stock (Item #21) Compustat N/A Prior year dividend yield LG_DIVYLD Prior year DIVS / Prior year market value of equity (Item #24 * Item #25) Compustat ? Relative Tax Measure: Tax spread THETA_CG (also θtCG) 1 - [(1-Maximum federal tax rate on ordinary income) / (1- Maximum federal long-term capital gain rates)] See Table I + Control Variables: Earnings EARN Total earnings before extraordinary items (Item #18) Compustat + Total assets ASSETS Book value of total assets (Item #6) Compustat N/A Market value of equity MVE Market value of common equity (Item #24 * Item #25) Compustat + Market-to-book MKT_BOOK (Book value of total assets (Item #6) plus MVE minus book value of equity (Item #216)) / Book value of total assets Compustat ?
  • 29. 28 Variable Variable Name Definition Source of Data Predicted Effect on Repurchases Cash balance CASH Book value of cash and short- term assets (Item #1) Compustat + Avg. operating income OP_INC Three-year average of operating income (Item #13) Compustat + Leverage LEVERAGE Book value of total assets (Item #6) - book value of equity (Item #216) / Shares outstanding (Item #25) Compustat ? Signal dummy SIGNAL Equals 1 if the firm’s stock price decreased over the preceding year; 0, otherwise CRSP + Options outstanding OPT_SHR Difference between shares used to calculate basis EPS (Item #54) and shares used to calculate diluted EPS (Item #171) / Shares outstanding (Item #25) Compustat + Return on assets ROA Operating income (Item #13) / Book value of total assets (Item #6) Compustat ? Non-operating return on assets NONOP_ROA Non-operating income (Item #61) / Book value of total assets (Item #6) Compustat +
  • 30. 29 References Admati, Anat, Paul Pfleiderer, and Josef Zechner, 1994, Large shareholder activism, risk sharing and financial market equilibrium, Journal of Political Economy 102: 1097-1131. Allen, Franklin, Antonio Bernardo and Ivo Welch, 2000, A theory of dividends based on tax clienteles, The Journal of Finance 55: 2499-2536. Allen, Franklin and Roni Michaely, 1995, Dividend policy, Handbooks in OR and MS, Volume 9, edited by R. Jarrow et al., Elsevier Science B.V.: 793-837. Allen, Franklin and Roni Michaely, forthcoming, Payout policy, North-Holland Handbook of Economics, edited by George Constantinides, Milton Harris and Rene Stulz. Ayers, Benjamin, Bryan Cloyd, and John Robinson, 2002, The effect of shareholder-level dividend taxes on stock prices: Evidence from the Revenue Reconciliation Act of 1993, Accounting Review 77: 933-947. Barclay, Michael J. and Clifford W. Smith Jr., 1988, Corporate payout policy: Cash dividends versus open-market repurchases, Journal of Financial Economics 22: 61-82. Barclay, Michael J., Clifford G. Holderness, and Dennis P. Sheehan, 2003, Dividends and dominant corporate shareholders, working paper, University of Rochester, Boston College and Pennsylvania State University. Black, Fischer, 1976, The dividend puzzle, Journal of Portfolio Management 2: 5-8. Blouin, Jennifer L., Jana S. Raedy, and Douglas Shackelford, 2004, Did dividends increase immediately after the 2003 reduction in tax rates? working paper, University of North Carolina at Chapel Hill and University of Pennsylvania. Brav, Alon, John R. Graham, Campbell R. Harvey, and Roni Michaely, 2003, Payout policy in the 21st Century, working paper, Duke University, National Bureau of Economic Research, and Cornell University. Brennan, Michael J. and Anjan V. Thakor, 1990, Shareholder preferences and dividend policy, Journal of Finance 45: 993-1018. Brown, Gregory W., Eitan Goldman, and Maria E. Nondorf, 2003, The evolution of equity ownership, working paper, The University of North Carolina at Chapel Hill and University of California at Berkeley. Dhaliwal, Dan S., Merle Erickson, and Robert Trezevant, 1999, A test of the theory of tax clienteles for dividend policies, National Tax Journal 52: 179-194.
  • 31. 30 Dhaliwal, Dan S., Oliver Li, and Rober Trezevant, 2003, Is a dividend tax penalty incorporated into the return on a firm’s common stock? Journal of Accounting and Economics 35: 155-178. Easterbrook, Frank H., 1984, Two agency-cost explanations of dividends, American Economic Review 74: 650-659. Elton, Edward and Martin Gruber, 1970, Marginal stockholders’ tax rates and the clientele effect, Review of Economics and Statistics 52: 68-74. Graham, John and Alok Kumar, 2003, Do dividend clienteles exist? Evidence on dividend preferences of retail investors, working paper, Duke University and University of Notre Dame. Grinstein, Yaniv and Roni Michaely, 2003, Institutional holdings and payout policy, working paper, Cornell University. Grullon, Gustavo and Roni Michaely, 2002, Dividends, share repurchases, and the substitution hypothesis, Journal of Finance 57: 1649-1684. Hirshleifer, David and Sheridan Titman, 1990, Share tendering strategies and the success of hostile takeover bids, Journal of Political Economy 98: 295-324. Holmstrom, Bengt, 1979, Moral hazard and observability, Bell Journal of Economics 10: 74-91. Holmstrom, Bengt and Paul Milgrom, 1987, Aggregation and linearity in the provision of intertemporal incentives, Econometrica 55: 303-328. Hu, Aidong and Praveen Kumar, 2004, Managerial entrenchment and payout policy, Journal of Financial and Quantiative Analysis (forthcoming). Jensen, Michael C., 1986, Agency costs of free cash flow, corporate finance, and takeovers, American Economic Review 76: 323-329. Jensen, Michael C. and William Meckling, 1976, Theory of the firm: Managerial behavior, agency costs, and ownership structure, Journal of Financial Economics 3: 305-360. Lee, D. Scott, Wayne H. Mikkelson, and M. Megan Partch, 1992, Managers’ trading around stock repurchases, Journal of Finance 47: 1947-1961. Lie, Erik and Heidi J. Lie, 1999, The role of personal taxes in corporate decisions: An empirical analysis of share repurchases and dividends, Journal of Financial and Quantitative Analysis 34: 533-552.
  • 32. 31 Litzenberger, Robert and Krishna Ramaswamy, 1979, The effects of personal taxes and dividend on capital asset prices: Theory and empirical evidence, Journal of Financial Economics 7: 163-195. Litzenberger, Robert and Krishna Ramaswamy, 1980, Dividends, short selling restrictions, tax induced investor clientele and market equilibrium, Journal of Finance 35: 469-482. Litzenberger, Robert and Krishna Ramaswamy, 1982, The effects of dividends on common stock prices: Tax effects or information effects? Journal of Finance 37: 429-443. Maug, Ernst, 1998, Large shareholders as monitors: Is there a tradeoff between liquidity and control? Journal of Finance 53: 65-98. Miller, Merton, 1977, Debt and taxes, Journal of Finance 32: 261-276. Miller, Merton and Myron Scholes, 1978, Dividends and taxes, Journal of Financial Economics 6: 333-364. Miller, Merton and Myron Scholes, 1982, Dividends and taxes: Empirical evidence, Journal of Political Economy 90: 1118-1141. Perez-Gonzalez, Francisco, 2003, Large shareholder dividends: Evidence from U.S. tax reforms, working paper, Columbia University. Poterba, James and Lawrence Summers, 1985, The economic effects of dividend taxation, Recent Advances in Corporate Finance, edited by Altman and Subramanyam, Homewood. Rozeff, Michael S., 1982, Growth, beta and agency costs as determinants of dividend payout ratios, Journal of Financial Research 5: 249-259. Shleifer, Andrei and Robert Vishny, 1986, Large shareholders and corporate control, Journal of Political Economy 94: 461-488. Strickland, Deon, 1996, Determinants of institutional ownership: Implications for dividend clienteles, working paper, The University of North Carolina at Chapel Hill.
  • 33. 32 0 0.02 0.04 0.06 0.08 0.1 0.12 0.14 0.16 0.18 0.2 1989 1990 1991 1992 1993 1994 1995 1996 1997 1998 1999 2000 2001 2002 Year INSIDE% DIVS = 0, REPURCH = 0 DIVS > 0, REPURCH = 0 DIVS = 0, REPURCH > 0 DIVS > 0, REPURCH > 0 Figure 1. Distribution of insider ownership of firms by payout method. This figure depicts the distribution of insider ownership percentage (INSIDE%) for a sample of U.S. firms. We determine the payout policy of a firm by observing the cash disbursements of the firm over a period of a year. The sample includes all firms included in Compustat and the dataset described in Brown et al (2003) over the period 1989 and 2002. REPURCH is the expenditure on the purchase of common and preferred stocks (Compustat item #115) minus any reduction in the value (redemption value) of the net number of preferred shared outstanding (Compustat item #56). DIVS is the total dollar amount of dividends declared on the common stock (Compustat item #21). INSIDE% is the number of shares owned by inside management over shares outstanding.
  • 34. 33 0 0.1 0.2 0.3 0.4 0.5 0.6 1989 1990 1991 1992 1993 1994 1995 1996 1997 1998 1999 2000 2001 2002 Year INSTIT% DIVS = 0, REPURCH = 0 DIVS > 0, REPURCH = 0 DIVS = 0, REPURCH > 0 DIVS > 0, REPURCH > 0 Figure 2. Distribution of institutional ownership of firms by payout method. This figure depicts the distribution of institutional ownership percentage (INSTIT%) for a sample of U.S. firms. We determine the payout policy of a firm by observing the cash disbursements of the firm over a period of a year. The sample includes all firms included in Compustat and the dataset described in Brown et al (2003) over the period 1989 and 2002. REPURCH is the expenditure on the purchase of common and preferred stocks (Compustat item #115) minus any reduction in the value (redemption value) of the net number of preferred shared outstanding (Compustat item #56). DIVS is the total dollar amount of dividends declared on the common stock (Compustat item #21). INSTIT% is the number of shares owned by institutions over shares outstanding.
  • 35. 34 0 0.05 0.1 0.15 0.2 0.25 0.3 0.35 0.4 0.45 1989 1990 1991 1992 1993 1994 1995 1996 1997 1998 1999 2000 2001 2002 Year BLOCK% DIVS = 0, REPURCH = 0 DIVS > 0, REPURCH = 0 DIVS = 0, REPURCH > 0 DIVS > 0, REPURCH > 0 Figure 3. Distribution of blockholder ownership of firms by payout method. This figure depicts the distribution of blockholder ownership percentage (BLOCK%) for a sample of U.S. firms. We determine the payout policy of a firm by observing the cash disbursements of the firm over a period of a year. The sample includes all firms included in Compustat and the dataset described in Brown et al (2003) over the period 1989 and 2002. REPURCH is the expenditure on the purchase of common and preferred stocks (Compustat item #115) minus any reduction in the value (redemption value) of the net number of preferred shared outstanding (Compustat item #56). DIVS is the total dollar amount of dividends declared on the common stock (Compustat item #21). BLOCK% is shares held by non-institution and non-inside management blockholders scaled by shares outstanding.
  • 36. 35 -0.6 -0.5 -0.4 -0.3 -0.2 -0.1 0 0.1 1989 1990 1991 1992 1993 1994 1995 1996 1997 1998 1999 2000 2001 2002 Year Spread DIVS = 0, REPURCH = 0 DIVS > 0, REPURCH = 0 DIVS = 0, REPURCH > 0 DIVS > 0, REPURCH > 0 Figure 4. Distribution of spread between insider and institutional ownership of firms by payout method. This figure depicts the distribution of the spread between insider (INSIDE%) and institutional ownership (INSTIT%) for a sample of U.S. firms. We determine the payout policy of a firm by observing the cash disbursements of the firm over a period of a year. The sample includes all firms included in Compustat and the dataset described in Brown et al (2003) over the period 1989 and 2002. REPURCH is the expenditure on the purchase of common and preferred stocks (Compustat item #115) minus any reduction in the value (redemption value) of the net number of preferred shared outstanding (Compustat item #56). DIVS is the total dollar amount of dividends declared on the common stock (Compustat item #21). INSIDE% is the number of shares owned by inside management over shares outstanding. INSTIT% is the number of shares owned by institutions over shares outstanding.
  • 37. 36 Table I THETA_CG from 1988-2002 Date Statutory tax rate for dividends (i.e., ordinary income) (A) Statutory tax rate for long-term capital gains (B) Theta (1-(A))/(1-(B)) THETA_CG 1 - [(1-(A))/(1-(B))] 1/1/88—1/1/89 28 28 1.000 0 1/2/89—12/31/90 28 28 1.000 0 1991—1992 31 28 0.958 0.042 1/1/93—5/6/97 39.6 28 0.838 0.162a 5/7/97—12/31/97 39.6 20 0.755 0.245a 1998-2000 39.6 20 0.755 0.245 2001 39.1 20 0.761 0.239 2002 38.6 20 0.768 0.232 a The 1997 THETA_CG is averaged assuming 4 months of 0.162 and 8 month of 0.245.
  • 38. 37 Table II Firm Characteristics by Payout Policy This table reports descriptive statistics by payout policy for a sample of U.S. firms. We determine the payout policy of a firm by observing the cash disbursements from 1989 to 2002. The sample is the intersection of the Compustat and Brown et al (2003) datasets. The data sample contains 45,520 firm-year observations and excludes banks, utilities and insurance companies. REPURCH is the expenditure on the purchase of common and preferred stocks (Compustat item #115) minus any reduction in the value (redemption value) of the net number of preferred shared outstanding (Compustat item #56). DIVS is the total dollar amount of dividends declared on the common stock (Compustat item #21). MVE is the market value of common stock (Compustat data #24 times Compustat item #25). ASSETS is the book value of assets (Compustat item #6). OP_INC is operating income per share (Compustat item #13/Compustat item #25). OPT_SHR is our proxy for exercisable stock option shares estimated as the number of shares used in computing diluted EPS (Compustat item #171) less shares used in computing basic EPS (Compustat item #54) divided by shares outstanding (Compustat item #25). LEVERAGE is debt per share which is the book value of assets minus the book value of equity ((Compustat item #6 – Compustat item #216)/Compustat item #25). LG_DIVYLD is the prior year’s dividend yield (Compustat item #21t-1/(Compustat item #24 t-1 times Compustat item #25 t-1)). MKT_BOOK is the market-to-book ratio ((book value of assets + market value of equity – book value of equity)/book value of assets). SIGNAL is a dummy variable that equals 1 if the firm’s buy and hold return of the prior return was negative; 0 otherwise. INSIDE% is the number of shares owned by inside management over shares outstanding. INSTIT% is the number of shares owned by institutions over shares outstanding. BLOCK% is shares held by non-institution and non-inside management blockholders scaled by shares outstanding. NO_SHLDRS is a measure of the diffusion of the non-influential owners, which is defined as the total number of shareholders less the number of institutions, insiders and blockholders. REPURCH% is the ratio of repurchases (REPURCH) over total payout (REPURCH +DIVS). The significance levels of the means (medians) are based on a two-tailed t-test (two-tailed Wilcoxon rank test). Panel A: Descriptive Statistics GROUP 1 GROUP 2 GROUP 3 GROUP 4 DIVS = 0, REPURCH = 0 DIVS > 0, REPURCH = 0 DIVS = 0, REPURCH > 0 DIVS > 0, REPURCH > 0 N = 25,708 N = 5,799 N = 8,159 N = 6,099 Mean Median Mean Median Mean Median Mean Median MVE 418.63 44.64 2,273.28 309.86 881.15 79.26 5400.53 570.99 ASSETS 320.18 53.93 3,026.11 383.25 600.30 103.82 6,089.91 604.39 MKT_BOOK 3.51 1.45 1.63 1.31 1.85 1.26 1.75 1.42 CASH 19.56% 9.22% 9.78% 4.24% 19.62% 11.05% 9.69% 4.80% ROA -4.04% 6.60% 13.92% 13.63% 6.15% 10.84% 16.10% 15.55% NONOP_ROA 0.69% 0.62% 0.87% 0.50% 1.24% 0.75% 0.92% 0.53% DIVS 0.00 0.00 43.32 4.58 0.00 0.00 97.61 8.59 REPURCH 0.00 0.00 0.00 0.00 20.61 1.09 108.86 7.25 REPURCH% 0.00 0.00 0.00 0.00 100% 100% 45.51% 46.13% INSIDE% 12.96% 6.88% 9.86% 3.76% 12.73% 6.96% 8.70% 3.16% INSTIT% 22.76% 15.45% 39.85% 39.30% 31.81% 25.78% 44.41% 45.54% BLOCK% 32.68% 21.68% 23.70% 13.33% 30.41% 21.41% 22.78% 13.03% NO_SHLDRS 5,077 780 16,971 1,929 5,196 992 31,131 3,179
  • 39. 38 Panel B: Univariate Analysis - Test of Differences Comparison is column to row. Above diagonal, test of means; below diagonal, test of medians. All comparisons are significant at the 0.001 level except the bolded statistics. GROUP 1 GROUP 2 GROUP 3 GROUP 4 INSIDE% INSTIT% BLOCK% INSIDE% INSTIT% BLOCK% INSIDE% INSTIT% BLOCK% INSIDE% INSTIT% BLOCK% GROUP 1 – INSIDE% - - - 14.72 - - 1.12 - - 19.55 - - GROUP 1 – INSTIT% - - - - -51.72 - - -30.51 - - -67.63 - GROUP 1 – BLOCK% - - - - - 9.74 - - 2.71 - - 10.85 GROUP 2 – INSIDE% -19.41 - - - - - -12.11 - - 3.82 - - GROUP 2 – INSTIT% - 50.59 - - - - - 18.81 - - -10.89 - GROUP 2 – BLOCK% - - -17.23 - - - - - -7.79 - - 1.34 GROUP 3 – INSIDE% 0.1631 - - -16.84 - - - - - 16.54 - - GROUP 3 – INSTIT% - 29.44 - - 20.71 - - - - - -30.69 - GROUP 3 – BLOCK% - - 0.0349 - - -15.68 - - - - - 8.63 GROUP 4 – INSIDE% -24.06 - - 2.91 - - -20.76 - - - - - GROUP 4 – INSTIT% - 64.00 - - -10.82 - - 31.89 - - - - GROUP 4 – BLOCK% - - -18.59 - - 0.2112 - - -16.93 - - -
  • 40. 39 Table III Summary Statistics for Sample Control Variables This table displays descriptive statistics for the various repurchase control variables. THETA_CG is the proxy for individual capital gains preference. See Table I for computation. OP_INC is operating income per share (Compustat item #13/Compustat item #25). OPT_SHR is our proxy for exercisable stock option shares estimated shares used in computing diluted EPS (Compustat item #171) less shares used in computing basic EPS (Compustat item #54) divided by shares outstanding (Compustat item #25). EPS is the earnings before extraordinary per share (Compustat #18/Compustat item #25). LEVERAGE is debt per share which is the book value of assets minus the book value of equity ((Compustat item #6 – Compustat item #216)/Compustat item #25). LG_DIVYLD is the prior year’s dividend yield (Compustat item #21t-1/(Compustat item #24 t-1 times Compustat item #25 t-1)). MKT_BOOK is the market-to-book ratio ((book value of assets + market value of equity – book value of equity)/book value of assets). SIGNAL is a dummy variable that equals 1 if the firm’s buy and hold return of the prior return was negative; 0 otherwise. The number of observations is 45,520. Mean Median Std. Dev THETA_CG 0.17496 0.16111 0.070841 EPS 35.069 1.454 511.153 LEVERAGE 1 068.2 43.505 12 216.45 LG_DIVYLD 0.1716 0 32.61 OPT_SHR 0.025178 0 0.68931 OP_INC 169.262 9.184 1 160.78 MKT_BOOK 2.74199 1.38622 65.4275 SIGNAL 0.56165 1 0.49619
  • 41. 40 Table IV The Effect of Ownership Composite on Repurchase Activity: Tobit Estimates This table provides estimates of the relation between repurchases, shareholder composite and variables likely to affect the repurchase decision. REPURCH% is the ratio of repurchases (REPURCH) over total payout (REPURCH + DIVS). REPURCH is the expenditure on the purchase of common and preferred stocks (Compustat item #115) minus any reduction in the value (redemption value) of the net number of preferred shared outstanding (Compustat item #56). DIVS is the total dollar amount of dividends declared on the common stock (Compustat item #21). INSIDE% is the number of shares owned by inside management over shares outstanding. INSTIT% is the number of shares owned by institutions over shares outstanding. BLOCK% is shares held by non-institution and non-inside management blockholders scaled by shares outstanding. NO_SHLDRS is a measure of the diffusion of the non- influential owners, which is defined as the total number of shareholders less the number of institutions, insiders and blockholders. MVE is price (Compustat item #24). OP_INC is operating income per share (Compustat item #13/Compustat item #25). OPT_SHR is our proxy for exercisable stock option shares estimated shares used in computing diluted EPS (Compustat item #171) less shares used in computing basic EPS (Compustat item #54) divided by shares outstanding (Compustat item #25). EPS is the earnings before extraordinary per share (Compustat #18/Compustat item #25). LEVERAGE is debt per share which is the book value of assets minus the book value of equity ((Compustat item #6 – Compustat item #216)/Compustat item #25). LG_DIVYLD is the prior year’s dividend yield (Compustat item #21t-1/(Compustat item #24 t-1 times Compustat item #25 t-1)). MKT_BOOK is the market-to-book ratio ((book value of assets + market value of equity – book value of equity)/book value of assets). SIGNAL is a dummy variable that equals 1 if the firm’s buy and hold return of the prior return was negative; 0 otherwise. Industry dummy variables are included. The actual equation estimated is a two-tailed Tobit truncated at both zero and one. Standard errors are given in parentheses below the estimated coefficients. Model 1 Model 2 Intercept -2.0165*** -1.8729*** (0.067) (0.074) INSIDE% 0.4894*** 0.5227*** (0.093) (0.098) INSTIT% 2.0132*** 1.7234*** (0.061) (0.066) BLOCK% 0.0224 0.0191 (0.023) (0.024) EPS 0.0000 (0.000) MVE 0.0070*** (0.001) LEVERAGE 0.0000 (0.000) LG_DIVYLD -0.2136 (0.186) OPT_SHR -0.0087 (0.028) MKT_BOOK -0.1356*** (0.008) OP_INC 0.0000*** (0.008) SIGNAL -0.0507* (0.029) Log-likelihood -37399.62 -35773.14 *,**,*** significant at the 0.10, 0.05 or 0.01 levels, respectively.
  • 42. 41 Table V The Effect of Ownership Composite and Taxes on Repurchase Activity: Tobit Estimates This table provides estimates of the relation between repurchases, shareholder composite and variables likely to affect the repurchase decision. REPURCH% is the ratio of repurchases (REPURCH) over total payout (REPURCH + DIVS). REPURCH is the expenditure on the purchase of common and preferred stocks (Compustat item #115) minus any reduction in the value (redemption value) of the net number of preferred shared outstanding (Compustat item #56). DIVS is the total dollar amount of dividends declared on the common stock (Compustat item #21). INSIDE% is the number of shares owned by inside management over shares outstanding. INSTIT% is the number of shares owned by institutions over shares outstanding. BLOCK% is shares held by non-institution and non-inside management blockholders scaled by shares outstanding. NO_SHLDRS is a measure of the diffusion of the non-influential owners, which is defined as the total number of shareholders less the number of institutions, insiders and blockholders. OP_INC is operating income per share (Compustat item #13/Compustat item #25). OPT_SHR is our proxy for exercisable stock option shares estimated shares used in computing diluted EPS (Compustat item #171) less shares used in computing basic EPS (Compustat item #54) divided by shares outstanding (Compustat item #25). EPS is the earnings before extraordinary per share (Compustat #18/Compustat item #25). LEVERAGE is debt per share which is the book value of assets minus the book value of equity ((Compustat item #6 – Compustat item #216)/Compustat item #25). LG_DIVYLD is the prior year’s dividend yield (Compustat item #21t-1/(Compustat item #24 t-1 times Compustat item #25 t-1)). MKT_BOOK is the market-to-book ratio ((book value of assets + market value of equity – book value of equity)/book value of assets). SIGNAL is a dummy variable that equals 1 if the firm’s buy and hold return of the prior return was negative; 0 otherwise. Industry dummy variables are included. The actual equation estimated is a two-tailed Tobit truncated at both zero and one. Standard errors are given in parentheses below the estimated coefficients. *,**,*** significant at the 0.10, 0.05 or 0.01 levels, respectively.
  • 43. 42 Model 1 Model 2 Intercept -2.3170*** -2.1331*** (0.096) (0.102) THETA_CG 2.0879*** 2.8544*** (0.402) (0.436) INSIDE% 0.5209** 0.5544** (0.231) (0.250) INSIDE%*THETA_CG 0.3082 0.5449 (1.277) (1.356) INSTIT% 1.3534*** 0.8362*** (0.170) (0.184) INSTIT%*THETA_CG 2.9384*** 3.8004*** (0.845) (0.896) BLOCK% 0.0530 0.0550 (0.048) (0.050) BLOCK%*THETA_CG -0.2915 -0.3736 (0.301) (0.317) NO_SHLDRS 0.0000 0.0000 (0.000) (0.000) EPS 0.0000 (0.000) MVE 0.0080*** (0.001) LEVERAGE 0.0000*** (0.000) LG_DIVYLD -0.1158 (0.145) OPT_SHR -0.0123 (0.030) MKT_BOOK -0.1438*** (0.008) OP_INC 0.0000*** (0.000) SIGNAL -0.0912*** (0.029)
  • 44. 43 Table VI Logistic Regression of Significant Repurchasers This table provides estimates of the relation between significant repurchasers and the spread between insider and institutional holdings. The dependent variable if 1 if a firms is a significant repurchaser; 0 otherwise. A firm is considered a significant repurchaser if it repurchases 5% or more of its outstanding shares. SPREAD is INSIDE% minus INSTIT%. THETA_CG is the proxy for individual capital gains preference. INSIDE% is the number of shares owned by inside management over shares outstanding. INSTIT% is the number of shares owned by institutions over shares outstanding. OP_INC is operating income per share (Compustat item #13/Compustat item #25). OPT_SHR is our proxy for exercisable stock option shares estimated shares used in computing diluted EPS (Compustat item #171) less shares used in computing basic EPS (Compustat item #54) divided by shares outstanding (Compustat item #25). EPS is the earnings before extraordinary per share (Compustat #18/Compustat item #25). LEVERAGE is debt per share which is the book value of assets minus the book value of equity ((Compustat item #6 – Compustat item #216)/Compustat item #25). LG_DIVYLD is the prior year’s dividend yield (Compustat item #21t- 1/(Compustat item #24 t-1 times Compustat item #25 t-1)). MKT_BOOK is the market-to-book ratio ((book value of assets + market value of equity – book value of equity)/book value of assets). SIGNAL is a dummy variable that equals 1 if the firm’s buy and hold return of the prior return was negative; 0 otherwise. Industry dummy variables are included. Standard errors are given in parentheses below the estimated coefficients. *,**,*** significant at the 0.10, 0.05 or 0.01 levels, respectively. Intercept 0.3655*** 0.1863*** 0.0462 0.0488 THETA_CG 1.3418*** 1.1394*** 0.1504 0.1675 SPREAD 0.5326*** 0.2644*** 0.0826 0.0848 SPREAD*THETA_CG 0.9126** 1.2096*** 0.4297 0.4335 EPS -0.00003 0.000026 MVE -0.00758*** 0.000653 LEVERAGE -6.41E-07 1.10E-06 LG_DIVYLD -0.0246 0.0207 OPT_SHR 0.00217 0.0141 MKT_BOOK 0.1158*** 0.00557 OP_INC 0.000028 0.000029 SIGNAL 0.1992*** 0.0201 Psuedo R2