2008 Metrics for agile software development
•
2 gefällt mir•844 views

Some metrics for agile teams

Empfohlen
Weitere ähnliche Inhalte
Was ist angesagt?
Was ist angesagt? (20)
Andere mochten auch
Andere mochten auch (11)
Ähnlich wie 2008 Metrics for agile software development
Ähnlich wie 2008 Metrics for agile software development (20)
Mehr von Andreas Wintersteiger
Kürzlich hochgeladen
Kürzlich hochgeladen (20)
2008 Metrics for agile software development
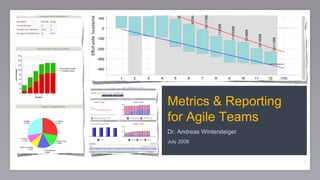
- 1. Metrics & Reporting for Agile Teams Dr. Andreas Wintersteiger July 2008 1
- 2. © Copyright 2008 Objectbay Software & Consulting GmbH. All Rights reserved. Reporting we want from agile teams Planning outlook: When will something be able to be released? Sprints: day to day execution focus Backlog, Release plans: a strategic view, long term focus Real time visibility of capability impediments, risks staffing issues, technical risks 2
- 3. © Copyright 2008 Objectbay Software & Consulting GmbH. All Rights reserved. Agile Development Reporting Planning outlook Capability Productivity Quality Financial Numbers 3
- 4. © Copyright 2008 Objectbay Software & Consulting GmbH. All Rights reserved. Planning outlook Release Burndown Chart Story Board Feature Burnup Feature Completion 4
- 5. © Copyright 2008 Objectbay Software & Consulting GmbH. All Rights reserved. Release Planning Release Burndown Chart, Advanced Burndown Release Plan date driven planning, e.g. quarterly releases feature driven Reported at product level 5
- 6. © Copyright 2008 Objectbay Software & Consulting GmbH. All Rights reserved. Task Board Facilitation and common understanding about our team’s progress Shows current backlog items by degree of completion Aggregation of Task-Board at product level Reported manually on a pinwall or whiteboard at team level 6
- 7. © Copyright 2008 Objectbay Software & Consulting GmbH. All Rights reserved. Feature/Scope Burnup Shows the state of scope delivery towards a deadline Introduction of a „final QA“ phase as shown usable in trasition to TDD. In a fully working agile environment not recommended. Reported at product level 7
- 8. © Copyright 2008 Objectbay Software & Consulting GmbH. All Rights reserved. Feature completion Shows a list of features (a set of stories each, themes) and the respective number of stories done. Variations from „Parking Lot Diagram“ to lists and red-yellow-green state lists. Reported at product level 8
- 9. © Copyright 2008 Objectbay Software & Consulting GmbH. All Rights reserved. Running Tested Features Stories that provide value to the product and are completely tested.(UAT). A story is said to “pass” if all of its acceptance tests pass and runs regressively Ron Jeffries introduced Running Tested Features as a metric that forces agility 9
- 10. © Copyright 2008 Objectbay Software & Consulting GmbH. All Rights reserved. Productivity Output Velocity Time to Life Focus Factor Commitment Adherence 10 Capability Impediments Risks
- 11. © Copyright 2008 Objectbay Software & Consulting GmbH. All Rights reserved. Output Earned Business Value (EBV): Sum of business value of „done“ features Optional use relative weighting (see P.O.-Course) Optional use Cumulative Diagrams Was has been delivered in terms of „usable Software“ (potentially shipable product,„done“)? Reported at team level, product level and total per Sprint, per Release 11 48 52 51 52 30.000 37.333 44.667 52.000 59.333 Sprint 13 Sprint 14 Sprint 15 Sprint 16
- 12. © Copyright 2008 Objectbay Software & Consulting GmbH. All Rights reserved. Velocity Total Number of Story Points „Done“ (equals „Output“ in Story Points). Story Points are relative and specific to a team Reported at team level, product level and total 12 102 110 106 113 30 29 30 31 24 28 28 30 0 15 30 45 60 75 90 105 120 Sprint 13 Sprint 14 Sprint 15 Sprint 16
- 13. © Copyright 2008 Objectbay Software & Consulting GmbH. All Rights reserved. Time To Life (Story Cycle Time) Average number of working days (hours) between a backlog item introduced (prioritized) and „done“ Level of granularity: story, feature Reported at team level, product level and total 13 28 26 19 21 24 22 18 21 0 5 10 15 20 25 30 35
- 14. © Copyright 2008 Objectbay Software & Consulting GmbH. All Rights reserved. Focus Factor Indication about how focused a team is (disturbance and defects) where V is the team‘s velocity an T is it‘s available time for the sprint (days). Reported at team level 14 F = V T
- 15. © Copyright 2008 Objectbay Software & Consulting GmbH. All Rights reserved. Commitment adherence How good is a team in estimating its sprint commitments? where V is a teams actual velocity and V´ the corresponding estimation. Reported at team level 15 C = V V´
- 16. © Copyright 2008 Objectbay Software & Consulting GmbH. All Rights reserved. Quality Product Qualtity Defect rates Defect life time Code complexity, CRAP Performance Usability Process Quality Project health Backlog quality Degree of test automation Test coverage 16
- 17. © Copyright 2008 Objectbay Software & Consulting GmbH. All Rights reserved. Defect rates Tracks the number of evident defects by product in levels of severity TDD teams should always try to have the defect rate at zero towards the end of an iteration Reported at team level, product level and in total 17
- 18. © Copyright 2008 Objectbay Software & Consulting GmbH. All Rights reserved. Defect life time Boxplot, with minimum, average and maximum defect lifetime: number of total days (hours) between a defect introduced and resolved, by severity. Reported at team level, product level and total 18
- 19. © Copyright 2008 Objectbay Software & Consulting GmbH. All Rights reserved. Code Coverage Number of code lines covered by all automated tests Answer to the question „how much of our code is actually covered by our automated tests“ helps discover „dead code“ Output of various unit testing Tand coverage tools allows drill down from top level into single source files 19
- 20. © Copyright 2008 Objectbay Software & Consulting GmbH. All Rights reserved. Code Complexity McCabe‘s Complexity number (cc) helps detect potential bugs and hazardous code locations in the source code returns a number >0 that indicates the total complexity of a method (function). This numbers will be condensed for the whole source code to an average complexity number Reported at product level with drill down into class/module and method level 20
- 21. © Copyright 2008 Objectbay Software & Consulting GmbH. All Rights reserved. Code Complexity Distribution Shows the distribution of complexity (cumulative) over methods. Slope (steepness) of logarithmic distribution graph is the indication the higher, the better 2.0 seems to be a demarcation line for TDD-projects, who provide for better complexity figures Presented at Agile 2008 21
- 22. © Copyright 2008 Objectbay Software & Consulting GmbH. All Rights reserved. CRAP How „crappy“ is our codebase? Combination of code coverage and code complexity: complex methods should have a high coverage. Gives a number between 1 and ∞, where anything higher than 30 means „completly crap“ and numbers below 10 should be achieved. Reported over the whole codebase 22
- 23. © Copyright 2008 Objectbay Software & Consulting GmbH. All Rights reserved. On the horizon: Panopticode - a 30.000ft view Shows a graphical representation of a complete codebase as a field: complexity, coverage & crappyness, ... „A project dedicated to making code metrics so widely understood, valuable, and simple that their use becomes ubiquitous, thus raising the quality of software across the industry“ Project has just started... 23
- 24. © Copyright 2008 Objectbay Software & Consulting GmbH. All Rights reserved. Project Health A combination of feel and evidence. Team sensibilities like stress level, gut feeling for completion etc. as a total of individual measures. For example indication -5 to +5 on a gauge showing hot and cool. 24
- 25. © Copyright 2008 Objectbay Software & Consulting GmbH. All Rights reserved. Static Code Analysis Integrated in CI as a proactive measure for quality and code hyginie Bug Pattern analysis tools (correctness, bad practises, smells) Code Smells Overcomplicated expressions, complex code Dead Code, unneccessary code Code duplications, Wastes (Strings, Performance) Coding styles... 25
- 26. © Copyright 2008 Objectbay Software & Consulting GmbH. All Rights reserved. Financial Numbers Cost & Business Value (NPV) Internal Rate of Return (IRR, ROI) Payback Period 26
- 27. © Copyright 2008 Objectbay Software & Consulting GmbH. All Rights reserved. A Combination of Feel and Evidence something feels good we feel like getting better time to life metrics defects and requirements the raw number of days between when we actually introduce something into the backlog and when we actually turned it around to customers 27