
Empfohlen
Weitere ähnliche Inhalte
Ähnlich wie Salarios mínimos nacionales en la ue 2017
Ähnlich wie Salarios mínimos nacionales en la ue 2017 (20)
Kürzlich hochgeladen
Kürzlich hochgeladen (20)
Salarios mínimos nacionales en la ue 2017
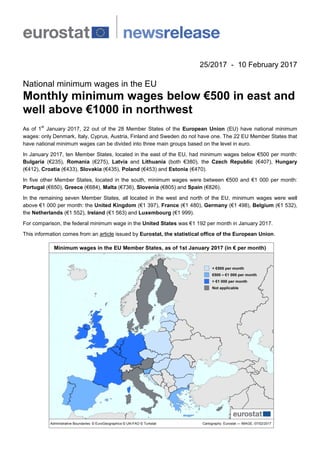
- 1. 25/2017 - 10 February 2017 National minimum wages in the EU Monthly minimum wages below €500 in east and well above €1000 in northwest As of 1 st January 2017, 22 out of the 28 Member States of the European Union (EU) have national minimum wages: only Denmark, Italy, Cyprus, Austria, Finland and Sweden do not have one. The 22 EU Member States that have national minimum wages can be divided into three main groups based on the level in euro. In January 2017, ten Member States, located in the east of the EU, had minimum wages below €500 per month: Bulgaria (€235), Romania (€275), Latvia and Lithuania (both €380), the Czech Republic (€407), Hungary (€412), Croatia (€433), Slovakia (€435), Poland (€453) and Estonia (€470). In five other Member States, located in the south, minimum wages were between €500 and €1 000 per month: Portugal (€650), Greece (€684), Malta (€736), Slovenia (€805) and Spain (€826). In the remaining seven Member States, all located in the west and north of the EU, minimum wages were well above €1 000 per month: the United Kingdom (€1 397), France (€1 480), Germany (€1 498), Belgium (€1 532), the Netherlands (€1 552), Ireland (€1 563) and Luxembourg (€1 999). For comparison, the federal minimum wage in the United States was €1 192 per month in January 2017. This information comes from an article issued by Eurostat, the statistical office of the European Union.
- 2. Gap reduced from 1 to 9 in euro to 1 to 3 when minimum wages are expressed in PPS Across the 22 Member States concerned, minimum wages range from less than 300 euros per month in both Bulgaria (€235) and Romania (€275) to just below 2 000 euros a month in Luxembourg (€1 999). In other words, the highest minimum wage in the EU is around 9 times the lowest. Minimum wages in the EU Member States, as of 1st January 2017 (in € per month) 0 500 1 000 1 500 2 000 Bulgaria Romania Latvia Lithuania Czech Republic Hungary Croatia Slovakia Poland Estonia Portugal Greece Malta Slovenia Spain United Kingdom France Germany Belgium Netherlands Ireland Luxembourg However, the disparities in minimum wages across the EU States are considerably smaller once price level differences are eliminated: minimum wages in those Member States with relatively lower price levels become relatively higher when expressed in purchasing power standard (PPS), and relatively lower in those Member States with higher price levels. The gap is reduced to a ratio of about 1:3, ranging from 501 PPS per month in Bulgaria to 1 659 PPS in Luxembourg. Minimum wages closest to median earnings in Portugal, France and Slovenia Minimum wages may also be measured in relative terms, i.e. as a proportion of the median gross monthly earnings. In 2014, among Member States concerned and for which data on median earnings are available, minimum wages were above 60% of the median gross monthly earnings in only three Member States: Portugal (64%), France and Slovenia (both 62%). In contrast, minimum wages were less than half of the median earnings in seven Member States: the Czech Republic (39%), Estonia (40%), Ireland and Spain (both 45%), Slovakia (46%), Malta (48%) and the United Kingdom (49%). Minimum wages decreased compared with 2008 only in Greece Compared with 2008, minimum wages in 2017, expressed in euro, increased in every Member State having a national minimum wage, except Greece where they dropped by 14%. Between 2008 and 2017, minimum wages doubled in Bulgaria (+109%) and Romania (+99%). In addition, Slovakia (+80%) as well as the three EU Baltic Member States – Estonia (+69%), Latvia (+65%) and Lithuania (+64%) – also recorded significant increases.
- 3. Geographical information In January 2017, Belgium, Bulgaria, the Czech Republic, Germany (since 1 st January 2015), Estonia, Ireland, Greece, Spain, France, Croatia, Latvia, Lithuania, Luxembourg, Hungary, Malta, the Netherlands, Poland, Portugal, Romania, Slovenia, Slovakia, and the United Kingdom had a national minimum wage as defined below. Methods and definitions Minimum wage statistics, published bi-annually by Eurostat, refer to monthly national minimum wages applied on 1 January and 1 July each year. The national minimum wage usually applies to all employees, or at least to a large majority of employees in a country. It is fixed at an hourly, weekly or monthly rate, and is enforced by law, often after consultation with social partners, or directly by a national inter-sectorial agreement. Minimum wages are generally presented as monthly wage rates for gross earnings, that is, before the deduction of income tax and social security contributions payable by the employee; these deductions vary from country to country. Country notes: For those countries where the national minimum wage is not fixed at a monthly rate (for example, where minimum wages are specified on an hourly or weekly basis) the level of the minimum wage is converted into a monthly rate according to conversion factors supplied by the countries: Germany: (hourly rate x 39.1 hours x 52 weeks) / 12 months (the value 39.1 hours results from the quarterly earnings survey and relates to mean basic hours per week for full time employees in NACE Rev.2 sections B to S).The national minimum wage is €8.84 per hour Ireland: (hourly rate x 39 hours x 52 weeks) / 12 months. The national minimum wage is €9.25 per hour France: (hourly rate x 35 hours x 52 weeks) / 12 months. The national minimum wage is €9.76 per hour Malta: (weekly rate x 52 weeks) / 12 months. The national minimum wage is €169.76 per week United Kingdom: (hourly rate x mean basic paid hours per week for full-time employees in all sectors x 52.18 weeks) / 12 months. The national minimum wage is £7.20 per hour United States: (hourly rate x 40 hours x 52 weeks) / 12 months. The national minimum wage is $7.25 per hour In addition, when the minimum wage is paid for more than 12 months per year (as in Greece, Spain and Portugal, where it is paid for 14 months a year), data have been adjusted to take these payments into account. Additional information, including country-specific information, is available on the Eurostat website here. Data on national minimum wages are submitted to Eurostat in national currency. For the non-euro area countries, minimum wages in national currencies are converted into euro by applying the monthly exchange rate as recorded at the end of the previous month (for example, the rate at the end of December 2016 was used for calculating minimum wages in euro as of 1 January 2017). It should be noted that for those EU Member States outside of the euro area that have minimum wages (Bulgaria, the Czech Republic, Croatia, Hungary, Poland, Romania and the United Kingdom), as well as for the United States, the levels and developments of minimum wages expressed in euro may differ from those expressed in national currency, due to exchange rate effects. To remove the effect of differences in price levels between the countries, special conversion rates called purchasing power parities (PPPs) are used. PPPs for household final consumption expenditure in each country are used to convert the monthly minimum wages expressed in euro or national currencies to an artificial common unit called the purchasing power standard (PPS). Median earnings refer to the level of earnings which divides the employees into two equal groups: half earn less than the median and half earn more. Data refer to the gross monthly earnings covering the wages and salaries earned by full-time and part-time employees in the reference month (general October 2014) before any tax and social security contributions are deduced. Wages and salaries include overtime pay, shift premiums, allowances, bonuses, commission, etc. The gross monthly earnings of part-time employees have been converted into full-time units before being included in the average with the same weight as full time employees. Excluding part-time employees from the calculation of median gross monthly earnings impacts minimum wage/ median earnings. In particular, it would impact the ratio downwards by more than 5 percentage points for the Netherlands (49% instead of 56%), Germany (47% instead of 53%) and the United Kingdom (44% instead of 49%). The 2014 annual averages of the exchange rate were used in converting national (non-euro) currencies into euro. Median earnings have been derived from Structure of Earnings Survey data (SES 2014) and calculated for all enterprises with more than 10 employees except those belonging to NACE rev.2 section O (Public administration and defence; compulsory social security). Apprentices are excluded. For more information Eurostat website section dedicated to earnings statistics. Eurostat database on earnings. Eurostat metadata on minimum wages. Eurostat news release 246/2016 of 8 December 2016 on low-wage earners. Eurostat news release of 248/2016 12 December 2016 on earnings distribution. Eurostat Statistics Explained article on minimum wage statistics. Issued by: Eurostat Press Office Vincent BOURGEAIS Tel: +352-4301-33 444 eurostat-pressoffice@ec.europa.eu Production of data: Ines KOLAKOVIC Tel: +352-4301- 32 179 estat-earncost@ec.europa.eu ec.europa.eu/eurostat/ @EU_Eurostat Media requests: Eurostat media support / Tel: +352-4301-33 408 / eurostat-mediasupport@ec.europa.eu
- 4. Minimum wages in the EU (in € per month) 1 st January 2008 1 st January 2014 1 st January 2017 Change 2017/2008 Proportion of the median earnings (2014) Belgium 1 310 1 502 1 532 +17% 52% Bulgaria 112 174 235 +109% 57% Czech Republic 300 310 407 +36% 39% Denmark - - - - - Germany ** - 1 440*** 1 498 - 53% Estonia 278 355 470 +69% 40% Ireland ** 1 462 1 462 1 563 +7% 45% Greece 794 684 684 -14% : Spain 700 753 826 +18% 45% France ** 1 280 1 445 1 480 +16% 62% Croatia 380* 396 433 +14% : Italy - - - - - Cyprus - - - - - Latvia 230 320 380 +65% 52% Lithuania 232 290 380 +64% 52% Luxembourg 1 570 1 921 1 999 +27% 56% Hungary 272 342 412 +51% 54% Malta ** 617 718 736 +19% 48% Netherlands 1 335 1 486 1 552 +16% 56% Austria - - - - - Poland 313 404 453 +45% 52% Portugal 497 566 650 +31% 64% Romania 139 190 275 +99% 50% Slovenia 539 789 805 +49% 62% Slovakia 241 352 435 +80% 46% Finland - - - - - Sweden - - - - - United Kingdom ** 1 242 1 251 1 397 +13% 49% United States ** 689 911 1 192 +73% : : Data not available - Not applicable * 1st July 2008 ** See country notes *** 1st January 2015 The source dataset can be found here. Minimum wages per month in national currency for non-euro area countries 1 st January 2008 1 st January 2014 1 st January 2017 Change 2017/2008 Bulgaria BGN 220 340 460 +109% Czech Republic CZK 8 000 8 500 11 000 +38% Croatia HRK 2 747* 3 018 3 276 +19% Hungary HUF 69 000 101 500 127 500 +85% Poland PLN 1 126 1 680 2 000 +78% Romania RON 500 850 1 250 +150% United Kingdom ** GBP 911 1 043 1 196 +31% United States ** USD 1 014 1 257 1 257 +24% * 1st July 2008 ** See country notes The source dataset can be found here.
- 5. Minimum wages per month in purchasing power standards* in the EU 1 st January 2008 1 st January 2014 1 st January 2017 Belgium 1 211 1 425 1 453 Bulgaria 224 458 501 Czech Republic 444 579 644 Denmark - - - Germany ** - 1 436 1 493 Estonia 377 590 645 Ireland ** 1 156 1 266 1 280 Greece 877 805 805 Spain 740 843 910 France ** 1 173 1 401 1 415 Croatia 520*** 632 663 Italy - - - Cyprus - - - Latvia 301 538 553 Lithuania 360 575 625 Luxembourg 1 389 1 596 1 659 Hungary 400 630 723 Malta ** 797 908 917 Netherlands 1 304 1 408 1 433 Austria - - - Poland 476 815 881 Portugal 590 754 793 Romania 230 463 551 Slovenia 665 994 1 012 Slovakia 375 612 658 Finland - - - Sweden - - - United Kingdom ** 1 012 1 147 1 236 United States ** 860 1 033 1 033 * PPS for 2014 are estimated. ** See country notes *** 1st July 2008 - Not applicable The source dataset can be found here.